Simulation of Fatigue Stiffness Degradation in Prestressed Concrete Beams under Cyclic Loading
1 Introduction According to the 2nd National Highway Survey of China[1], there were 278 809 highway bridges up to the year 2000, most of which were prestressed concrete (PC) bridges. The survey also reported that 9 597 of these bridges were unsafe for use and were mostly constructed during the 1980s and 1990s. By 2012, the number of highway bridges had increased to approximately 713 400, with many more of them becoming unsafe by that time. Unsafe bridges mainly exhibit excessive deflection and cracks, especially in large span PC structures. A significant example is the secondary channel bridge over the Humen River in Guangdong province, China, which is a PC continuous rigid frame bridge main span (150 m+270 m+150 m) . It opened to traffic in 1997 and to November 2003, the deflection of the beam left and right lines had increased to 222 mm, and 207 mm, respectively. Other typical examples of excessive deflection are listed in Table 1. Ordinary railways, passenger-dedicated lines, and high-speed railway systems have been developed rapidly in China and have spurred the construction of many PC bridges on the railway lines. A number of these railway bridges also face the same problems. For example, cracks were discovered at the midspan on a PC continuous bridge on the Jiaoji dedicated line after two year’s operation and some bridges on passenger and freight transport high-speed railways have exhibited excessive deflection. The problems are even more serious on the heavy-haul railways. As a result, the Chinese National Ministry of Transport and the National Ministry of Railways have recently attached a great importance to the excessive deflection due to fatigue.
表 1

Table 1 Excessive deflection of some PC beam bridges around the world
|
Bridge |
Country |
Year completed |
Years of operation |
Span (m) |
Excessive deflection (mm) |
|
Parrotts Bridge |
U. S. |
1973 |
12 |
195 |
635 |
|
Koror-Babeldaob Bridge |
Palau |
1978 |
12 |
241 |
1 200 | |
Stovset Bridge |
Norway |
1993 |
8 |
220 |
200 | |
Sanmenxia Yellow River Bridge |
China |
1993 |
10 |
140 |
220 | |
Jinsha Bridge in Nanhai |
China |
1994 |
6 |
120 |
220 | |
Stolma Bridge |
Norway |
1998 |
3 |
301 |
92 |
|
Table 1 Excessive deflection of some PC beam bridges around the world
|
There are several reasons for the excessive deflection of and cracks in PC bridges, which include the shrinkage and creep of concrete, degradation of prestressed steel strands, fatigue, and overloading. These factors interact with each other, with fatigue being one of the critical reasons. To study the stiffness degradation of PC beams under fatigue, it is necessary to first conduct a study of the material fatigue performance. Many researchers have studied the fatigue of concrete[2-8]. Recent studies have focused on modeling[9-11]. Fatigue performances of prestressed concrete and partially prestressed concrete beams have been reported in early studies[12-16], which mostly focused on fatigue life or crack development. Some researchers also studied the fatigue reliability of prestressed concrete bridges[17-18]. With the development of fiber-reinforced polymer (FRP) and carbon FRP (CFRP) , the fatigue behavior of FRP/CFRP reinforced prestressed concrete has been studied as well[19-20]. However, stiffness degradation of PC bridges under fatigue requires further investigation.
This study focused on the stiffness degradation of prestressed concrete beams under fatigue. Cyclic loading tests were conducted on six PC beams. A fatigue stiffness degradation simulation model was generated based on stiffness analysis of the damaged section. The damaged elastic modulus and effective residual area were introduced in the model to account for the amount of damage to the concrete and steel. An adjusted three-stage concrete fatigue damage evolution model was introduced to describe the fatigue damage in concrete and the parameters are fitted. The strip method was used to track the changing damage value of concrete along the depth of the section caused by the changing stress. The simulation results were compared with the experimental results. A fatigue deflection prediction method based on the simulation model was presented and discussed.
2 Cyclic Loading Test
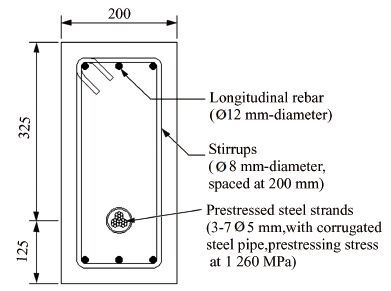
2. 1 General Information The test beams were 3. 3 m long with an effective span of 3 m. The cross section is shown in Fig. 1. The steel strands in test beams were straight. And the concrete strength grade of the test beam was 50 MPa. The 28 d strength of the tests standard cubes are shown in Table 2. The tension control stress is 1 260 MPa under the anchor. Longitudinal rebar and stirrups were designed to meet the detailed requirements of the General Code for Design of Highway Bridges and Culverts[21] and the Code for Design of Highway Reinforced Concrete and Prestressed Concrete Bridges and Culverts[22].
表 2

Table 2 The 28 d strength of the tests standard cubes
| Test beam | Loading(kN) | Mean compressive strength(MPa) | Strength grade(%) |
|
Monodrome |
Mean value |
| 1 375 | | | |
| FTG-B1 | 1 349 | 1 372. 0 | 61 | 122 |
| 1 392 | | | |
| 1 390 | | | |
| FTG-B2 | 1 419 | 1 412. 0 | 62. 8 | 126 |
| 1 427 | | | |
| 1 398 | | | |
| FTG-B3 | 1 475 | 1 454. 3 | 64. 6 | 129 |
| 1 490 | | | |
| 1 512 | | | |
| FTG-B4 | 1 500 | 1 506. 3 | 66. 9 | 134 |
| 1 507 | | | |
| 1 498 | | | |
| FTG-B5 | 1 531 | 1 519. 3 | 67. 5 | 135 |
| 1 529 | | | |
| 1 479 | | | |
| FTG-B6 | 1 498 | 1 505. 7 | 66. 9 | 134 |
| 1 540 | | | |
|
Table 2 The 28 d strength of the tests standard cubes
|
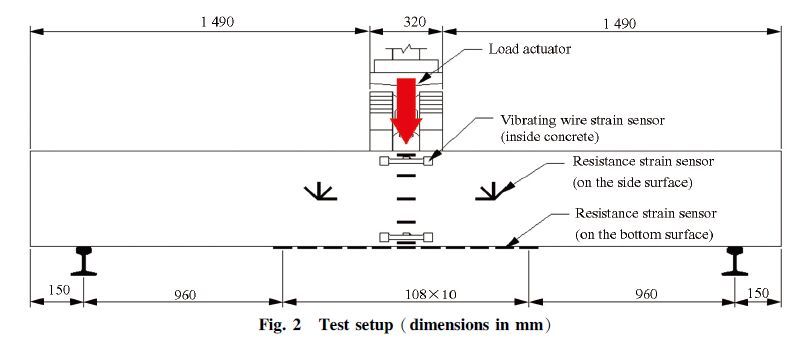
The test setup is shown in Fig. 2. It was designed as a simply supported beam under loading at the span center. Deflection meters were set at the middle and 1/4 lengths of the span. Cyclic loading was applied using an MTS hydraulic jack with load control. The loading frequency was set to 6 Hz which depends on the laboratory apparatus and the actual bridge engineering. The cyclic loading tests were designed to meet the detailed requirements of the Standard Methods for Testing of Concrete Structure[23].
2. 2 Test Procedure and Loading Protocol
The details of the loading protocol for each test beam are shown in Table 3. They were tested monotonically until failure for the control beams. The expected failure mode was steel reinforcement yielding.
They were subjected to the static loading 1 every 200 000 cycles or when the loading level changed for the fatigue beams. The loading protocol of static loading 1 is shown in Fig. 3. After the cyclic loading test, the fatigue beams FTG-B3-B6 were also tested by the static loading 2 (Table 4) monotonically until failure.
表 3

Table 3 Loading protocols
| Test beam | Cycles (103) | Maximum loading level (Pmax/Pcr) * | Stress ratio
|
|
CTR-B1-B2 | Control beams are tested monotonically
|
| FTG-B1 | 0-550 | 0. 853 | 0. 455 |
| 550-1 100 | 1. 008 | 0. 539 |
| 0-500 | 0. 775 | 0. 4 |
| FTG-B2 | 500-980 | 0. 93 | 0. 5 |
| 980-1 470 | 1. 085 | 0. 572 |
| 1 470-1 980 | 1. 163 | 0. 734 |
| 1 980-2 000 | 1. 24 | 0. 75 |
| 0-500 | 0. 775 | 0. 6 |
| FTG-B3 | 500-1 000 | 0. 853 | 0. 637 |
| 1 000-1 500 | 0. 93 | 0. 667 |
| 1 500-2 000 | 1. 008 | 0. 693 |
| 0-500 | 0. 775 | 0. 6 |
| FTG-B4 | 500-1 000 | 0. 853 | 0. 637 |
| 1 000-1 500 | 0. 93 | 0. 5 |
| 1 500-2 000 | 1. 008 | 0. 539 |
| 0-500 | 0. 775 | 0. 6 |
| FTG-B5 | 500-1, 000 | 0. 93 | 0. 667 |
| 1 000-1 500 | 1. 008 | 0. 693 |
| 1 500-2 000 | 1. 085 | 0. 715 |
| 0-100 | 1. 434 | 0. 595 |
| 100-500 | 0. 814 | 0. 524 |
| FTG-B6 | 500-1 000 | 0. 93 | 0. 5 |
| 1 000-1 500 | 1. 047 | 0. 482 |
| 1 500-2 000 | 1. 163 | 0. 467 |
| * The calculated cracking load (Pcr) was 129 kN. |
|
Table 3 Loading protocols
|
表 4

Table 4 Static loading 2 protocol
| No. | Tonnage (kN) | Time (min) |
| 1 | 20 | 42371 |
| 2 | 40 | 42371 |
| 3 | 60 | 42371 |
| 4 | 80 | 42371 |
| 5 | 100 | 42371 |
| 6 | 105 | 42434 |
| 7 | 110 | 42434 |
| 8 | 115 | 42434 |
| 9 | 120 | 42434 |
| 10 | 125 | 42434 |
| 11 | 130 | 42434 |
| 12 | 135 | 42434 |
| 13 | 140 | 42371 |
| 14 | 160 | 42371 |
| 15 | 180 | 42371 |
| 16 | 200 | 42371 |
| 17 | 220 | 42371 |
| 18 | 240 | 42371 |
| 19 | 260 | 42371 |
| 20 | 280 | 42371 |
| 21 | 300 | 42371 |
| 22 | 320 | 42371 |
| 23 | 340 | 42371 |
| … | … | … |
|
Table 4 Static loading 2 protocol
|
2. 3 Test Results
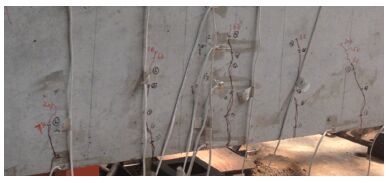
There arecracks in the beam under the cyclic loading, and the more than 98% cracks can be close after uninstalling by the effect of the prestressing force. After 2 million cycles loading, the crack propagation of test beams FTG-B6 are shown in Fig. 4.
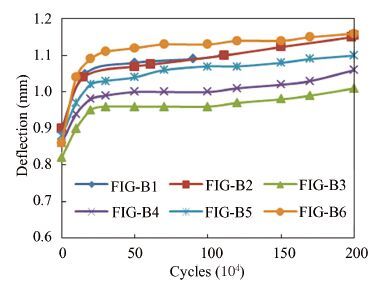
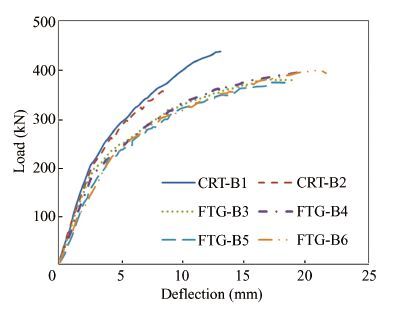
The fatigue deflection of test beams subjected to cyclic loading are shown in Fig. 5 and the monotonic test results are shown in Fig. 6. All the deflection data are from on the middle of the span. In Fig. 5, the development of fatigue deflection in the PC test beams can be divided into two stages. Stage I comprises the first 200 000 loading cycles and Stage Ⅱ contains the remaining cycles. The rate of deflection development changes with the changing of the loading level and stress ratio. As seen in Fig. 5, the stiffness and ultimate bearing capacity is reduced after fatigue loading.
3 Stiffness Degradation Simulation
3. 1 Fatigue Section Stiffness
The deflection of a beam under bending can be calculated by
|
$$w = \int {{{M\bar M} \over B}} dx$$
|
(1) |
where w is the deflection;M is the bending moment;${\bar M}$ is the bending moment under unit force, and B is the section stiffness.
For prestressed concrete beams, B includes three components: the stiffness of the concrete (EcIc) , the stiffness of the reinforcement (ErIr) , and the stiffness of prestressed strands (EpIp) . Ec, Er, and Ep are the modulus of elasticity of the concrete, reinforcement, and prestressed strand, respectively. Ic, Ir, iand Ip are the moments of inertia of the concrete, reinforcement, and prestressed strand, respectively. Using the cross section as shown in Fig. 1, the section stiffness of the test beams is given by
|
$$B = {E_c}{I_c} + \sum\limits_i {{E_r}{I_{r, i}}} + {E_p}{I_p}$$
|
(2) |
|
$${I_c} = {b \over 3}\left[ {x_0^3 + {{(h - {x_0}) }^3}} \right]$$
|
(3) |
|
$${I_{r, i}} = (1 - {\alpha _r}) {A_{r, i}}{({h_{r, i}} - {x_0}) ^2}$$
|
(4) |
|
$${I_p} = (1 - {\alpha _p}) {A_p}{({h_p} - {x_0}) ^2}$$
|
(5) |
where x0 is the height from the bottom of the cross section to the neutral axis;b is the width of the cross section; h is the height of the cross section; Ar, iis the area of the ith reinforcement rebar; hr, iis the height from the bottom of the cross section to the ith rebar; Ap is the area of the prestressed strands; hpis the height from the bottom of the cross section to the prestressed strands, and αr and αp are modulus ratios, which are calculated as follows:
|
$${\alpha _r} = {E_c}/{E_r}$$
|
(6) |
|
$${\alpha _p} = {E_c}/{E_p}$$
|
(7) |
From Eq. (2) to Eq. (5) , the modulus of elasticity is an appropriate measure for the damage in the concrete, while the effective area is a more suitable measure for the damage in the steel.
3. 2 Damage of Concrete
Concrete damage evolution undergoes a three-stage development. The damage value is therefore calculated by the following equations:
|
$${D_c}\left\{ {\matrix{
{1 - {{\left[ {1 - {n \over N}} \right]}^{\alpha 1}}} \hfill & {\left( {0 \le {n \over N} < 0. 1} \right) } \hfill \cr
{1 - k\left[ {1 - {n \over N}} \right]{\alpha _2}^{}} \hfill & {\left( {0. 1 \le {n \over N} < 0. 9} \right) } \hfill \cr
{{\rm{Linear interpolation}}} \hfill & {\left( {0. 9 \le {n \over N} < 1} \right) } \hfill \cr
} } \right. $$
|
(8) |
|
$${\alpha _i} = {\alpha _i}(1 - {R^2}) {S^{bi}}$$
|
(9) |
|
$$k = {0. 9^{\alpha 1 - \alpha 2}}$$
|
(10) |
where n is the loading cycles; N is the fatigue live; S is the stress level; R is the stress ratio; ai and bi are material parameters, and k is the damage continuity parameter, which ensures the continuity of the damage value equation. The form of αi is based on Ref. [24].
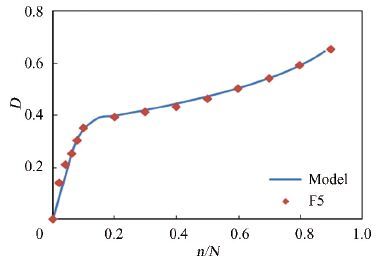
Parameters fits are based on the fatigue test results of concrete[25-26] and they are listed for the test information in Table 5. The parameter fitting results are summarized in Table 6. Fig. 7 shows the results of the damage value equation for the first two stages compared with those of test block F5.
表 5

Table 5 Test information for parameter fitting
|
Source |
Block |
Smax |
R |
N |
α1 |
α2 |
|
Ou and Lin 1999 |
F1 |
0. 756 |
0. 063 5 |
3. 870 4 |
4. 306 |
0. 242 |
|
F2 |
0. 844 |
0. 065 2 |
0. 310 1 |
4. 685 |
0. 378 |
|
F3 |
0. 818 |
0. 067 2 |
0. 105 1 |
4. 587 |
0. 348 | |
F4 |
0. 803 |
0. 068 5 |
0. 590 0 |
4. 516 |
0. 331 | |
F5 |
0. 796 |
0. 065 3 |
0. 750 1 |
- |
- | |
F6 |
0. 774 |
0. 067 2 |
1. 785 4 |
4. 394 |
0. 274 | |
Wang et al. 1991 |
Fu-3 |
0. 550 |
0. 181 8 |
200 |
3. 930 |
0. 103 | |
Fu-5 |
0. 550 |
0. 181 8 |
200 |
3. 834 |
0. 122 | |
Fu-9 |
0. 563 |
0. 177 6 |
90 |
3. 936 |
0. 136 | |
Ft-1 |
0. 792 |
0. 126 3 |
35 |
4. 460 |
0. 284 | |
Ft-6 |
0. 750 |
0. 133 3 |
15 |
4. 293 |
0. 245 | |
Ft-10 |
0. 729 |
0. 137 2 |
2. 3 |
4. 286 |
0. 236 |
|
Table 5 Test information for parameter fitting
|
表 6

Table 6 Parameters fitting results
|
Parameters |
a1 |
a2 |
b1 |
b2 |
|
Value |
4. 866 |
0. 535 5 |
0. 328 4 |
2. 85 |
|
Table 6 Parameters fitting results
|
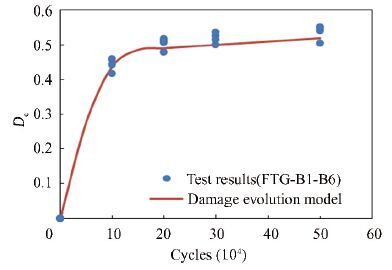
In Eq. (8) , the first stage of damage evolution is suggested to be within 0-0. 1N cycles. However, the fatigue test results indicate that the first stage is within 0-150 000 cycles for the test beams. Therefore, Eq. (8) is adjusted into Eq. (11) to match the test results. The adjusted damage evolution results are shown in Fig. 8.
|
$$D{\rm{ = }}\left\{ {\matrix{
{1 - {{\left( {1 - 0. 1 \cdot {n \over {15 \times {{10}^4}}}} \right) }^{4. 866(1 - {R^2}) {S^{0. 3284}}}}} \hfill & {(0 < n \le 15 \times {{10}^4}) } \hfill \cr
{1 - k{{\left[ {1 - \left( {0. 1 + {{n - 15 \times {{10}^4}} \over N}} \right) } \right]}^{0. 5355(1 - {R^2}) {S^{2. 85}}}}} \hfill & {(n > 15 \times {{10}^4}, {n \over N} \le 0. 9) } \hfill \cr
{{\rm{Linear interpolation}}} \hfill & {(0. 9 \le {n \over N} \le 1) } \hfill \cr
} } \right. $$
|
(11) |
Nonlinear cumulative damage theory was used for the concrete. Based on the Corten-Dolan theory[27], cumulative damage is calculated by
|
$${D_c} = \sum {{D_i}} \cdot {\left( {{{{S_i}} \over {{S_{\rm{m}}}}}} \right) ^d}$$
|
(12) |
where Di is the damage value of the ith loading cycle; Si is the stress level of the ith loading cycle; Sm is the maximum stress level in the loading history, and d is a cumulative parameter, which affects the accuracy of the fatigue analysis results;d is influenced by the stress level, stress ratio, and fatigue loading history, among other factors.
As the damage value is calculated, the damage modulus of elasticity, Ec, f, can be calculated by the following equation.
|
$${E_{{\rm{c, f}}}} = (1 - K{D_c}) {E_{\rm{c}}}$$
|
(13) |
where K is a linearly dependent coefficient, which is suggested to be a value of 0. 56 in this paper.
3. 3 Damage of Steel Strands The failure of reinforcements or prestressed strands usually occurs at the weakest position, where the initial crack occurs. Fracture analysis indicates that the evolution of steel damage is a process of crack development. Using the reinforcement rebar as an example, the steel strands damage can be expressed as
|
$${D_{\rm{r}}} = {{{A_{{\rm{r, cr}}}}} \over {{A_{\rm{r}}} - {A_{{\rm{r, u}}}}}} = {{{A_{\rm{r}}} - {A_{{\rm{r, f}}}}} \over {{A_{\rm{r}}} - {A_{{\rm{r, u}}}}}}$$
|
(14) |
where Ar is the area with no fatigue damage; Ar, f is the effective area with fatigue damage; Ar, u is the effective area when failure occurs, and Ar, cr is the area of the crack. When the reinforcement rebar fails after N cycles in a stress range of σr, min-σr, max, the area of the crack is given by
|
$${A_{{\rm{r, cr}}}} = {A_{\rm{r}}}\left( {1 - {{{\sigma _{{\rm{r, max}}}}} \over {{f_{\rm{y}}}}}} \right) $$
|
(15) |
where fy is the yield strength. After n cycles of fatigue loading prior to failure, the effective area is given by
|
$${A_{{\rm{r, f}}}} = {A_{\rm{r}}}\left[ {1 - {n \over N}\left( {1 - {{{\sigma _{{\rm{r, max}}}}} \over {{f_{\rm{y}}}}}} \right) } \right]$$
|
(16) |
Using the Palmgren-Miner linear cumulative damage theory[28], Eq. (16) can be transformed into
|
$${A_{{\rm{r, f}}}} = {A_{\rm{r}}}\mathop \prod \limits_i \left[ {1 - {{{n_i}} \over {{N_i}}}\left( {1 - {{{\sigma _{{\rm{r, max, }}i}}} \over {{f_{\rm{y}}}}}} \right) } \right]$$
|
(17) |
where σr, max, i is the maximum stress level under the ith loading cycle. From Eq. (17) , the cumulative damage of steel under multi-stress-level cycle loading can be calculated. The cumulative damage calculation for the prestressed strands is the same as for the reinforcement rebar.
3. 4 Simulation Calculation Results The effective stiffness is modified using the coefficient λ, which is the ratio of the monotonic test results to the theoretical calculation results. As the stress changes along the depth of the section, the fatigue damage of concrete changes as well. Therefore, the strip method is used to calculate the fatigue section stiffness. The S-N curves used in stiffness degradation simulation are given by the following equations.
Concrete, compression [29]:
|
$$\lg N = 17\left( {{{1 - {f_{{\rm{c}}, \max }}/f} \over {1 - {f_{{\rm{c}}, \min }}/{f_{\rm{c}}}}}} \right) + 0. 23$$
|
(18) |
Concrete, tension-compression [3-4]:
|
$$\lg N = 9. 36 - 7. 93{{{f_{t, \max }}} \over {{f_{\rm{c}}}}} - 2. 59{{{f_{{\rm{c}}, \min }}} \over {{f_{\rm{c}}}}}$$
|
(19) |
Concrete, tension [3-4]:
|
$$\lg N = 14. 81 - 14. 52{{{f_{t, \max }}} \over {{f_t}}} + 2. 79{{{f_{t, \min }}} \over {{f_t}}}$$
|
(20) |
Steel reinforcements in China [30]:
|
$$\lg N = \left\{ {\matrix{
{15. 1348 - 4. 3827\lg \Delta \sigma (N < {{10}^7}) } \cr
{18. 8471 - 6. 3827\lg \Delta \sigma (N \ge {{10}^7}) } \cr
} } \right. $$
|
(21) |
Prestressed strands in China [31]:
|
$$\lg N = 13. 84 - 3. 5\lg \Delta \sigma $$
|
(22) |
In Eqs. (18) -(20) , fc, max and fc, min are the maximum and minimum compression stresses, respectively; fc is the compression strength; ft, max is the maximum tension stress; fc, min is the minimum tension stress, and ft is the tension strength. In Eqs. (21) and (22) , Δσ is the stress range.
Therefore, in the simulation process, the only indeterminate parameter isd in Eq. (12) , which primarily determines the cumulative damage of concrete. In this study, d is estimated via a genetic algorithm using the test results of the actual loading protocol. The objective function is given by
|
$${W_{{\rm{obj}}}} = {\left( {{w_{{\rm{sim}}}} - {w_t}} \right) ^2}$$
|
(23) |
where Wobj is the objective value; wsim is the simulated deflection, and wt is the tested deflection.
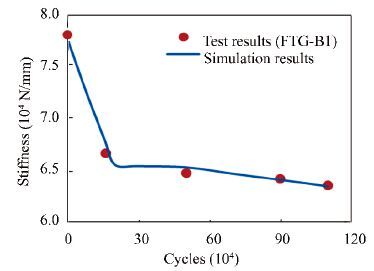
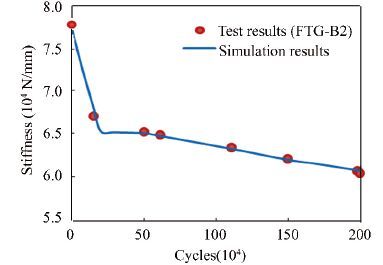
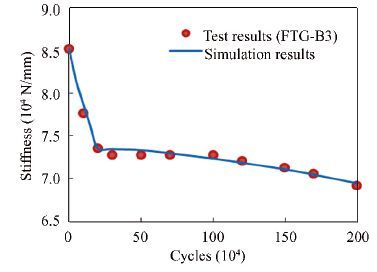
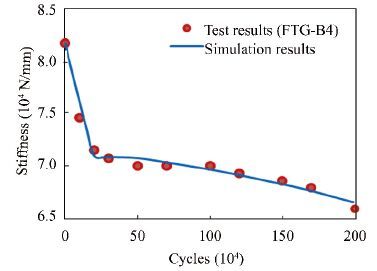
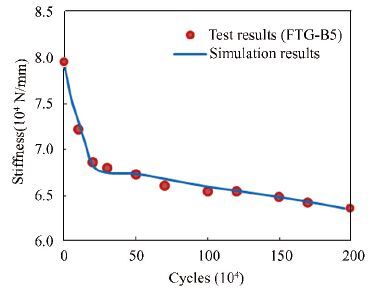
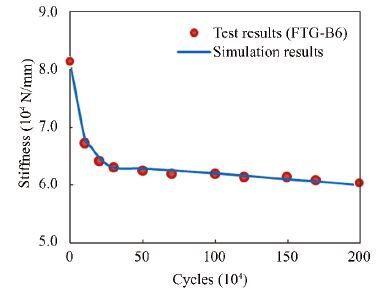
A simulation script was generated and the simulation results of the fatigue test beams are shown in Figs. 9-14. Here, "stiffness" represents the load that leads to a 1 mm deflection at the span center. As seen in Figs. 9-14, the simulation results demonstrate the stiffness degradation of PC test beams well. After introducing the three-stage damage evolution model of concrete, the simulated degradation process is good agreement with the real process in the test beams. The boundary between the first and second stages in the simulated degradation process is mainly dependent on the damage evolution model of concrete.
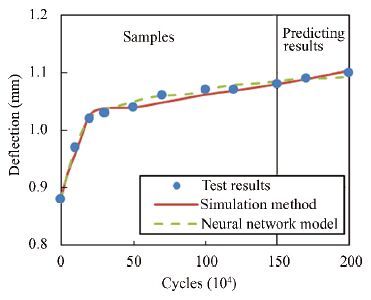
In the simulation, the parameters are estimated using the test results. Once the parameters are determined, the degradation process can be obtained. The potential deflection of the beam is therefore predicted. The test results of test beam FTG-B5 were chosen to validate the prediction method. The test results before 1 500 000 cycles were used as samples for parameter fitting and the test results after 1 500 000 cycles were used to verify the prediction. A BP neural network model given by Eq. (24) is introduced for contrastive analysis:
|
$$w = f(n, {S_1}, {S_2}, \cdot \cdot \cdot {S_i}, {R_1}, {R_2}, \cdot \cdot \cdot {R_i}) $$
|
(24) |
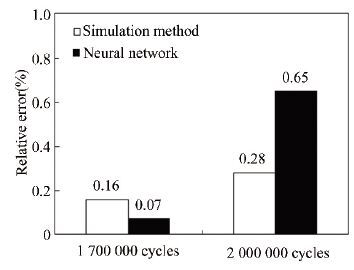
The predicted results are shown in Fig. 15 and their relative errors are shown in Fig. 16. The predicted deflections agree well with the test results. The prediction method based on the simulation method has a greater precision than the neural network model.
4 Conclusions This study was investigated the stiffness degradation of prestressed concrete beams under cyclic loading. Fatigue loading tests were carried out on six PC beams. The stiffness degradation of PC beams was simulated and a method for predicting fatigue deflection was proposed.
It was simulated based on section stiffness for the stiffness degradation of PC beams. The damage modulus of elasticity for concrete and the effective area for steel strands were used as measures of the degradation of section stiffness. A three-stage damage evolution model was used for concrete in the stiffness degradation analysis. The simulation results are in good agreement with the test results.
A method for predicting the fatigue deflection was proposed based on the stiffness degradation simulation. The prediction relies on the deflection data in the loading history and the predicted results match the test results well. The simulation prediction method has a higher precision than the neural network model. Therefore, in the monitoring of the deflection in the full life cycle of prestressed concrete bridges, the proposed method can be provided constructive predicted results.

 0)
0)
 0)
0)
 0)
0)
 0)
0)
 0)
0)
 0)
0)
 0)
0)
 0)
0)
 0)
0)
 0)
0)
 0)
0)
 0)
0)
 0)
0)
 0)
0)
 0)
0)
 0)
0)
 0)
0)
 0)
0)
 0)
0)
 0)
0)
 0)
0)
 0)
0)
 0)
0)
 0)
0)
 0)
0)
 0)
0)
 0)
0)
 0)
0)
 0)
0)
 0)
0)
 0)
0)
 2016, Vol. 23


