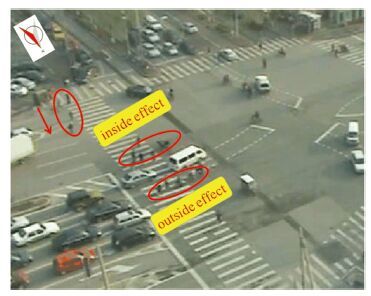
Signalized intersections in urban areas are particularly problematic not only because of high travel demand but also due to a high amount of pedestrians disregarding traffic signals. Impatience, unawareness of the consequence of the action, lack of understanding traffic signal operation and/or insufficient signal timing for pedestrians crossing may be the causes to this common illegal street crossing behavior in China. Based on our observations made at two typical intersections in Beijing, about 63% of pedestrians at signalized intersections walk across the street while right-of-way is assigned by traffic signal to left-turning vehicles exclusively, and about 93% of left-turn vehicles are forced to slow in order to avoid pedestrians, which undoubtedly affects capacity of the lane group and consequently aggravates traffic congestion problems. Fig. 1 shows a typical situation at a protected left-turn signal phase where vehicles are intertwined with pedestrians’ crossing at the intersection. To avoid conflict with pedestrians, left-turn vehicles have to slow down or even completely stop to prevent an imminent crash. The slower than normal speed of left-turning vehicles can result in lower capacity. It is a serious problem for already heavily congested intersections in China.
|
Figure 1 Pedestrian movement during protected left-turn phase |
While poor pedestrian street crossing behaviors are largely ignored and uncontrolled in China, this problem has been recognized but few studies have been conducted on the impact of uncontrolled pedestrians to the roadway’s capacity at signal intersections.
“Highway Capacity Manual”(2010) [1] and “Code for design of urban road engineering”(2012) provided a calculation method for traffic capacity without interference by pedestrians. At the same time, the stop line method and the conflict point method are also common for capacity calculation. In “HCM”, the capacity is calculated by reducing the ideal saturation flow rate, and the reduction factor (RF) is taken into account to reflect the effect on the capacity by pedestrians. The reaction time of drivers is considered in the stop line method. However, the acceleration time for vehicles is not considered. Conflict point method is generally more suitable for the lower two-phase traffic signal intersection, and it is difficult to apply at intersections in metropolitans [2]. There are other researches on the effect by pedestrians to traffic using the conflict points method [3-6]. The conflict point method is essentially a reduction to the time headway of vehicle flow.
There are limited researches on the reduced capacity by pedestrians. The reduction factor (RF) has been commonly used to reflect the effect. The “Fundamentals of Traffic Engineering” gave the RF a constant value 0.9[7]. Based on an investigation to two similar intersections and the method of comparative analysis, Wei et al. calculated the value of reduction factors by pedestrians for the initial reaction time of drivers, starting delays or lost time of the first vehicle and the minimum headway [8-9]. The saturated flow rate is affected by pedestrians seriously. In 2009, Chen established a formulation for traffic capacity by reducing the saturated flow rate and the influential factor is the pedestrian volume [2]. Highway Capacity Manual 2010 edition calculated the occupied time of pedestrians to the conflict points based on pedestrian flow rate, and provided a formula for RF estimation.
The following conclusions can been got in the present study: the main influential factors are pedestrian volume (number of pedestrians) and the distance between pedestrians and vehicles[2, 10-12]; the capacity affected by pedestrians is calculated through reducing the saturated flow rate. However, the vehicles’ acceleration lost time with and without influence by pedestrians is not considered in present studies. Lack of accelerate speed-time profile for the vehicular acceleration caused this problem. The acceleration process only occurs for short time periods throughout the natural driving process at intersection. This makes it difficult to get accelerate speed on the acceleration process. Database used in this study were usually gotten by in-vehicle Global Positioning System (GPS) technology, and the measurement error of GPS data was about ±5 m[12]. The speed and acceleration data investigated by an instrumented vehicle can be affected by the type of the instrumented vehicle or the personal characteristics of the driver. The laser speed gun was often used to investigate point speed, and it was not suitable to get the continuous speed. Moreover, a quantitative classification of the capacity influenced by pedestrian will be more practical for application.
According to the investigation at signal intersection, the interruptions to the traffic flow by pedestrians are few. In most cases, the traffic speed and the capacity are reduced by intertwined pedestrians (Fig. 1). Thus, the objective of this study is to investigate how the capacity is affected by illegal pedestrian crossing. Based on the start-up time, acceleration time and saturation flow rate of the vehicles with and without pedestrian traffic, a model for capacity considering the influence by pedestrian traffic at signal intersections is constructed. It has been hoped that such study can provide the evidence for decision makers on how to best manage congested signalized intersections in metropolitan areas.
In order to exclude interference between vehicles, the exclusive left-turn lane vehicles are selected to study, which is effected most badly by pedestrians.
2 Data CollectionThe imagery data has been collected by a camera placed at a corner of the intersection in order to get an accurate bird’s-eye-view. This typical urban four-way intersection operates with a four-phase signal plan with a protected left-turn phase for heavily traveled streets. The information for the investigated intersections is shown in Table 1.
| Table 1 Information for the investigated intersections |
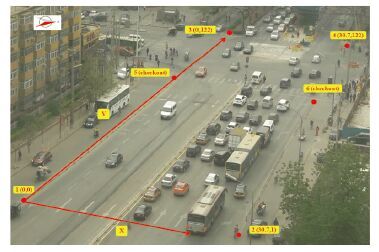
The data collection lasted for five consecutive workdays. The effect of pedestrian movement was investigated on the right and left sides of vehicles separately. The right side was defined as outside and left side as inside. The relative positions of pedestrians and vehicles at the intersection were calculated by the SIMI software every half second. The vehicular speed was also calculated accurately by SIMI software which played the video one by one frame after setting up the coordinate system at the intersection (Fig. 2).
|
Figure 2 Layout of the investigated intersection |
With the collected imagery data and the spatial data from processing software, the following variables were obtained: time-headway and speed of every left-turn vehicle, positions of each moving vehicle, the distance between a vehicle and closest pedestrians on both sides and the pedestrian volume. The data were collected under good weather with only small vehicles (excluding the data from the protected phase when buses, large trucks and U-turn vehicles are present) in order to derive the saturation flow rate under the prevailing condition. The saturation rate was estimated by the method introduced by the Highway Capacity Manual (HCM): the vehicle data collection starts at the fifth car, i.e.:
| ${h_t} = {{{t_n} - {t_4}} \over {n - 4}}$ |
where ht is the time-headway of the saturation flow; tn is the time of the last car in the queue when it passes through the stop line; t4 is the time of the fourth car in the queue when it passes through the stop line; n is the number of cars.
367 eligible saturation flows are collected from the 720 left-turn signal cycles at the intersection.
3 AnalysisFor the formulation of capacity, the effect by pedestrians may increase start-up time, acceleration time of vehicles and decrease the saturation flow rate. One of the obvious and significant effects by pedestrians on the traffic is the saturation flow rate. Thus, the effects of the pedestrians are firstly evaluated from this point. Through the method of significant analysis, the researches for the effect on the capacity by pedestrians with different conditions (number of pedestrians and position) are analyzed and quantified.
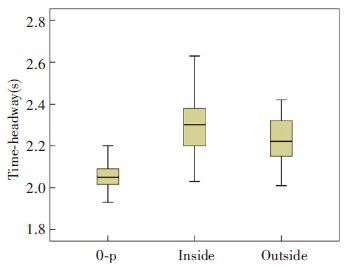
3.1 Effect to Saturation Flow Rate 3.1.1 Inside or outsideFig. 3 lists the time-headway of left-turn saturation flow with and without pedestrians’ interference only by one side.
|
Figure 3 Estimated time-headway with and without pedestrian interference (single side) |
According to the statistical analysis, pedestrians on the inside of left-turn flow affect the left-turn flow more seriously than those on the outside, which is illustrated in Fig. 3.
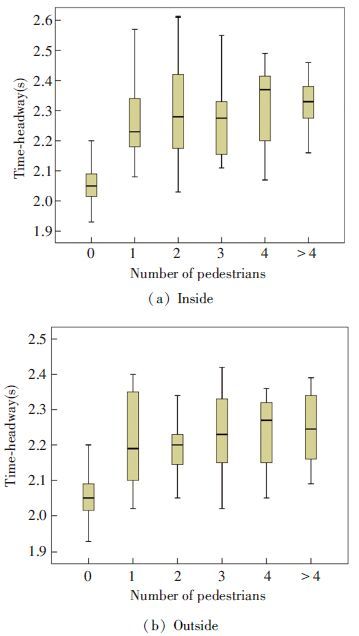
3.1.2 Number of pedestriansThe width of the cross walk is 5 m. To analyze the effect by different numbers of pedestrians, six cases are defined from 0, 1, 2, 3, 4 and more than 4 pedestrians(as shown in Fig. 4).
|
Figure 4 Time-headway of saturate flow by pedestrian frequency |
It is clear that the pedestrians affect the time-headway of the left-turn at saturation flow seriously, but the level of interference does not increase significantly by different number of pedestrians, which is further verified by the Significant Analysis. Therefore, the number of pedestrians is nor an influential factor.
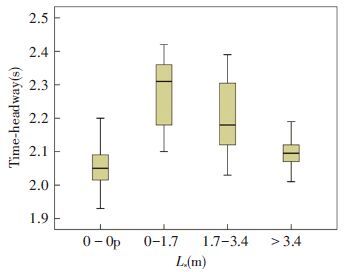
3.1.3 DistanceThe distance between turning cars and pedestrians, denoted by Ls, is also investigated. The Lin is used to described the distance between the left-turn flow and the pedestrians on the inside (left side) of the flow, while Lout denotes the distance between the left-turn flow and the pedestrians on the outside (right side).
The time-headway of the vehicles needs to be divided into groups based on the distance between pedestrians and vehicles. With the minimum of the Ls as the starting, the first interval is 0.2m (minimum of foot length), and the interval of the group increases by 0.1 m. The following intervals to be analyzed are 0.3, 0.4, 0.5… The different groups will be compared by significant analysis with different classifications.
The results show that: the effect by the pedestrians can be ignored when the distance is larger than 3.4m. When the interval of adjacent groups is less than 1.7 m, the difference of time-headway of groups is not significant. However, when the distance (Ls) is larger than 1.7 m, the difference of time-headway between adjacent groups is significant. Thus, the sensitivity of Ls is “1.7 m”, which is shown in Fig. 5.
|
Figure 5 Time-headway of saturation flow affected by inside pedestrians with different Ls(ΔL=1.7m) |
3.1.4 Classification
The following conclusions can be found so far: the time-headway of saturation flow is mainly affected by the position of pedestrians (inside or outside of left-turn vehicle’s trajectory) and the distance between the vehicle and pedestrians. It can be also concluded that the sensitivity of the distance interval is 1.7m and the number of pedestrians is not an influential factor. Thus, the pedestrian influence cases studied are preliminary defined by six cases in Table 2.
| Table 2 Study cases |
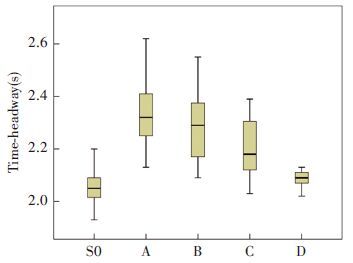
According to the study cases, there is no difference between the time-headway of S5 and the S0. The other four cases show the impact of pedestrian existence. The time-headway of saturation flow is the largest with S1, and the lowest with S4. As the statistical tests show, the difference of time-headway is significant between S4 and the other three cases (S1, S2, and S3) . The time-headway with S2 is significantly different from S1, but the time-headway with S2 and S3 are not significantly different from the significance test. When S2 and S3 are merged into one group, there is a significant difference between the different groups (as shown in Table 3).
| Table 3 Significant analysis for time-headway for the final classification |
Thus, the time-headway of saturation flow, which is affected by the pedestrians on a single side, can be classified into four grades: A, B, C, and D (as shown in Table 4). Fig. 6 displays the time-headway of saturation flow in different final classification.
| Table 4 Final classification of the saturation flow by single side |
|
Figure 6 Time-headway of saturation flow at different final level |
The time-headway of saturation flow affected by the pedestrians on both sides is compared with the time-headway affected on a single side. Table 5 defines the analysis cases with pedestrians on both sides of the flow simultaneously.
| Table 5 Case definition for pedestrians on both sides |
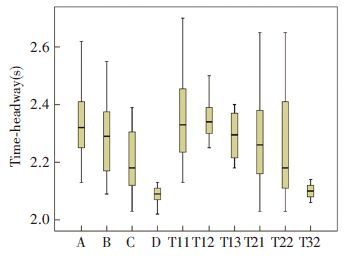
The time-headway affected by the pedestrians on both sides is compared with the affected by pedestrians on a single side in Fig. 7. Using the method of significant analysis, the following results are obtained: there is no significant difference between group A and groups T11, T12, T13, and the difference between group B and groups T21 and T22 is not significant. The time-headway difference between group C and group T32 is also not significant, which means that the effect on the left-turn saturation flow by both sides of pedestrians is the same as that by pedestrians on one serious side.
|
Figure 7 Time-headway affected by both sides vs. defined cases |
Therefore, the pedestrian impact on the left-turn flow is finally classified into four levels as shown in Table 6. Each level can be distinguished quantitatively using the mean difference between groups which is calculated in the statistical significance tests.
| Table 6 Left-turn saturation flow with different level of effect |
In Table 6, it shows that the saturation flow rate is decreased by 16.8% when the left-turn flow is impacted seriously by pedestrians.
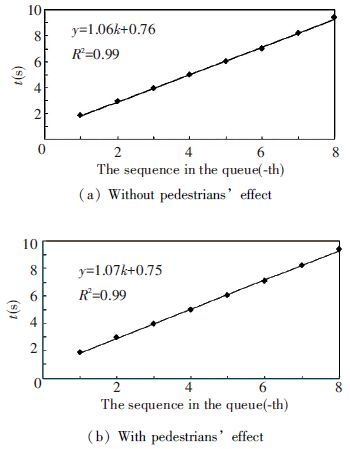
3.2 Impact to the Start-up TimeThe start-up lost time is the reaction time of drivers and vehicles. When the right-of-way is assigned by traffic signal to vehicles at intersection, the queuing vehicles begin to start one by one. A linear model of the vehicular start time can be developed [13-14]. According to the traffic investigation, the start time of the vehicle increases linearly with the sequence of the vehicle in the queue:
| $T = {b_1} \times k + {b_2}$ | (1) |
where T is the start-up time after green phase (s); k is the queue sequence of the vehicle (-th); b1, b2 are the constant parameters.
The models of start-up time with and without pedestrians are shown in Fig. 8.
|
Figure 8 Law of start-up with or without pedestrian effect |
There is no difference between the law of start-up time with and without pedestrians. Therefore, start-up time of vehicles is only affected by the position of the queue, regardless of other interference.
3.3 Impact to the Acceleration TimeThe acceleration time ofthe vehicle is the time comes to the saturation flow from vehicular start-up (ta). Historical researches used to build the model of speed-time profile based on the acceleration-time profile. This has focused on four types of acceleration characteristic: (a) constant acceleration model (single regime model), (b) dual-regime acceleration model, (c) linear decreasing acceleration model and (d) polynomial acceleration model [15-18]. Constant acceleration model and dual-regime acceleration model assume one/two constant rate of acceleration throughout the acceleration maneuver. In those models, the speed of vehicles tends to change abruptly. The linearly-decreasing acceleration model assumes that the maximum acceleration rate occurs at the beginning of the acceleration process while vehicle speed is zero, and decreases to zero at the end of the acceleration process while vehicle speed reaches free flow speed, which is not actual. The results show that the polynomial model provided good fit to the field data.
Actually, the acceleration becomes faster after first zero, and then slower again at the saturation. The authors found that these models yielded the S-shaped speed-time trace [19], but authors didn’t present the model of speed profile.
3.3.1 Speed-time profileFig. 9 shows the scatter diagram of the speed-time profile according to the actual investigation. The red curve is the average speed profile, which is used to establish the speed-time model below.
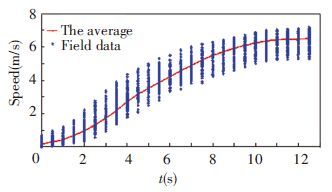
|
Figure 9 Scatter plot of speed profile |
It can be seen from Fig. 9: speed profile indicates an “S” shape; speed is zero at the start and tends to a stable value at the end. Based on the two characteristics, an improved “S” curve formula (S1 + S2) is used to shape the speed-time profile (V(t)). The improved “S” curve formula combines the “S” curve formula which the end is gentle (S1) and the “S” curve through the origin point (S2).
Final equation model is as follows
| $\eqalign{ & V(t) = {{{a_1}} \over {1 + {a_2} \times {e^{({a_3} \times t)}}}} + \cr & {{{a_4}} \over {1 + {a_5} \times {e^{({a_6} \times t)}}}} \cr} $ | (2) |
where V(t) is the speed of the vehicle after start-up; t is the time; e is the natural logarithms; a1, a2, a3, a4, a5, a6 are the constant parameters.
According to the Limit Theorem of Function, the sum of the constant parameters a1 and a4 is the final stable speed, which is the saturation speed of the vehicular flow. The speed-time profiles of the queuing vehicles with the influence of different level are modeled by the Fitting Tool Software, which are shown in Table 7.
| Table 7 Parameters of speed profile at different level of influence |
3.3.2 The acceleration time (ta)
The speed of saturation flow is denoted as Vs, and the acceleration time is ta. The formula to solve ta can be established by seeking inverse function of Eq.(2) :
| ${t_a} = {V_s}^{ - 1}(t)$ | (3) |
The stable speed is taken as the speed of saturation flow in this paper, which is the average speed of the vehicle starts at the fifth car to the last in the queue. According to Eqs.(2) -(3) , and Table 6, ta at different pedestrian impact levels is solved (Table 8).
| Table 8 Vehicle acceleration time at different pedestrian impact level(ta) |
3.4 Capacity Model with the Interference of Pedestrians
We can conclude that: with the interference of pedestrians, the acceleration time of vehicles are increased, and the saturation flow rate is decreased. However, the start-up time is not affected. Therefore, the formula of capacity impacted by pedestrians can be established as follows.
| $C = {{3600} \over {{T_c}}}({n_t} + {{{t_g} - {t_r} - {k_{c1}} \times {t_a}} \over {{k_{c2}} \times {t_i}}})$ | (4) |
where C is the capacity(pcu/h); Tc is the signal cycle time(s); tg is the effective green time(s); tr is the reaction time for the first car(s); ta is the acceleration time(s); nt is the cumulative numbers of vehicles through the stop line during the acceleration time; ti is the time-headway of saturation flow(s); kc1 is the influential factor on the acceleration time(ta) (>1) ; kc2 is the influential factor on the time-headway of saturation flow(>1) .
3.5 Capacity Calculated 3.5.1 Cumulative numbers of vehicles through the stop line during the acceleration time (nt)It is necessary to determine nt before calculating the capacity affected by pedestrians quantitatively. The sequence of the first vehicle to reach the saturated flow speed in the queue is denoted as ns. The line distance before ns in the queuing vehicles is the travel distance when the next vehicle comes to the saturation flow. The following equation can be used to describe this fact.
| $\eqalign{ & {h_d} \times ({n_s} - 1) = \int_0^{{t_a}} {V(t)dt = \int_0^{{t_a}} {({{{a_1}} \over {1 + {a_2} \times {e^{({a_3} \times t)}}}} + } } \cr & {{{a_4}} \over {1 + {a_5} \times {e^{({a_6} \times t)}}}})dt \cr} $ | (5) |
where hd is the space headway of the still queuing vehicles(m); ns is the sequence of first vehicle in the queue(-th); V(t) is the speed-time profile after acceleration,Eq.(2) (m/s); ta is acceleration time(s); t is the time(s).
According to the investigated data, the space headway of the still queuing vehicles (hd) is between 5.8 and 7.6m, and the average is 6.6 m. According to Tables 6 and 7, and taking the hd of 6.6 m into Eq.(5) , the sequence of the first vehicle to reach the saturated flow speed in the queue can be determined. Then, cumulative numbers of vehicles through the stop line during the acceleration time can be also calculated, which is shown in Table 9.
| Table 9 Number of vehicles in acceleration time(nt) |
The time-headway of saturation flow is affected badly by the pedestrians. However, the travel distance for the vehicle to reach the saturated flow speed is almost unchanged. The sequence of first vehicle to reach the saturated flow is fifth, that is: ns=5. Therefore, cumulative numbers of vehicles through the stop line during the acceleration time (nt) is 4.
3.5.2 Capacity calculated quantitativelyThe signal cycle time is 195 s and the effective green time is 50 s for the left-turning phase at the investigated intersection. Based on Eq.(4) and Table 8, traffic capacity affected by pedestrians can be calculated quantitatively, which is shown in Table 10.
| Table 10 Left-turn capacity with different level of effect |
The influential factor kc1 (influence on the acceleration time) is between 1-1.18, and the influential factor kc2 (influence on the acceleration time (ta)) is between 1-1.17. The result shows that the vehicular capacity can be decreased by 14% at the worst case. Therefore, the reduction on the capacity by pedestrians is very significant.
4 ConclusionsTraffic capacity is a fundamental concept in traffic engineering. Aiming at the interference on the capacity by illegal pedestrians, this paper investigates how the queuing vehicles start up and accelerate to the saturation flow with and without pedestrians.
The start-up time, acceleration time and saturation flow rate with and without pedestrian traffic are used as direct measurements to evaluate the effect on the capacity. Then, the model of capacity influenced by pedestrians is established and calculated. Based on the statistical analysis, the pedestrian influence is classified into four levels and the effect is quantitatively estimated at each level. The capacity can be reduced by 14.4% with pedestrian crossings.
The results show that for highly congested urban intersections, it is critical to enforce traffic control for pedestrians. Widely installed video cameras at urban intersections have effectively reduced irregular vehicle operations but illegal pedestrian’s crossing is largely ignored in China. The results of this study demonstrate how important it is to regulate pedestrian flow at signalized intersections.
In order to make a precise and quantitative analysis to the interference on the capacity by pedestrians, this study does not take into account the intersections’ geometry factors. It will be a future study topic by the authors. It needs more investigated field data to do that work, as the imagery data collected by a camera from a bird’s-eye-view are limited by the influence factors of angle of view, place and etc.
| [1] |
Transportation Research Board. Highway capacity manual. Washington D C: National Research Council, 2010.
Transportation Research Board. Highway capacity manual. Washington D C: National Research Council, 2010. (  0) 0)
|
| [2] |
Chen Z Q. Analysis and modeling on characteristics of through vehicles' movement at signalized intersections with mixed traffic. Beijing: Beijing Jiaotong University, 2009. 65-80.
Chen Z Q. Analysis and modeling on characteristics of through vehicles' movement at signalized intersections with mixed traffic. Beijing: Beijing Jiaotong University, 2009. 65-80. (  0) 0)
|
| [3] |
Zhang G Y. Study on the capacity of sign controlled intersection under the influence of non-motor vehicles and pedestrians. Changchun: Jilin University, 2014. 39-49.
Zhang G Y. Study on the capacity of sign controlled intersection under the influence of non-motor vehicles and pedestrians. Changchun: Jilin University, 2014. 39-49. (  0) 0)
|
| [4] |
Chen X M, Shao C F, Nei W. Studies on capacity of signalized intersection influenced by pedestrian traffic.
China Civil Engineering Journal,2007, 40 (3) : 92-97.
( 0) 0)
|
| [5] |
Jing C G, Qu D Y, Liang C Y. Research on effect of vehicle-bicycle conflict on vehicle saturation rate in two phase intersection.
Journal of Highway and Transportation Research and Development,2007, 24 (8) : 124-127.
( 0) 0)
|
| [6] |
Li J X, Mao B H. Capacity analysis on signalized intersections under mixed traffic environment.
Journal of Communication and Transportation Systems Engineering and Information,2001, 1 (2) : 119-123.
( 0) 0)
|
| [7] |
Xu J Q, Chen X W.
Fundamentals of traffic engineer. Beijing: China Communication Press, 2008 : 120 -121.
( 0) 0)
|
| [8] |
Wei H, Ren F T. Non-motorized transport interference in motor vehicle flow at urban intersections.
Journal of Beijing University of Technology,1993, 19 (3) : 72-79.
( 0) 0)
|
| [9] |
Wei H, Lu F, Hou G, et al. Nonmotorized interference and control measures at signalized intersections in China.
Transportation Research Record: Journal of the Transportation Research Board,2003, 1846 : 44-49.
( 0) 0)
|
| [10] |
Juan E C A, Juan C H M. Estimating values for traffic parameters in turning lanes.
Transportation Research Record: Journal of the Transportation Research Board,2003, 1852 : 47-54.
( 0) 0)
|
| [11] |
Li A Z, Wang W, Li W Q. Running characteristics of equivalent people group at urban road intersection.
Journal of Traffic and Transportation Engineering,2010, 10 (3) : 84-89.
( 0) 0)
|
| [12] |
Sun Z Y. Study on pedestrian characteristics in crosswalk at signalized intersections. Beijing: Beijng University of Technology, 2004. 41-49.
Sun Z Y. Study on pedestrian characteristics in crosswalk at signalized intersections. Beijing: Beijng University of Technology, 2004. 41-49. (  0) 0)
|
| [13] |
Ko J, Hunter M, Guensler R. Measuring control delay components using second-by-second GPS speed data.
Journal of Transportation Engineering,2008, 134 : 338-346.
( 0) 0)
|
| [14] |
Zong E K. Research on capacity of left-turn lanes at signalized intersection. Beijing:Beijng University of Technology, 2012. 39-41.
Zong E K. Research on capacity of left-turn lanes at signalized intersection. Beijing:Beijng University of Technology, 2012. 39-41. (  0) 0)
|
| [15] |
Yang Z, Liu P, Tian Z Z, et al. Evaluating the operational impact of left-turn waiting areas at signalized intersections in China.
Journal of the Transportation Research Board,2012, 2286 : 12-20.
( 0) 0)
|
| [16] |
Aycin M F, Benekohal R F. Linear acceleration car-following model development and validation.
Transportation Research Record, Journal of the Transportation Research Board,1998, 1644 : 10-19.
( 0) 0)
|
| [17] |
Bham G H, Benekohal R F. A high fidelity traffic simulation model based on cellular automata and car-following concepts.
Transportation Research Part C,2004, 12 : 1-32.
( 0) 0)
|
| [18] |
Rakha H, Snare M, Dion F. Vehicle dynamics model for estimating maximum light-duty vehicle acceleration levels.
Transportation Research Record: Journal of the Transportation Research Board,2004, 1883 : 40-49.
( 0) 0)
|
| [19] |
Bokare P S, Akhilesh K M.
Acceleration modeling of vehicles in developing countries. Leuven: Belgium: International Conference on Models and Technologies for Intelligent Transportation Systems. 2nd ed, 2011 : 1 -5.
( 0) 0)
|
| [20] |
Liu H O, Chen H Y, Yu C H. Research on technique of measuring the vehicle starting speed.
Journal of Transducer Technology,2001, 20 (11) : 52-54.
( 0) 0)
|
| [21] |
Chen Y X, He Y L, Sun X D. Impact of pedestrian on the speed and acceleration profile model to the protected left-turn traffic.
Journal of Transportation Systems Engineering and Information Technology,2015, 15 (1) : 198-204.
( 0) 0)
|
 2016, Vol. 23


