The Performance Analysis for Distributed Collaborative Beamforming Transmission of Clustered Mobile Sensor Network
1 Introduction With great achievement recently in the construction of low-cost and low-power micro sensors, wireless sensor networks are rapidly introduced to many areas, such as environmental pollution monitoring, object detection. In sensor networks, sensor nodes are responsible for information collection and transmitting them to the access points (AP)[1]. In some applications, such as the collection of underwater marine information, the AP is usually an unmanned aerial vehicle (UAV), which is far beyond the communication range of any sensor node floating on the sea[2]. The other example is the sensor nodes deployed in a big forest to reduce the risk of fire hazard. The UAV is used as the relaying station[3]. However, because of the low power of each sensor node, any one of them cannot communicate with UAV directly. Collaborative beamforming from sensors in a cluster has provided a promising way to extend the transmission range, which is suitable for these applications[4]. Collaborative beamforming technique typically consists of two steps[5]. Each sensor node broadcasts the collected data to the other nodes at the first stage. And next, all the sensor nodes transmit the same information data at the same time to the target UAV, where signals from different nodes arrived with the same phase. As a result, it greatly increases the power of the received signal.
Ochiai et al.[6] proposed the collaborative beamforming to extend the communication range of sensor nodes. And they analyzed the average beam pattern parameters of the collaborative beamforming in great detail. Mudumbai et al.[7] had discussed the feasibility of collaborative beamforming in sensor network, and they proposed the master-slave architecture to implement the collaborative beamforming. The principle of collaborative beamforming is to select an appropriate beamforming coefficient for each node so that the signals can be coherent superposition at the target UAV. Inappropriate beamforming coefficients will reduce the received signal power at the UAV, which further deteriorates the system bit error ratio (BER) performance. And the BER performance analysis of the data transmission by collaborative beamforming is required in both theory and practical communication applications.
Luis et al.[8-10] had researched the beam pattern and BER performance of the collaborative beamforming. Song et al.[11] had obtained the BER expression of collaborative beamforming with phase inaccurate nodes caused by the frequency unsynchronized crystal. All the results are based on the assumption that the sensor nodes are static on the land. However, when the sensor nodes are deployed on the sea surface to relay the collected underwater information or the sensor nodes with mobility are deployed on the land to detect the enemy, the results obtained by these papers are not suitable for mobile situation anymore, because they ignore the nodes’ mobility.
Taking into account the nodes’ mobility, Zarifi et al.[12] had researched the main beam pattern with the nodes’ location estimation errors. Mudumbai et al.[13-14] had researched the total impacts of phase estimation error, location estimation error and synchronization error on the beam pattern. Although the references above consider the nodes’ mobility, all of them are focused on the beamforming pattern parameters. So far, the BER performance analysis with nodes’ mobility has not been discussed. The main contribution of the paper is that we give the BER closed form expression of collaborative beamforming with nodes’ mobility for the first time to the authors’ knowledge. Based on the theoretical BER expression and the numerical results, we have discussed the influences of the factors, including the nodes’ location deviations, the elevation angle of UAV, the total number of nodes, and the total transmit power, on the BER performance of collaborative beamforming.
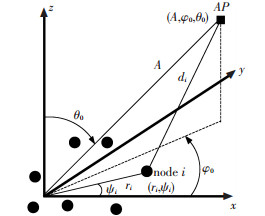
2 Preliminaries A cluster of M sensor nodes are deployed on a flat region as shown in Fig. 1. The coordinates of the i-th sensor node, marked as the small black dots, is (ri, ψi) in polar coordinates, and the coordinates of the target AP, marked as a small black square, is (A, φ0, θ0) in spherical coordinates. di is the Euclidean distance between the i-th sensor node and target AP. All the sensor nodes in the cluster collaboratively transmit the same signal.
It is assumed that all the M sensor nodes collaboratively transmit the BPSK modulation signal s(t) with equal power P/M and compensate the phase response of channel between nodes and target AP by selecting appropriate beamforming coefficient βi. The received baseband signal at target AP can be expressed as
|
$
r\left( t \right) = \sum\limits_{i = 1}^M {\sqrt {\frac{P}{M}} } \cdot \left| {{h_i}\left( t \right)} \right| \cdot s\left( t \right) \cdot {r^{j\left( {\frac{{2\pi }}{\lambda }{d_i} - {\beta _i}} \right)}} + n\left( t \right)
$
|
(1) |
where the distance is
|
$
{d_i} = \sqrt {{A^2} + r_i^2 - 2{r_i}A\sin \left( {{\theta _0}} \right)\cos \left( {{\psi _i} - {\varphi _0}} \right)}
$
|
(2) |
where λ is the carrier wavelength and |hi| represents the slow fading channel gain between node i and destination AP. n(t) denotes the Gaussian noise. Two kinds of channels are considered in this paper. They are Rayleigh fading channel representing the sensor nodes deployed on the complex land environment and AWGN channel representing the nodes deployed on the wild area or the sea surface[15]. P represents the total transmit power. The notation βi denotes the beamforming coefficients, which aims to compensate the channel phase response so that all the signals arrived will be coherently added up at the AP[16]. In the case that the target AP is far away from the sensors (i.e. A>>ri). The distance di can be approximated expressed as
|
$
{d_i} = A - {r_i}\sin {\theta _0}\cos \left( {{\psi _i} - {\varphi _0}} \right)
$
|
(3) |
If the beamforming coefficients are accurate, which means the sensor nodes’ location information is error-free, namely 2πβi=λdi, the received signal can be expressed as
|
$
r\left( t \right) = \sqrt {MP} \cdot \sum\limits_{i = 1}^M {\left| {{h_i}} \right|} s\left( t \right) + n\left( t \right)
$
|
(4) |
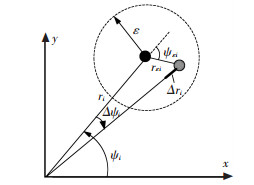
Eq.(4) means the power of received signal is M times larger than that of a single node with equal total transmit power P. However the sensor nodes’ locations cannot be obtained accurately when the sensor nodes are movable, which will in turn make the beamforming coefficients deviate from the ideal accurate values. As a result, the location deviations degrade the SNR of the received signal at the UAV, which decrease the BER performance of the collaborative beamforming transmission. This paper adopts the description of location deviation as shown in Fig. 2[17].
Fig. 2 gives a sketch map about the node’s location deviation. The i-th node’s original location is (ri, ψi), and actual location is (ri+Δri, ψi+Δψi) caused by the mobility of sensor nodes. The actual received complex baseband signal with nodes’ location deviation can be written as
|
$
r\left( t \right) = \sum\limits_{i = 1}^M {\sqrt {\frac{P}{M}} } \cdot \left| {{h_i}} \right| \cdot s\left( t \right) \cdot {e^{j\frac{{2\pi }}{\lambda }\alpha \left( {{r_{{\varepsilon _i}}},{\psi _i},{\psi _{\varepsilon i}}} \right)}} + n\left( t \right)
$
|
(5) |
where
|
$
\alpha \left( {{r_{{\varepsilon _i}}},{\psi _i},{\psi _{\varepsilon i}}} \right) = - {r_{\varepsilon i}}\cos \left( {{\psi _i} + {\psi _{\varepsilon i}} - {\varphi _0}} \right)\sin \left( {{\theta _0}} \right)
$
|
(6) |
where rεi is the distance between the original location and the actual location of node i. From Eqs.(5) and (6), it can be concluded the location deviation will reduce the total received power at target AP, and as a result it will degrade the BER performance. In the next section, we will analyze the BER performance on Rayleigh fading channel and the AWGN channel.
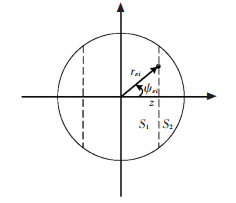
3 The BER Analysis with Nodes’ Location Deviations It is assumed that the nodes’ location deviations caused by mobility are constrained within a circle with an error radius ε relative to the node’s original location, and the actual location of each node is uniformly distributed in this circle as shown in Fig. 2. The cumulative distribution function (CDF) F(r≤rεi) is the probability that the position deviation r of the i-th node is smaller than rεi shown in Fig. 3. The expression of the CDF is shown as
|
$
F\left( {r \le {r_{\varepsilon i}}} \right) = \frac{{r_{\varepsilon i}^2}}{{{\varepsilon ^2}}}
$
|
(7) |
Thus the i-th node’s location deviation obeys the following distribution:
|
$
{f_{{r_{\varepsilon i}}}}\left( {{r_{\varepsilon i}}} \right) = \frac{{2{r_{\varepsilon i}}}}{{{\varepsilon ^2}}},0 \le {r_{\varepsilon i}} < \varepsilon
$
|
(8) |
|
$
{f_{{{\tilde \psi }_{\varepsilon i}}}}\left( {{{\tilde \psi }_{\varepsilon i}}} \right) = \frac{1}{{2\pi }}, - \pi \le {{\tilde \psi }_{\varepsilon i}} < \pi
$
|
(9) |
where ${\tilde \psi _{\varepsilon i}} \buildrel \Delta \over = \;$ψεi+ψi-φ0. Defining the compound random variable $Z \buildrel \Delta \over = {r_{\varepsilon i}}\cos {\tilde \psi _{\varepsilon i}}$, which has two independent random variables. The CDF of variable Z can be expressed as:
|
$
\begin{array}{l}
F\left( {Z < z} \right) = 1 - F\left( {Z \ge z} \right) = 1 - \frac{{{S_1}}}{{{S_1} + {S_2}}} = \\
\;\;\;\;\;\;\;\;\;\;\;\;\;\;\;\;\;\;1 - \frac{{{\varepsilon ^2}{\rm{arccos}}\left( {\frac{z}{\varepsilon }} \right) - z\sqrt {{\varepsilon ^2} - {z^2}} }}{{0.5\pi {\varepsilon ^2}}}
\end{array}
$
|
(10) |
And finally Z has the following probability density function (PDF),
|
$
{f_z}\left( z \right) = \frac{4}{{\pi {\varepsilon ^2}}}\sqrt {{\varepsilon ^2} - {z^2}} , - \varepsilon \le z \le \varepsilon
$
|
(11) |
In order to facilitate the analysis below, we rewrite the received signal in Eq.(5) as
|
$
r\left( t \right) = \sqrt {\frac{P}{N}} s\left( t \right)\left( {X + jY} \right) + n\left( t \right)
$
|
(12) |
Based on the central limit theorem (CLT), namely the sum of a large number of independent identically distributed (i.i.d) random variables approaches the Gaussian distribution[18], the variables X and Y approximately follow Gaussian distribution
|
$
X = \sum\limits_{i = 1}^M {\left| {{h_i}} \right|} \cos \left( {\eta {z_i}} \right) \sim N\left( {{\mu _X},\sigma _X^2} \right)
$
|
(13) |
|
$
Y = \sum\limits_{i = 1}^M {\left| {{h_i}} \right|} \cos \left( {\eta {z_i}} \right)\sim N\left( {{\mu _Y},\sigma _Y^2} \right)
$
|
(14) |
where η=(2π/λ)sin(θ0). This paper considers the channel impulse response follows the Rayleigh fading distribution with variance σR2 and the AWGN channel. With Eqs.(7)-(12), we can obtain the means and variances of X and Y in Rayleigh channel as follows:
|
$
{\mu _{RX}} = \sqrt {2\pi } M{\sigma _R}\frac{{{J_1}\left( {\varepsilon \eta } \right)}}{{\varepsilon \eta }}
$
|
(15) |
|
$
\sigma _{RX}^2 = M\sigma _R^2\left[ {1 + \frac{{{J_1}\left( {2\varepsilon \eta } \right)}}{{\varepsilon \eta }} - 2\pi {{\left( {\frac{{{J_1}\left( {\varepsilon \eta } \right)}}{{\varepsilon \eta }}} \right)}^2}} \right]
$
|
(16) |
|
$
\sigma _{RY}^2 = M\sigma _R^2\left[ {1 - \frac{{{J_1}\left( {2\varepsilon \eta } \right)}}{{\varepsilon \eta }}} \right]
$
|
(18) |
The means and variances of X and Y in AWGN channel is as follows:
|
$
{\mu _{AX}} = 2M\frac{{{J_1}\left( {\varepsilon \eta } \right)}}{{\varepsilon \eta }}
$
|
(19) |
|
$
\sigma _{RX}^2 = M\left[ {\frac{1}{2} + \frac{{{J_1}\left( {2\varepsilon \eta } \right)}}{{2\varepsilon \eta }} - 4{{\left( {\frac{{{J_1}\left( {\varepsilon \eta } \right)}}{{\varepsilon \eta }}} \right)}^2}} \right]
$
|
(20) |
|
$
\sigma _{AY}^2 = M\left[ {\frac{1}{2} - \frac{{{J_1}\left( {2\varepsilon \eta } \right)}}{{2\varepsilon \eta }}} \right]
$
|
(22) |
where J1(·) represents the first order Bessel function of the first kind. Because the variance of X and Y are not equal, it is difficult to compute the distribution of H=X+jY. This paper adopts the approximation assumption that σX2≈σY2≈σε2, which was proposed in Ref.[19]. With the approximation, the equivalent channel coefficient |H| follows Rician fading distribution. The BER performance of Rician channel can be expressed as[20-21]
|
$
{P_e} = {Q_1}\left( {a,b} \right) - \frac{1}{2}\left( {1 + \mu } \right){I_0}\left( {ab} \right)\exp \left[ { - \frac{1}{2}\left( {{a^2} + {b^2}} \right)} \right]
$
|
(23) |
where I0(·) is the zero-order modified Bessel function of the first kind. Q1(a, b) is the Marcum Q-function defined as
|
$
{Q_1}\left( {a,b} \right){\rm{ = }}\int_b^\infty {x\exp \left( { - \frac{1}{2}\left( {{a^2} + {x^2}} \right){I_0}\left( {ax} \right)} \right)} {\rm{d}}x
$
|
(24) |
where the parameters a and b are defined as
|
$
a = \frac{v}{{2{\sigma _{\rm{e}}}}}\left( {1 - \sqrt {\frac{\mu }{{1 + \mu }}} } \right)
$
|
(25) |
|
$
b = \frac{v}{{2{\sigma _{\rm{e}}}}}\left( {1 + \sqrt {\frac{\mu }{{1 + \mu }}} } \right)
$
|
(26) |
The cross-correlation coefficient μ can be expressed as
|
$
\mu = \frac{{2\sigma _e^2P}}{{\sigma _n^2M}}
$
|
(27) |
The non-centrality parameter ν can be expressed as
|
$
v = \sqrt {2E{{\left[ {{{\left| H \right|}^2}} \right]}^2} - E\left[ {{{\left| H \right|}^4}} \right]}
$
|
(28) |
And the approximation variance of X and Y can be expressed as
|
$
\sigma _e^2 = \frac{{E\left[ {{{\left| H \right|}^2}} \right] - \sqrt {2E{{\left[ {{{\left| H \right|}^2}} \right]}^2} - E\left[ {{{\left| H \right|}^4}} \right]} }}{2}
$
|
(29) |
In order to calculate the BER closed-form expression shown in Eq.(23), the means of |H|2and |H|4 need to be calculated. In the Rayleigh channel, the results are shown as Eqs.(30) and (31),
|
$
E\left[ {{{\left| H \right|}^2}} \right] = 2M\sigma _R^2 + 2\pi M\left( {M - 1} \right)\sigma _R^2{\left| {\frac{{{J_1}\left( {\varepsilon \eta } \right)}}{{\varepsilon \eta }}} \right|^2}
$
|
(30) |
|
$
\begin{array}{l}
E\left[ {{{\left| H \right|}^4}} \right] = 8{M^2}\sigma _R^4 + 4M\left( {M - 1} \right)\sigma _R^4{\left| {\frac{{{J_1}\left( {\varepsilon \eta } \right)}}{{\varepsilon \eta }}} \right|^2} + \\
\;\;\;\;\;\;\;\;\;\;\;\;\;\;\;8\pi M\left( {M - 1} \right)\left( {2M - 1} \right)\sigma _R^4{\left| {\frac{{{J_1}\left( {\varepsilon \eta } \right)}}{{\varepsilon \eta }}} \right|^2} + \\
\;\;\;\;\;\;\;\;\;\;\;\;\;\;\;8\pi M\left( {M - 1} \right)\left( {M - 2} \right) \cdot \\
\;\;\;\;\;\;\;\;\;\;\;\;\;\;\;\sigma _R^4\left| {\frac{{{J_1}\left( {2\varepsilon \eta } \right)}}{{\varepsilon \eta }}} \right|{\left| {\frac{{{J_1}\left( {\varepsilon \eta } \right)}}{{\varepsilon \eta }}} \right|^2} + \\
\;\;\;\;\;\;\;\;\;\;\;\;\;\;\;\;\;\;\;4{\pi ^2}M\left( {M - 1} \right)\left( {M - 2} \right)\sigma _R^4{\left| {\frac{{{J_1}\left( {\varepsilon \eta } \right)}}{{\varepsilon \eta }}} \right|^4}
\end{array}
$
|
(31) |
In the AWGN channel, the means of |H|2and |H|4 are shown as follows:
|
$
E\left[ {{{\left| H \right|}^2}} \right] = M + M\left( {M - 1} \right){\left| {\frac{{2{J_1}\left( {\varepsilon \eta } \right)}}{{\varepsilon \eta }}} \right|^2}
$
|
(32) |
|
$
\begin{array}{l}
E\left[ {{{\left| H \right|}^4}} \right] = M\left( {2M - 1} \right) + 4M\left( {^M - 1} \right)2{\left| {\frac{{2{J_1}\left( {\varepsilon \eta } \right)}}{{\varepsilon \eta }}} \right|^2} + \\
\;\;\;\;\;\;\;\;\;\;\;\;\;\;\;\;M\left( {M - 1} \right)\;{\left| {\frac{{{J_1}\left( {2\varepsilon \eta } \right)}}{{\varepsilon \eta }}} \right|^2} + 2M\left( {M - } \right.\\
\;\;\;\;\;\;\;\;\;\;\;\;\;\;\;\;\;\left. 1 \right)\frac{{{J_1}\left( {2\varepsilon \eta } \right)}}{{\varepsilon \eta }}{\left| {\frac{{{J_1}\left( {2\varepsilon \eta } \right)}}{{\varepsilon \eta }}} \right|^2} + M\left( {M - 1} \right)\left( {M - } \right.\\
\;\;\;\;\;\;\;\;\;\;\;\;\;\;\;\;\;\;\left. 2 \right)\left( {M - 3} \right){\left| {2\frac{{{J_1}\left( {2\varepsilon \eta } \right)}}{{\varepsilon \eta }}} \right|^4}
\end{array}
$
|
(33) |
Finally, the approximate BER expression with nodes’ location deviation can be obtained by substituting Eqs.(24)-(33) into Eq.(23). The expression is shown as follows:
|
$
\begin{array}{l}
{P_e} = Q\left( {\frac{v}{{2{\sigma _e}}}\left( {1 - \sqrt {\frac{{2\sigma _e^2}}{{M\sigma _n^2 + 2P\sigma _e^2}}} } \right.} \right),\frac{v}{{2{\sigma _e}}}\left( {1 + } \right.\\
\;\;\;\;\;\;\;\;\;\;\;\;\left. {\left. {\sqrt {\frac{{2\sigma _e^2}}{{M\sigma _n^2 + 2P\sigma _e^2}}} } \right)} \right) - 0.5\left( {1 + \frac{{2\sigma _e^2}}{{M\sigma _n^2}}} \right){I_0} \cdot \\
\;\;\;\;\;\;\;\;\;\;\;\;\left( {\frac{{{v^2}M\sigma _n^2}}{{4\sigma _e^2\left( {M\sigma _n^2 + 2P\sigma _e^2} \right)}}} \right)\exp \left( { - \frac{{{v_2}}}{{2\sigma _e^2}} \cdot \frac{{M\sigma _n^2 + 4P\sigma _e^2}}{{M\sigma _n^2 + 2P\sigma _e^2}}} \right)
\end{array}
$
|
(34) |
From the results, it can be implied that the BER performance is related with the location deviation ε, the angle θ0, the total number of nodes M, and the total transmit power P.
4 Numerical Results and Analysis In this section, the BER performance of collaborative beamforming with nodes’ location deviations is simulated. And it is compared with the approximation BER expression of theoretic analysis in section 3. This paper considers two kinds of channels. One is AWGN channel. And the other is Rayleigh channel. The Rayleigh fading coefficients are selected as hi~CN(0, 1). And the AWGN noise n(t) obeys complex Gaussian distribution CN(0, 1). In order to facilitate to study the BER performance deterioration caused by the nodes’ location deviations, this paper adopts the total transmit power normalized to the received signal to represent the SNR of the received signal. For example, for a number of 10 nodes in a cluster transmit the same signal with equally 0.1 W power individually. That is to say, the total received power is 1 W when the signals are coherently added up at the target AP, which means the received SNR of signal is 0 dB at this condition.
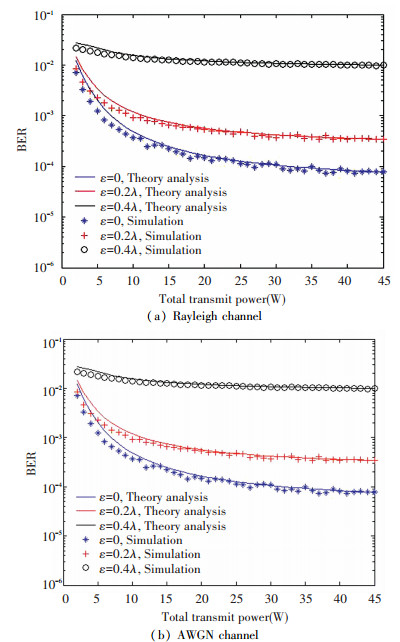
Fig. 4 shows the comparison between the simulation results and the theoretic analysis results versus the total transmit power P. The noise average power is 0 dBW. It can be seen that the simulation curves are very close to the theory analysis curves. From the results, it can be known that a cluster of a larger size achieves better BER performance relative to the smaller size one under the same location deviation. If we set the BER threshold to be10-4, the smaller size cluster with 10 nodes need more than 7 dBW or 5.9 dBW transmit power compared with the larger size cluster with 40 nodes in Rayleigh channel or AWGN channel. When the total transmit power is fixed, the more power are added together, see Eq.(5). The noise of receiver is determined by the noise temperature, which is fixed in the simulation. When the total transmit power is set to be 0.1 W, the SNR at the AP will be 0 dB in AWGN channel for a cluster with 10 nodes. And the SNR will be 6 dB in AWGN channel for a cluster with 40 nodes. From Figs. 4(a) and 4(b), it can be seen that the collaborative beamforming achieves better BER performance in the AWGN channel than the Rayleigh channel.
Although a larger cluster can achieve better BER performance with the same total transmit power, it is more difficult to achieve synchronization in a larger cluster sensor network, which is the first step of collaborative beamforming. It also can be seen from Fig. 4 that with the same size of cluster, the BER performance decline rapidly with the location deviation extend to 0.4λ relative to the original location of sensor nodes individually. When the total transmit power is set to be 0.2 W, the BER will be 3×10⁻⁴ with zero position deviation. And when the position deviations are constrained within 0.2λ, the BER will decline to 1×10⁻³. And when the position deviation is extended to 0.4λ, the BER will decline to 2×10⁻². Therefor it needs accurate nodes’ location when using the collaborative beamforming to achieve satisfied BER performance.
Fig. 5 shows the BER performance versus the size of the cluster M when the total received SNR is set to be 10 dB. The angle θ0 of target AP relative to the reference origin is set to be 40°. From the results, it can be seen that the simulation curves make a better agreement with the theory analysis curves when the size of cluster is larger. This is the reason that when the number of nodes is small, the formulas (13) and (14) make larger deviations from the Gaussian distribution when the number of i.i.d variables is smaller. Although there are deviations between the simulation and the theory analysis, it still provides sufficient accuracy in actual applications. It can be seen from Fig. 5(a) that the BER performance decline quickly from 2 nodes to 10 nodes. And finally it achieves a stable BER performance in the Rayleigh channel. When the total number of nodes is lager, the equivalent channel is close to the Gaussian fading channel (based on CLT theorem), which is better than Rayleigh channel. So with the total number increased, the BER performance is improved. And when the total number is over 20, the equivalent fading distribution is almost the same. This is the reason that the BER is almost unchanged. The trend in Fig. 5(b) is different from that in Fig. 5(a). Because the channel is AWGN channel, the total received SNR is the same with different size of clusters. So the BER performance is stable. From Fig. 5, it can be seen that the BER performance becomes worse as the position deviations becoming lager. In the Rayleigh channel, the number of nodes should be larger than 10 nodes to achieve a good BER performance.
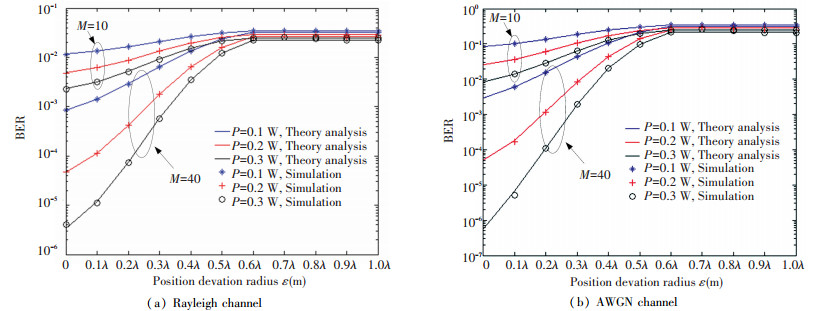
Fig. 6 shows BER performance versus the position deviation radius with different transmit power. The angle θ0 of target AP relative to the reference origin is set to be 40 degree. With the position deviation radius increased, the BER performance degrades fast. Fig. 6(a) shows that when the position deviation is small, increasing the transmit power can improve the BER steeply in both channels. When the position deviation is 0.1λ, BER is nearly 1×10⁻² when the total transmit power is 0.1 W in Rayleigh channel with 40 nodes in a cluster. And when the transmit power increases to 0.2 W, the BER is 4×10⁻⁴, which is a significant improvement. And with the position deviation radius goes up, the BER performance improves. But the BER performance improvement is lesser. When the position deviations are extended to 0.6λ, with the same transmit power increment, the BER improves from 0.2 to 0.1. The reason for the results above is that when the position deviations are small, the corresponding phase shift differences are small, and all the signal contribute to the received power. However when the position deviation is large, the corresponding phase shift is so big that some of them increase the signal power with phase deviation within 90°. And the others decrease the power for the phase deviation is greater than 90°. Then it comes to the conclusion that when the position deviation radius is large, increasing power cannot improve BER anymore. When the position deviation radius is small, the increment in transmit power achieves higher BER performance improvement.
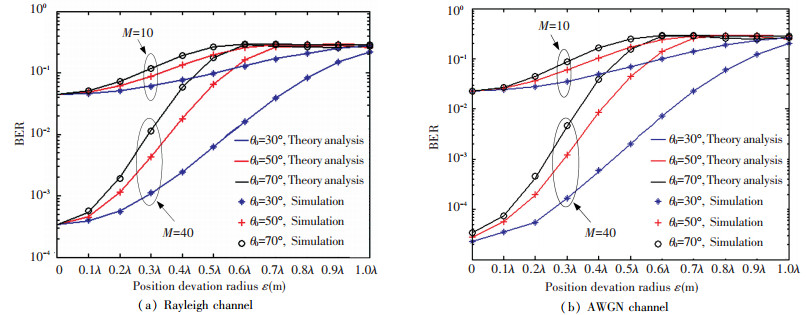
Fig. 7 shows the BER performance versus the position deviation radius with different elevation angle π/2-θ0. The total transmit power is set to be 0.2 W. The results indicate that with bigger elevation, the rate of BER improvement is smaller in both channels. For example, the position deviation radius is set to be 0.3λ with 40 sensor nodes in a cluster. If the elevation angle is set to 60°, the BER becomes 1×10⁻³ at the AP. If the elevation angle is 40°, the BER degrades to 4×10⁻³. And if the elevation angle is 20°, the BER performance is 1×10⁻², which means a larger elevation will help the distributed beamforming to combat the nodes mobility. The reason for the results above is that with high elevation angle, the corresponding phase shift εcos(π/2-θ0) is small.
5 Conclusions This paper has derived the BER closed-form expression of collaborative beamforming transmission of clustered wireless sensor network. It has discussed the numerical results and the theoretical analysis BER results, and has come to the following conclusions. The first is that the BER performance is better when the scale of cluster is larger with the same location deviation radius. But when the number of sensor nodes is larger, the difficulty in synchronization and sharing message among the cluster is larger. The selection of number of nodes should be tradeoff between the SNR improvement and the system complexity. The second is that the number of nodes should be no less than 10 nodes to achieve good BER performance in the Rayleigh channel. The third one is that the BER performance decreases as the position deviation radius increased. And when the position deviation radius is large, increasing power cannot improve BER anymore. And last, the paper shows that larger elevation helps the distributed collaborative beamforming to combat the nodes’ mobility.

 0)
0)
 0)
0)
 0)
0)
 0)
0)
 0)
0)
 0)
0)
 0)
0)
 0)
0)
 0)
0)
 0)
0)
 0)
0)
 0)
0)
 0)
0)
 0)
0)
 0)
0)
 0)
0)
 0)
0)
 0)
0)
 0)
0)
 0)
0)
 0)
0)
 2016, Vol. 23


