Cryogenic fluids such as liquid hydrogen and liquid oxygen are promoted as propellants for rocket and other aerospace equipment[1]. However, it is well known that the high speed rotating turbo pump often causes a lower pressure around the inducer, and then cavitation occurs when the fluid pressure drops below the vapor pressure in the local thermodynamic state[2-3]. Vapor production from cavitation extracts the latent heat of evaporation from the surrounding liquid and then temperature depression occurs inside cavity, which is called the thermodynamic effects of cavitation[4]. Cryogenic fluids are thermo-sensitive, and therefore, thermodynamic effects and significant variations in fluid properties can alter the cavitation properties. It is important to clarify the fundamental characteristics of the cavitating flows in cryogenic fluids, as well as to quantitatively evaluate the influence of thermodynamic effects.
Compared to the study on room temperature liquids, studies on the cryogenic liquids cavitating flow are limited[5-6]. During the past few decades, some worthy efforts have been made to investigate correlative studies by researchers theoretically, experimentally and numerically. Hord[7] carried out the systemic cryogenic, cavitation experiments with the support of NASA, by using liquid nitrogen and liquid hydrogen. The experimental data has been employed in numerical validation for thermodynamic effects in cavitating flow. Franc et al.[8] carried out experiments to investigate the effects of thermodynamic at three different temperatures on Freon R-114 cavitation, which is used in inducer blades. The onset of blade cavitation was found to be delayed at higher reference temperature. Recently, numerical modeling for thermodynamic effects on cavitation has been attempted to understand the related phenomena in detail. Hosangadi et al.[9] investigated cavitation in cryogenic fluids, and they suggested lower parameters value for cavitation model.Wei et al.[10] assessed the numerical capabilities of different cavitation and turbulence model for unsteady cavitating flows, and they found there were significant differences between diverse cavitation and turbulence models combinations. Zhang et al.[11] developed a new cavitation model by re-calculating the bubble radius in the full cavitation model to account for the effects of local pressure. Huang et al.[12] conducted 2D cavitating flows in liquid nitrogen and liquid hydrogen, and they found that the material properties are more critical than the model parameter controlling the condensation and evaporation rates. Tseng et al.[13] investigated the empirical coefficients of cavitation and turbulence model though steady and unsteady turbulent cavitating flows. Zhu et al.[14] developed the Schnerr-Sauer cavitation model by modifying the bubble number density to simulate the cryogenic cavitating flows.Chen et al.[15] studied the thermodynamic effects on cryogenic cavitating flows and analyzed the specific effects on mass transportation process and field structure. However, caivitating flows in cryogenic fluids in subcooled cryogenic fluids have not been clarified although several researchers have investigated correlative studies.
In the present study, therefore, the detailed analysis of the cavitating flows in liquid hydrogen and a parametric study of dimensionless thermodynamic coefficient are numerically conducted over a three dimensional hydrofoil, which can provide insight into the thermodynamic effects on cavitation and fundamental characteristics of the cavitating flows in liquid hydrogen. The predictions of the characteristics in cryogenic cavitating flows can provide efficient reference for the future design and performance of engineering devices.
2 Computational Methodologies and Cavitation ModelThe computational simulations are carried out using Computational Fluid Dynamics (CFD) code CFX. In the present study, we used a homogeneous multiphase transport equation based model.The numerical approach consists of basic governing equations, turbulence model, and cavitation model. In the governing equations, the energy equation is solved in conjunction with the mass and momentum conservation, and the thermodynamic effects in the cavitation are taken into account as a source term based on the latent heat in the energy equation.A two-equation, k-ε model is employed as the turbulence closure approach, as it offers a well established regime of predictive capability.Meantime, the scalable wall-function approach is used, which can improve the robustness near wall mesh.Furthermore, the thermodynamic properties of liquid hydrogen and vapor such as density, heat capacity, saturated pressure, etc.are defined as functions of temperature at the local point of flow field, and then these temperature dependent properties are updated from a comprehensive data base throughout the process of computations in every iteration.
Physically, the cavitating flows are governed by the thermodynamics and kinetics of the phase change process. A transport equation for either mass or volume fraction is solved with appropriate source terms to regulate the mass transfer between phases. The mass transfer rates for the present Merkle cavitation model are, respectively, as shown as follows[16]:
| ${{\dot{m}}^{-}}=\frac{{{C}_{\text{dest}}}{{\rho }_{l}}{{\alpha }_{l}}\min \left[ 0,p-{{p}_{v}} \right]}{\left( 0.5{{\rho }_{l}}U_{\infty }^{2} \right){{\rho }_{v}}{{t}_{\infty }}},p\le {{p}_{v}}\left( T \right)$ | (1) |
| ${{\dot{m}}^{+}}=\frac{{{C}_{\text{prod}}}\max \left[ 0,p-{{p}_{v}} \right]\left( 1-{{\alpha }_{l}} \right)}{\left( 0.5{{\rho }_{l}}U_{\infty }^{2} \right){{t}_{\infty }}},p>{{p}_{v}}\left( T \right)$ | (2) |
where, the sink term
Hord[7] conducted the most comprehensive experiments on cryogenic cavitating flows with liquid nitrogen and hydrogen so far, under different sets of cavitation number and temperature conditions. The pressure and temperature data in the cavitation region have been widely employed for computational validation. In present study, we model flow over a 3D quarter caliber hydrofoil, which was experimentally investigated by Hord. The tunnel and hydrofoil geometry as shown in Fig. 1 are used to clarify the detail geometrical structure. Both of the width and height of the tunnel are 25.4 mm, and the leading edge diameter of the hydrofoil is D=7.92 mm. The boundary conditions of the computational domain are also shown in Fig. 1. An inlet velocity is imposed based on the experimental data, and the outlet pressure is set to vary according to the inlet cavitation number, and the adiabatic no-slip wall boundary conditions are set to the tunnel wall and the hydrofoil surface.

|
Figure 1 Computation domain and boundaries[7] |
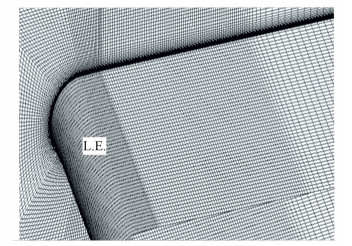
The computational domain mesh is shown in Fig. 2. The structured grids of H-type and C-type are adopted in the calculation, the grids refinements are performed at the leading edge and the cavitation region to get better capture of the flow structures There are 190 nodes along the body of the hydrofoil, 64 nodes are set along the spanwise directions, and approximately 60 nodes are generated normally to the hydrofoil in the region between it and the tunnel wall. In order to validate the efficiency of mesh generation, we performed flow simulation and compared it to Hord’s experimental data in Fig. 3. It shows good agreement of pressure coefficient Cp between calculated result and experimental data (where Cp=(p-p∞)/(0.5ρlU∞2)).

|
Figure 2 Mesh generation around hydrofoil surface |

|
Figure 3 Mesh validation by comparing the pressure data |
4 Results and Discussions 4.1 Computational Model Validation and Analysis of Thermodynamic Effects
In order to validate the numerical model, two cases in liquid hydrogen with different free stream temperatures T∞ and inlet cavitation numbers σInt are selected randomly. Furthermore, the cavitating flows of water over a hemispherical projectile at room temperature are conducted to better understand and compare flow characteristics under cryogenics conditions. Table 1 summarizes the run conditions of different cases.
| Table 1 Simulation cases and run conditions |
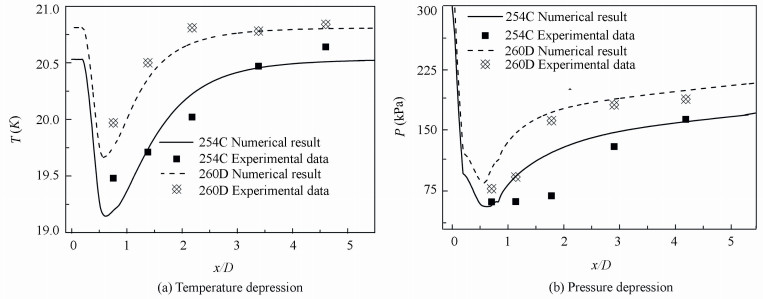
Fig. 4 compares the computational temperature and pressure depression with Hord’s measurements data along the hydrofoil. The overall temperature and pressure profiles appear to be similar. It is clear that the strong temperature depression occurs at the leading edge of hydrofoil in Fig. 4(a), and then it gradually recover to the freestream temperature due to condensation near the closure region of the cavity. In Fig. 4(b), the largest temperature depression value for the cases of 254C and 260D are 1.35 K and 1.16 K respectively. These results indicate that vaporization absorbs the heat from the bulk liquid due to the thermodynamic effects, and the bulk of the vaporization in occurring near the leading edge.

|
Figure 4 Computed temperature and pressure depression in liquid hydrogen cavities compared with experimental data |
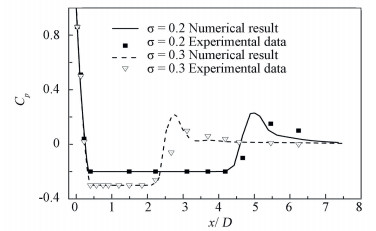
Fig. 5 shows the quantitative comparisons of pressure profiles with experimental data in water. However, there is a distinct difference in the character of the pressure distribution between liquid hydrogen and water. For the cases in water at room temperature, the pressure in the cavity is at a constant value given by the run conditions, whereas the cryogenic cases substantially steeper pressure profiles along the surface. Interestingly, the pressure recovers in the cavity closure region is slower in the cryogenic cases compared to those in water at room temperature. This can be explained that the thermodynamic effects cause the temperature depression inside the cavity, which results in the actual pressure is characterized by the saturation pressure corresponding to the local thermodynamic state.

|
Figure 5 Wall pressure distribution in water cavities compared with experimental data |
4.2 Cavitation Comparison Between Liquid Hydrogen and Water
To gain insights into the fundamental characteristics of cavitating flows in liquid hydrogen, the case 231C from the experimental data reported by Hord[7] is conducted with the following conditions: T0=20.63 K, σInt=1.32, Re=2.21×10⁶. And then cavitating flows with the same geometry model is investigated by artificially altering the run conditions for water while keeping the same dynamics equilibrium with that attained by case 231C, as a comparison. Fig. 6 shows the contour of liquid volume fraction in the mid-plane of the hydrofoil for the different cases. It is clearly that the thickness of the cavity at near the leading edge is larger for the cryogenic case. Whereas for the cavitation of water, a sharp reentrant flows at the cavity closure region is obtained.

|
Figure 6 Contour of liquid volume fraction of liquid hydrogen and water |
In order to probe the mass transfer characteristic between liquid and vapor, we refer to Eqs. (1) and (2) for evaporation dynamics and condensation dynamics respectively. A dimensionless mass transfer rate
| ${{\dot{m}}_{c}}=\frac{\dot{m}{{L}_{c}}}{{{U}_{\infty }}{{\rho }_{l}}}$ | (3) |
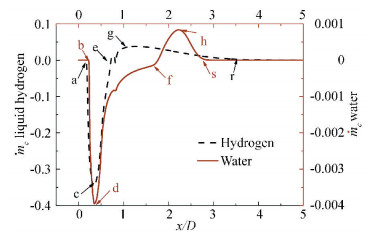
For the cases 231C in liquid hydrogen and water mentioned above, Fig. 7 shows the comparisons of dimensionless source term

|
Figure 7 Comparison of the computed characteristic mass transfer between liquid hydrogen and water |
As for the condensation rate in Fig. 7 (e-g-r for liquid hydrogen and f-h-s for water), the initial positions of condensation are different from liquid hydrogen to water. The primary factor controlling the evaporation-to-condensation transition position along the hydrofoil surface appears to be one of the thermodynamic effects. As evaporation takes place, in the upstream part of the cavity the absorption of latent heat causes temperature depression to the surrounding substance, therefore, the thermodynamic effects trend to restrain the development of cavitation and then boost the evaporation-to-condensation transition position to the leading edge of the hydrofoil.
4.3 Parametric Evaluation of Thermodynamic EffectsA well-known dimensionless cavity temperature depression of B-factor has been introduced to estimate the importance of thermodynamic effects on the temperature depression in cavitating flows by Stepanoff[19]:
| $B=\frac{\Delta T}{\Delta {{T}^{*}}}$ | (4) |
where ΔT is the actual temperature depression in the cavitating flows, and ΔT* is expressed in the term of ΔT*=ρvL/ρlCpl.
To take into consideration the influence of physicalproperties of liquid and running conditions, a dimensionless parameter Σ* proposed in Ref. [4] can be used to estimate the thermodynamic effects in cryogenic liquids, and it is given by:
| ${{\Sigma }^{*}}=\frac{{{L}^{2}}}{{{C}_{pl}}{{T}_{\infty }}}{{\left( \frac{{{\rho }_{v}}}{{{\rho }_{l}}} \right)}^{2}}\sqrt{\frac{{{L}_{c}}}{{{a}_{L}}U_{\infty }^{3}}}$ | (5) |
where aL is the thermal diffusivity of the liquid. It is evident that the thermodynamic parameter changes by many orders of magnitude in a given liquid as the temperature T∞ varies. Table 2 summarizes the values of Σ* for different liquids in the certain experimental conditions.
| Table 2 Values of Σ* estimated for some studies |
Based on the computational method above, different values of the dimensionless thermodynamic parameters Σ* are taken according to Hord’s experiment in Table 2 in the present study. Fig. 8 shows the dimensionless temperature depression B corresponding to the thermodynamic parameter Σ* along the surface of the hydrofoil. We can see that the B-factor decreases in the cavitation region as Σ* increases, implying that the thermodynamic effect is significant for lower thermodynamic parameter Σ*. The B-factor values near the leading edge region are larger than those in downstream. The temperature depression B depends upon the liquid properties and temperature depression. For the cavitating flows in liquid hydrogen, temperature depression near the leading edge is larger than that downstream. The thermodynamic effects become more significant under larger thermodynamic parameters Σ*. This is the reason why the B-factor decreases in the cavitation region as Σ* increases under cryogenic conditions.

|
Figure 8 Dimensionless B corresponding to the Σ* |
To focus on the effect of thermodynamic parameter Σ* on the fluid dynamics of cavitation, the pressure coefficient Cp along the hydrofoil is shown in Fig. 9. The Cp for three cases with Σ*=660, Σ*=761 and Σ*=891 are plotted for the cases with the inlet cavitation number of σInt=1.25, T∞=20.53 K. It shows that the pressure distribution trends are in general similar to what is discussed in Section 4.1. It should be noted that the values of Cp decrease along the hydrofoil as Σ* increases, however, there are only minor differences in the pressure depression, and hence pressure distributions are non-sensitive for different thermodynamic parameter Σ* with the same inlet cavitation number. For non-cryogenic fluids like water, Cp=-σ. We know that temperature drops at the leading edge, and the local saturation pressure will be changed. Consequently, the minor differences in the pressure depression occur along the hydrofoil due to thermodynamic effects.

|
Figure 9 Pressure coefficient Cp with various values Σ* |
Fig. 10 plots the cavity length against the cavitation number by the present analysis for the cases with different Σ*. The cavity length Lcav is normalized by the characteristic length. It is noticeable that the cavity length decreases with the increase of σInt, the slope of the cavity length in relation to cavitation number is almost linear. As well as the growth of cavity length is suppressed toward a larger Σ*. Hence increasing the thermodynamic parameter Σ* and cavitation number will result in a weaker cavitation intensity. It is because cavitation intensity will be restrained with smaller cavitation number and more pronounced thermodynamic effects.

|
Figure 10 Cavity length versus σInt for various values of Σ* |
5 Summary and Conclusions
The present work is devoted to analyze of the fundamental characteristics and the thermodynamic effects of cavitating flows in liquid hydrogen. For this purpose, quasi-steady computations over 3D quarter caliber hydrofoil are conducted. The primary findings and conclusions are as follows:
1) For cryogenic cavitating flows, the evaporative cooling shows noticeable effect on the dynamics characteristics, including the pressure and temperature. The thermodynamic effects result in a larger gradient temperature depression and pressure distribution than that in water at room temperature. The pressure recover in the cavity closure region is slower in the cryogenic cases compared to the cavitating flows in water.
2) Thermodynamic effects have significant impact on the characteristics of mass transfer between liquid and vapor. Due to the latent heat of vaporization, the mass transfer in liquid hydrogen around 20 K can be ninety high than that of water at room temperature, in order to obtain the same dynamics equilibrium. The thermodynamic effects trend to restrain the development of cavitation and then boost the evaporation-to-condensation transition position to the leading edge of the hydrofoil.
3) The thermodynamic parameter Σ* contributes to give an insight into the thermodynamic effect on the cavitating flows. Increasing the thermodynamic parameter Σ* will result in a weaker cavitation intensity and smaller dimensionless temperature depression B-factor. Pressure distributions are non-sensitive for different thermodynamic parameter Σ*with the same inlet cavitation number.
| [1] |
Ohira K, Nakayama T, Nagai T. Cavitation flow instability of subcooled liquid nitrogen in converging-diverging nozzles.
Cryogenics, 2012 , 52 (1) : 35-44.
DOI:10.1016/j.cryogenics.2011.11.001 ( 0) 0)
|
| [2] |
Batchelor G K.
An Introduction to Fluid Dynamics. Cambridge: Cambridge University Press, 2000 .
( 0) 0)
|
| [3] |
Joseph D D. Cavitation in a flowing liquid.
Physical Review E, 1995 , 51 (3) : R1649.
DOI:10.1103/PhysRevE.51.R1649 ( 0) 0)
|
| [4] |
Watanabe S, Hidaka T, Horiguchi H, et al. Analysis of thermodynamic effects on cavitation instabilities.
Journal of Fluids Engineering, 2007 , 129 (9) : 1123-1130.
DOI:10.1115/1.2754326 ( 0) 0)
|
| [5] |
Ji B, Luo X, Wu Y, et al. Numerical analysis of unsteady cavitating turbulent flow and shedding horse-shoe vortex structure around a twisted hydrofoil.
International Journal of Multiphase Flow, 2012 , 51 : 33-43.
DOI:10.1016/j.ijmultiphaseflow.2012.11.008 ( 0) 0)
|
| [6] |
Ducoin A, Young Y L. Hydroelastic response and stability of a hydrofoil in viscous flow.
Journal of Fluids and Structures, 2013 , 38 : 40-57.
DOI:10.1016/j.jfluidstructs.2012.12.011 ( 0) 0)
|
| [7] |
Hord J. Cavitation in Liquid Cryogens Ⅱ -Hydrofoil. Technical Report, NASA CR-2156. Washington, DC:NASA, 1973.
( 0) 0)
|
| [8] |
Franc J P, Janson E, Morel P, et al. Visualizations of leading edge cavitation in an inducer at different temperatures. http://resolver.caltech.edu/cav2001:sessionB7.002, 2001.
( 0) 0)
|
| [9] |
Hosangadi A, Ahuja V. Numerical study of cavitation in cryogenic fluids.
Journal of Fluids Engineering, 2005 , 127 (2) : 267-281.
DOI:10.1115/1.1883238 ( 0) 0)
|
| [10] |
Wei Y J, Tseng C C, Wang G Y. Turbulence and cavitation models for time-dependent turbulent cavitating flows.
Acta Mechanica Sinica, 2011 , 27 (4) : 473-487.
DOI:10.1007/s10409-011-0475-3 ( 0) 0)
|
| [11] |
Zhang X B, Wu Z, Xiang S J, et al. Modeling cavitation flow of cryogenic fluids with thermodynamic phase-change theory.
Chinese Science Bulletin, 2013 , 58 (4/5) : 567-574.
DOI:10.1007/s11434-012-5463-x ( 0) 0)
|
| [12] |
Huang B, Wu Q, Wang G. Numerical investigation of cavitating flow in liquid hydrogen.
International Journal of Hydrogen Ennergy, 2014 , 39 (4) : 1698-1709.
DOI:10.1016/j.ijhydene.2013.11.025 ( 0) 0)
|
| [13] |
Tseng C C, Wang L J. Investigations of empirical coefficients of cavitation and turbulence model through steady and unsteady turbulent cavitating flows.
Computers & Fluids, 2014 , 103 : 262-274.
DOI:10.1016/j.compfluid.2014.07.026 ( 0) 0)
|
| [14] |
Zhu J, Chen Y, Zhao D, et al. Extension of the Schnerr-Sauer model for cryogenic cavitation.
European Journal of Mechanics-B/Fluid, 2015 , 52 : 1-10.
DOI:10.1016/j.euromechflu.2015.01.008 ( 0) 0)
|
| [15] |
Chen T, Wang G Y, Huang B, et al. Numerical study of thermodynamic effects on liquid nitrogen cavitating flows.
Cryogenics, 2015 , 70 : 21-27.
DOI:10.1016/j.cryogenics.2015.04.009 ( 0) 0)
|
| [16] |
Merkle C L, Feng J, Buelow P E O. Computational modeling of the dynamics of sheet cavitation. Proceedings of the 3rd International Symposium on Cavitation. France. 1998. 307-311.
( 0) 0)
|
| [17] |
Senocak I, Shyy W. Interfacial dynamics-based modelling of turbulent cavitating flows, Part-1: Model development and steady-state computations.
International Journal for Numerical Methods in Fluids, 2004 , 44 (9) : 975-995.
DOI:10.1002/fld.692 ( 0) 0)
|
| [18] |
Rouse H, McNown J S. Cavitation and Pressure Distribution: Head Forms at Zero Angle of Yaw. Iowa: State University of Iowa, 1948. 49-64.
( 0) 0)
|
| [19] |
Stepanoff A J. Cavitation properties of liquids.
Journal of Engineering for Gas Turbines and Power, 1964 , 86 (2) : 195-199.
DOI:10.1115/1.3677576 ( 0) 0)
|
| [20] |
Fruman D H, Reboud J L, Stutz B. Estimation of thermal effects in cavitation of thermosensible liquids.
International Journal of Heat and Mass Transfer, 1999 , 42 : 3195-3204.
DOI:10.1016/S0017-9310(99)00005-8 ( 0) 0)
|
| [21] |
Tani N, Nagashima T. Numerical analysis of cryogenic cavitating flow on hydrofoil-comparison between water and cryogenic fluids.Proceedings of the 4th International Conference of Launcher Technology. Liege, Belgium, 2002. Paper No. 27.
( 0) 0)
|
 2016, Vol. 23


