2. Changchun Institute of Optics Fine Mechanics and Physics Chinese Academy of Sciences, Changchun 130033, China
Generally, noise in an input signal has lower frequencies than higher order harmonics of the real signal, whereby the general low-pass filter is apt to lose effect[1-5]. Given a cutoff frequency lower than that of the noise, the higher order harmonics will be removed as well as the noise, resulting in a low slew rate and severe signal distortion[6-8]. On the other hand, the filter fails when a cutoff frequency higher than that of the noise is set, hence the dilemma. For example, the general 3-order low pass filter[9] is by far more effective than the general 1-order and 2-order low pass filter in noise reduction. However, the simulation results indicate that it has a limited slew rate of 3.2 V/ms and the maximum phase delay exceeds 99° when the real signal has frequencies below the cut-off frequency.
By using the distributive characteristics of noise[10-14], the quick response noise filter is designed. This filter directly selects the high peak and low peak of the input signal and then applies the average value of them in order to reduce noise. It is simple without DSP arithmetic units[15-18] and has low power consumption.
A simulation experiment under MULTISIM has been carried out by using the square or sinusoidal wave as the real signal. In our experiment scheme, the first step is to mingle real signal with noise. Then we input the mixture into the general 3-order low-pass filter and quick response filter. Finally, we calculate the attenuation of noise amplitude, observe the frequency responses and analyze the slew rate in order to give comparisons of the two filters' performance regarding noise reduction, phase distortion and response speed. The experimental results indicate that the quick response noise filter performs significantly better regarding response speed and phase integration. The experiment also draws comparison to these two filters' properties in a color tester design.
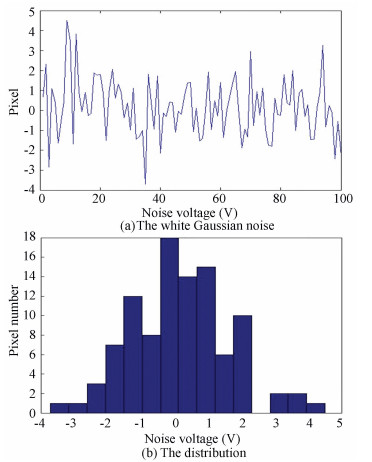
2 Noise Filter DesignThe thermal noise and shot noise are common in output signals of sensors. They both belong to the white Gaussian noise. In Matlab, function WGN is used to create this noise as shown in Fig. 1(a).
|
Figure 1 The white Gaussian noise and its distribution |
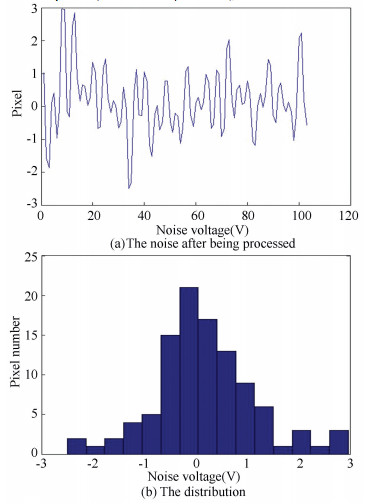
The noise distribution is shown in Fig. 1(b). The max and mean absolute value are 4.504 9 and 1.1497 respectively. Then the noise is expected to be reduced by averaging adjacent peaks. The results are shown in Fig. 2.
|
Figure 2 The noise after being processed and its distribution |
After data processing, the max absolute value of the original noise decreases from 4.504 9 to 2.967 1 and the mean absolute value falls from 1.149 7 to 0.763 9. Therefore this denoising method is effective. The design idea of the filter proposed in this paper is based on this method. And the denoising effect is expected to be better as the peak sampling of analog circuits is sequential.
Fig. 3 shows the quick response noise filter's structure diagram. After passing the reverse amplification circuit, mixed signals enter the high peak picking circuit and low peak picking circuit. The two circuits draw high peak and low peak of input signals separately. As buffer, BJT Q1 and Q2 show good performance in rectification. Then we utilize the charging and discharging functions of capacitances C1 and C2 to pick the novel peaks and apply their average to reduce random noise by setting R1=R2=2R3. For faster response, Diodes D1 and D2 are needed.

|
Figure 3 The quick response noise filter structure diagram |
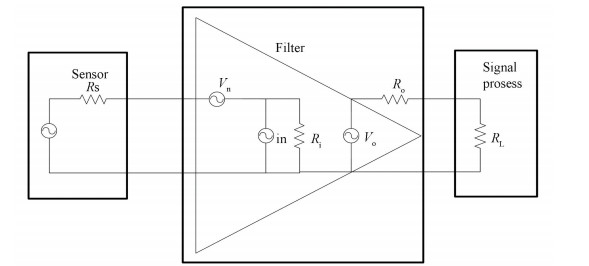
In this filter design, an amplifier with voltage feedback is used as the input terminal as shown in Fig. 4.For better SNR performance, low inside noise (Vn, in) and high input impedance are needed. After passing the filter, the signals may be processed with ADC or other signal processing devices.Therefore, low output impedance is necessary.
| $ {{V}_{o}}={{V}_{i}}\text{ }\!\!\times\!\!\text{ }G\text{ }\!\!\times\!\!\text{ }{{T}_{\left( f \right)}} $ | (1) |
|
Figure 4 Amplifier characteristics analysis |
As shown in formula (1), gain with high linearity (G) and good frequency characteristics (T(f)) are needed for better stability.
All in all, the amplifier characteristics are very important. High input resistance (IR), high slew rate (SR), wide gain bandwidth product (GBP) and low equivalent input noise voltage (EN) are needed. For example, a AD8047 is used in the experiment part with a high IR of 500 kΩ. The GBP is 130 MHz, wide enough for input signals (500 kHz) when G is 1. The EN is 5.2 nV/
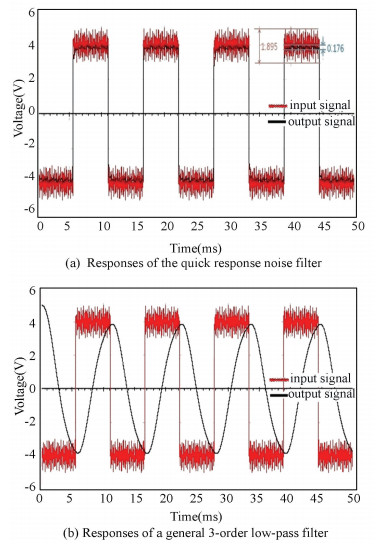
In the MULTISIM 13.0 simulation environment, the real signal frequency is set 90 Hz, Vpp is 8 V. A mixture of two triangular waves (one being 530 Hz, Vpp 1 V, the other being 840 Hz, Vpp 1 V) is used as noise for spectrum analysis. The response results are shown in Fig. 5 when the real signal is a square wave. Fig. 5(a) shows the noise filter's response and Fig. 5(b) shows the response of a general 3-order low pass filter. The smoothness shows that two filters have comparable denoising performance. However, The quick response noise filter has a slew rate of 472 V/ms, while that of the general 3-order low pass filter is only 3.2 V/ms, which indicates that the quick response noise filter responses considerably faster.
|
Figure 5 The responses when the real signal is square wave |
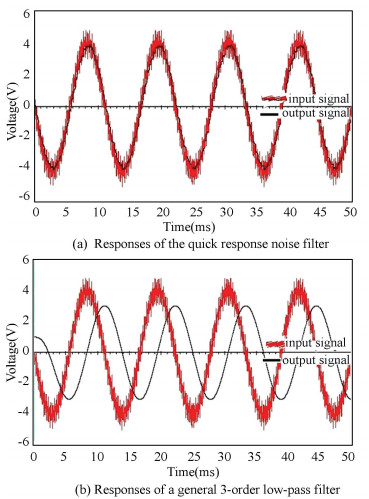
The responses are shown in Fig. 6 when the real signal is a sinusoidal wave. Fig. 6(a) shows the response of the quick response noise filter, whose phase difference between real signals and output signals is nearly zero. Fig. 6(b) shows the response of a general 3-order low pass filter, whose phase delay is as large as 79.459°. The simulation results indicate that the quick response noise filter is better at remaining phase integrity.
|
Figure 6 The responses when the real signal is a sinusoidal wave |
It is shown in Figs. 5(a) and 6(a) that, output signals are located at the median of the high and low peaks of input signals.Fig. 5(a) indicates that when the real signal is a square wave, the Vpp of the output noise is 0.176 V while the Vpp of the input noise is 1.895 V, and the attenuation of noise amplitude is more than 20 dB. In the same way, the attenuation of noise amplitude is proved to be more than 20 dB when the real signal is sinusoidal. This result indicates that the quick response noise filter's performance meets the requirements on noise reduction in most cases.
In Fig. 7(a), the spectrums marked by the blue circles correspond to 530 Hz and 840 Hz noise respectively, the rest are spectrums of the real signal (square wave, 90 Hz). The comparison of Figs. 7(a), 7(b) and 7(c) shows that the quick response noise filter removes noise and remains higher order harmonics of real signals at the same time. Contrarily, the general 3-order low-pass filter removes all harmonics whose frequency is higher than its cut-off frequency, leading to signal distortion.

|
Figure 7 The FFT results |
In summary, the quick response filter has a high slew rate of 472 V/ ms and small phase delay (close to 0), better than the 3-order low-pass filter[9] dose (3.2 V/ms and 79.459° respectively). This filter also has high noise rejection ratio, exceeding 20 dB, showing better performance than that of the circuit presented in Ref. [19]. Furthermore, this filter can remain higher order harmonics perfectly and has low power consumption of 25 mW.
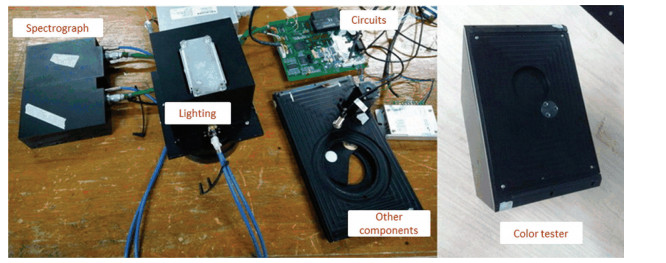
4 Experimental ResultsThe color tester and its main components are shown in Fig. 8. The standard light source is a xenon lamp. This light is divided to two beams in the lighting module. One goes to the spectrograph by a fiber directly. The other shines on the target and the reflected light goes to the other spectrograph then. By analyzing the spectrum of the two beams, the color of target can be known.
|
Figure 8 The color tester and its main components |
The image sensor used in the spectrograph is S3923-512Q made by HAMA-MATSU. In this case, a 16 bit ADC-AD7980 is needed since the sensor outputs only analog signals and a general RC low-pass filter with a cutoff frequency of 3.9 M is designed. Tests on the system have been done with a xenon lamp as the standard source for 20 times.
| $ \sigma =\sqrt{\sum\limits_{i=1}^{N}{{{\left( {{x}_{i}}-\bar{x} \right)}^{2}}/\left( N-1 \right)}} $ | (2) |
The standard deviation of each pixel value is calculated using formula (2), and they are shown by a curve given in Fig. 9.

|
Figure 9 The standard deviation of general low-pass filter's response |
The maximum is 142.18 and the mean value is 101.85, which fail to meet the accuracy requirement for measuring. However the cutoff frequency of the low-pass filter cannot be lower since the sampling frequency of ADC has to be as high as 1 M.
Forfurther noise reduction, the circuit as shown in Fig. 1 is redesigned. In this case, a AD8047 is used as the amplifier. R4=R5=1 k Ω, C1=C2=10 nF, R6=R7=10 k Ω, R1=R2=2R3=10 k Ω. Q1 is a 2SC1815, Q2 is a 2SA1015. Both D1 and D2 are 1N5818G.
Tests on the system have been done with the same xenon lamp as the standard source for 20 times. After calculating the standard deviation of each pixel value using formula(2), a curve showing them is plotted, as shown in Fig. 10. The maximum is 77.54 and the mean value is 22.24, indicating better performance.

|
Figure 10 The standard deviation of noise filter's response |
For ERX50, a color measurement system made by Gretag Macbeth, the relative standard deviation of the spectrograph is less than 0.3% when the DN value is larger than 10 000. In contrast, this value in our device is only 0.22%(the mean standard deviation is 22.24 when the mean input data is 10 096), enhancing measuring accuracy.
5 ConclusionsThe quick response noise filter is designed according to the distribution characteristics of noise, rather than cutting it off at a specific frequency, based on which the general low pass filter is designed. For this reason, this filter can reduce noise, whose frequencies are lower than that of higher order harmonics of real signals, and leaves the latter intact. While the general low-pass filter is apt to lose effect in this case.
This filter has a high slew rate, small phase delay and large attenuation of noise amplitude. Meanwhile, it keeps integrity of real signals and requires no complicated hardware architecture on DSP. Based on this method, low-power, low-cost chips for noise reduction can be designed without external components. With this filter's help, the relative standard deviation of the spectrograph decreases from 1% to 0.22%, indicating better stability, even stabler than a similar device made by Gretag Macbeth.
| [1] |
Gao Xudong, Ye Yongqiang, Wang Jianhong. Design of a fractional zero-Phase filter based on liouville_wey1 Integral.
Proceedings of the 6th International Congress on Image and Signal Processing, 2013 (1205) : 1210.
( 0) 0)
|
| [2] |
Xue Xuchen, Li Yunfei, Guo Yongfei. Design of analog front end of CCD imaging system.
Optics Precision Engineering, 2007 , 15 (8) : 1191-1195.
( 0) 0)
|
| [3] |
Yan Jie, Wang Baiming. A study on filter circuits based on sample and hold amplifier.
Microelectronics, 2006 , 36 (6) : 707-710.
( 0) 0)
|
| [4] |
Qi Jianye, Wang Xiaoli, Wang Shoujun. Analog filter design with low noise for digital video broadcasting-handheld tuner. Journal of Xi'An JiaoTong University, 2009, 43(2): 72:76. (in Chinese)
( 0) 0)
|
| [5] |
Nai Ling-chuan, Chen Qian. Design and implementation of analog filter for dual-band stator ground protection.
Electric Design Engineering, 2013 , 21 (3) : 112-117.
( 0) 0)
|
| [6] |
Ren Huilong, Jia Lianhui, Li Chenfeng, et al. Filter Design of ship structure stress monitoring system.
Journal of Harbin Engineering University, 2013 , 34 (8) : 945-951.
( 0) 0)
|
| [7] |
Zhang hui, Zhong Jianyong, Yuan Jiahu, et al. Circuit noise effects on star sensor position accuracy.
Optics and Precision Engineering, 2006 , 14 (6) : 1052-1056.
( 0) 0)
|
| [8] |
Ma Hua, Ye Yizheng, Wang Yongsheng, et al. Design and optimizing of programmable OTA-C band-pass filter immune to process variation.
Journal of Harbin Engineering University, 2010 , 31 (2) : 237-242.
( 0) 0)
|
| [9] |
Tietze U, Schenk Ch. Electronic Circuits Handbook for Design and Applications.
Springer, Heidelberg, 1991 .
( 0) 0)
|
| [10] |
Crosby M G. Frequency modulation noise characteristics.
Proceedings of the Institute of Radio Engineers, 1937 , 25 (4) : 472-514.
DOI:10.1109/JRPROC.1937.229050 ( 0) 0)
|
| [11] |
Wu Ifong, Ohta Hiroki, Gotoh Kaoru. Characteristics of radiation noise from an LED lamp and its effect on the BER performance of an OFDM system for DTTB.
IEEE Transactions on Electromagnetic Compatibility, 2014 , 56 (1) : 132-142.
DOI:10.1109/TEMC.2013.2277596 ( 0) 0)
|
| [12] |
Xue Xucheng, Li Yunfei, Guo Yongfei. Design of analog front end of CCD image system.
Optics and Precision Engineering, 2007 , 15 (8) : 1191-1195.
( 0) 0)
|
| [13] |
He Weiji, Chen Qian, Qu Huiming, et al. Charge multiplication characteristics of multiplying charge coupled devices.
Acta Optica Sinica, 2008 , 26 (6) : 1161-1166.
( 0) 0)
|
| [14] |
Qi Zhiqiang. Experience and understanding of high-speed PCB design.
Electronic Design Engineering, 2011 , 19 (16) : 141-143.
( 0) 0)
|
| [15] |
He Bin. Method of construction and realization on optimized model of analogue circuit.
Optics and Precision Engineering, 1996 , 4 (6) : 95-99.
( 0) 0)
|
| [16] |
Zhang Shuchun, Huang Guangda. Square root filtering and its application in target tracking.
Journal of Harbin Engineering University, 2008 , 40 (5) : 700-704.
( 0) 0)
|
| [17] |
Zhou Zhenhua, Wang Mao, Wang Xuehan. Design of resilient H∞ filter for discrete-time piecewise-affine singular systems, Journal of Harbin Engineering University, 2014, 46(11):8-16(in Chinese).
( 0) 0)
|
| [18] |
Mukherjee S, Kar R, Mandal D. Linear phase low pass FIR filter design using improved particle swarm optimization.
IEEE Student Conference on Researchand Development, Piscataway:IEEE, 2011 : 358-363.
DOI:10.1109/SCOReD.2011.6148765 ( 0) 0)
|
| [19] |
Shi Weihong, Yu Xiangqian, Chen Hongfei, et al. Design of filter in high voltage unit of particle detector.
Nuclear Electronics & Detection Technology, 2012 , 32 (1) : 59-62.
( 0) 0)
|
 2016, Vol. 23


