2. Department of Structure Engineering of Xuancheng Campus, Hefei University of Technology, Xuancheng 242000, Anhui, China
With record breaking span lengths, long span bridges tend to possess low and closely spaced natural frequencies so that their buffeting responses, which may lead to serious fatigue damage of structural components and connections, instability of the vehicles travelling on bridges and discomfort of pedestrians, are of particular interest.
At present, buffeting response analysis of long span bridges has been predominantly based on stationary assumptions in frequency or time domain[1-6]. Different from traditional boundary layer wind, stochastic processes induced by typhoon or other strong winds cannot be seemed as stationary process, especially when these extreme winds over complex terrain. By using the discrete wavelet method or empirical model decomposition method to characterize the typhoon winds[7-10], the typhoon wind speed can be modeled as the sum of a deterministic time-varying mean wind speed and a stationary fluctuating wind speed. Further, for typhoon over complex terrain, its fluctuating wind speed is non-stationary under the influence of typhoon physical structure, surface roughness and topography for complex terrain[11-12]. Huang et al.[13] also examined the non-stationary wind characteristics of typhoon and thunderstorm downburst by using kernel regression method and proposed the analytical models for them based on field measurements of wind speeds. Since these non-stationary extreme winds induce destructive damage on buildings, bridges and other structures, the non-stationary response of structures under these non-stationary extreme wind loadings has attracted more increasing attention. To bridges, Hu et al.[11] presented a relatively systematic framework on typhoon induced non-stationary buffeting response of long span bridges over complex terrain in frequency domain. Chen[14] presented a general frequency domain approach for quantifying buffeting response of long span bridges subjected to non-stationary winds, in which the random buffeting response was expressed in generalized modal displacements governed by the equations of a frequency-dependent linear time-variant system.
This paper will perform the non-stationary buffeting response analysis of long span suspension bridge under strong wind loading in time domain. Firstly, the method of generating non-stationary fluctuating winds with probabilistic model for non-stationary strong wind fields is presented. Non-stationary wind forces induced by strong winds on bridge deck and tower are then given a brief introduction. Finally, the non-stationary buffeting response of Pulite Suspension Bridge in China is computed by using ANSYS software with probabilistic model for non-stationary strong wind fields obtained from field measurement data during typhoon Dujuan to verify the necessity of considering time-varying mean wind and time-varying variance in buffeting response analysis of long span bridge under strong wind loading.
2 Modeling Method of Non-stationary Fluctuating WindsModeling method for generating stationary fluctuating winds based on the prescribed cross spectral density matrix has been proposed by Deodatis[15] and it can be directly extended to generate the non-stationary fluctuating winds. For a long span bridge, the non-stationary fluctuating winds used for buffeting response analysis in time domain is built up based on the probabilistic model for non-stationary strong wind fields, which contain the following four basic elements: (1) Time-varying mean wind; (2) Mean wind speed profile; (3) Evolutionary spectra; (4) Coherence function.
For the measured wind time history at the single point, the longitudinal wind component U(t) can be divided into the time varying mean wind U(t) which can be determined by using short-time averaging method[11] and zero mean non-stationary fluctuating wind component u(t).
| $U\left( t \right)=\bar{U}\left( t \right)+u\left( t \right)$ | (1) |
Mean wind speed profile for strong winds over complex terrain is different from traditional logarithmic or power law mean wind speed profile. For typhoon over complex terrain, a numerical method for predicting directional typhoon mean wind speed profiles over complex terrain has been recently proposed by Huang and Xu[16]. Nevertheless, in some cases, the traditional power law wind speed profile can be still used to depict the mean wind speed profile of strong winds over complex terrain for easy calculation.
Evolutionary spectra for longitudinal and vertical fluctuating winds Su(ω, t) and Sw(ω, t) are extended from Von Karman spectrum with time-varying mean wind, time-varying variance and time-varying integral length scale, which can be expressed as[17]:
| $\frac{{{S}_{u}}\left( \omega ,t \right)}{\sigma _{u}^{2}\left( t \right)}=\frac{1}{2\pi }\frac{\frac{4{{L}_{u}}\left( t \right)}{\bar{U}\left( t \right)}}{{{\left[ 1+70.8{{\left( \frac{\omega {{L}_{u}}\left( t \right)}{2\pi \bar{U}\left( t \right)} \right)}^{2}} \right]}^{\frac{5}{6}}}}$ | (2) |
| $\frac{{{S}_{w}}\left( \omega ,t \right)}{\sigma _{u}^{2}\left( t \right)}=\frac{1}{2\pi }\frac{\frac{4{{L}_{w}}\left( t \right)}{\bar{U}\left( t \right)}\left[ 1+755{{\left( \frac{\omega {{L}_{w}}\left( t \right)}{2\pi \bar{U}\left( t \right)} \right)}^{2}} \right]}{{{\left[ 1+283{{\left( \frac{\omega {{L}_{u}}\left( t \right)}{2\pi \bar{U}\left( t \right)} \right)}^{2}} \right]}^{\frac{11}{6}}}}$ | (3) |
where ω is the circular frequency; σu2(t) and σw2(t) are the time-varying variances of longitudinal and vertical fluctuating winds, and σut=Iu$\dot{t}$U(t), σwt=Iw$\dot{t}$U(t), Iu(t) and Iw(t) are the time-varying turbulence intensities of longitudinal and vertical fluctuating winds; Lu(t) and Lw(t) are the time-varying longitudinal and vertical integral length scales. Iu(t), Iw(t), Lu(t) and Lw(t) can be all fitted from the measured wind time history.
The exponential coherence function used in stationary wind model[18] can be used directly in the non-stationary wind field model to determine the cross evolutionary spectra, which can be expressed as:
| ${{\gamma }_{pp,ij}}=\exp \left( -\frac{\omega }{2\pi }\frac{{{\left( {{C}_{pz}}^{2}+{{C}_{py}}^{2} \right)}^{\frac{1}{2}}}\left( {{z}_{i}}-{{z}_{j}} \right)}{\frac{1}{2}\left[ \bar{U}\left( {{z}_{i}} \right)+\bar{U}\left( {{z}_{j}} \right) \right]} \right)$ | (4) |
where the symbol p can represent u or w; zi and yi denote the vertical and lateral coordinates; U(zi) and U(zj) are time-invariant mean wind at zi and zj points; Cpz and Cpy are the decay coefficients. This coherence function is time-invariant, which meets the requirement of Priestley's evolutionary power spectra density theory[19].
3 Non-stationary Wind Forces 3.1 Time-varying Mean Wind ForcesThe time-varying drag, lift, and torsional mean wind forces FD(t) FL(t), and M(t) on the bridge per unit length can be expressed as follows:
| ${{F}_{D}}\left( t \right)=\frac{1}{2}\rho \bar{U}{{\left( t \right)}^{2}}B{{G}_{D}}\left( \alpha ,t \right)$ | (5) |
| ${{F}_{L}}\left( t \right)=\frac{1}{2}\rho \bar{U}{{\left( t \right)}^{2}}B{{G}_{L}}\left( \alpha ,t \right)$ | (6) |
| $M\left( t \right)=\frac{1}{2}\rho \bar{U}{{\left( t \right)}^{2}}{{B}^{2}}{{G}_{M}}\left( \alpha ,t \right)$ | (7) |
where ρ is the air density; B is the bridge deck width; CD(α, t), CL(α, t) and CM(α, t) are the drag, lift and torsional aerodynamic force coefficients, which can be normally obtained from wind tunnel tests of the bridge deck section model, and α is the angle of attack of normal incident wind referring to the horizontal plane of the deck segment.
3.2 Non-stationary Buffeting ForcesBy assuming no interaction between self-excited forces and buffeting forces, and by using quasi-steady aerodynamic force coefficients, the non-stationary buffeting forces acting on per unit bridge deck length are expressed as:
| ${{D}_{b}}\left( t \right)=\frac{1}{2}\rho \bar{U}{{\left( t \right)}^{2}}B\left[ 2{{C}_{D}}\frac{u\left( t \right)}{\bar{U}\left( t \right)}+\left( {{{{C}'}}_{D}}-{{C}_{L}} \right)\frac{\omega \left( t \right)}{\bar{U}\left( t \right)} \right]$ | (8) |
| ${{L}_{b}}\left( t \right)=\frac{1}{2}\rho \bar{U}{{\left( t \right)}^{2}}B\left[ 2{{C}_{L}}\frac{u\left( t \right)}{\bar{U}\left( t \right)}+\left( {{{{C}'}}_{L}}+{{C}_{D}} \right)\frac{\omega \left( t \right)}{\bar{U}\left( t \right)} \right]$ | (9) |
| ${{M}_{b}}\left( t \right)=\frac{1}{2}\rho \bar{U}{{\left( t \right)}^{2}}{{B}^{2}}\left[ 2{{C}_{M}}\frac{u\left( t \right)}{\bar{U}\left( t \right)}+{{{{C}'}}_{M}}\frac{\omega \left( t \right)}{\bar{U}\left( t \right)} \right]$ | (10) |
where Db(t), Lb(t) and Mb(t) are the drag, lift and moment non-stationary buffeting forces per unit span length, re spectively; CD′=dCD/dα; CL′=dCL/dα; CM′=dCM/dα; u(t) and w(t) are the horizontal and vertical non-stationary fluctuating winds.
Similarly, the non-stationary buffeting force Fbt(t) for bridge tower can be expressed as:
| ${{F}_{bt}}\left( t \right)=\rho \bar{U}\left( t \right)D{{G}_{D}}u\left( t \right)$ | (11) |
where D is the bridge tower width.
3.3 Non-stationary Self-excited ForcesSince the flutter derivatives associated with the model for self-excited forces developed by Scanlan[2-3] cannot be obtained for the bridge used in this paper with the lack of the wind tunnel test, the model developed by Zeng and Han[20] for self-excited forces by applying two-variable expansion to the quasi-steady aerodynamic force model [21] is used to describe the self-excited forces. Thus, the non-stationary self-excited forces per unit length on a bridge deck under non-stationary fluctuating winds, which can be mathematically described as follows:
| $\begin{align} & {{D}_{se}}\left( t \right)=-\frac{1}{2}\rho \bar{U}\left( t \right)B\left[ \frac{2H}{B}{{C}_{D}}\dot{y}\left( t \right)+\left( \frac{H}{B}{{C}_{D}}^{\prime }-{{C}_{L}} \right)\centerdot \right. \\ & \left. \dot{z}\left( t \right)+\bar{U}\left( t \right)\frac{H}{B}\theta \left( t \right){{C}_{D}}^{\prime }-{{m}_{l}}\dot{\theta }\left( t \right)\left( \frac{H}{B}{{C}_{D}}^{\prime }-{{C}_{L}} \right) \right] \\ \end{align}$ | (12) |
| $\begin{align} & {{L}_{se}}\left( t \right)=-\frac{1}{2}\rho \bar{U}\left( t \right)B\left[ 2{{C}_{L}}\dot{y}\left( t \right)+\left( \frac{H}{B}{{C}_{D}}+{{C}_{L}}^{\prime } \right)\centerdot \right. \\ & \left. \dot{z}\left( t \right)+\bar{U}\left( t \right)\frac{H}{B}\theta \left( t \right){{C}_{L}}^{\prime }-{{m}_{l}}\dot{\theta }\left( t \right)\left( \frac{H}{B}{{C}_{D}}-{{C}_{L}}^{\prime } \right) \right] \\ \end{align}$ | (13) |
| $\begin{align} & {{M}_{se}}\left( t \right)=-\frac{1}{2}\rho \bar{U}\left( t \right)B\left[ 2B{{C}_{M}} \right.\dot{y}\left( t \right)+B{{C}_{M}}^{\prime }\dot{z}\left( t \right)+ \\ & \left. \bar{U}\left( t \right)B\theta \left( t \right){{C}_{M}}^{\prime }-{{m}_{l}}\dot{\theta }\left( t \right)B{{C}_{M}}^{\prime } \right] \\ \end{align}$ | (14) |
where Dse(t), Lse(t) and Mse(t) are drag, lift and moment non-stationary self-excited forces for bridge deck; H is the deck height of bridge; $\dot{y}$(t), $\dot{z}$(t) and $\dot{\theta }$(t) are the velocities in lateral, vertical and torsional directions for bridge deck; ml is the turning radius for bridge deck, and equals to B/4.
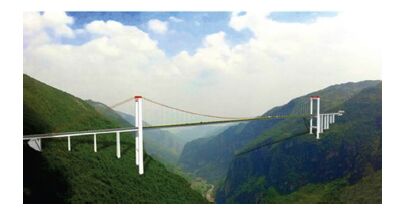
4 Case Study 4.1 Pulite Suspension BridgeFig. 1 shows Pulite Suspension Bridge with a main span 628 m in China. A three dimensional finite element model of the bridge has been built up by using the ANSYS software.
|
Figure 1 Pulite Suspension Bridge in China |
Since the bridge deck has a main span of 628 m and the two side bridge towers are both with single column over 150 m high, the geometric non-linearity due to the tension forces in the cables and axial forces in the bridge deck and towers is considered in the modal analysis. Natural frequencies and model shapes of the bridge can be obtained by using the following equations.
| $\left| \left[ K \right] \right.-\left. {{\omega }^{2}}\left[ M \right] \right|=0$ | (15) |
| $\left\{ \left[ K \right]-{{\omega }_{i}}^{2}\left[ M \right] \right\}\left\{ {{\Phi }_{i}} \right\}=0$ | (16) |
where [K] and [M] are the stiffness and mass matrix of the bridge as a whole; ω is the circular frequency; {Φi} is the ith mode shape corresponding to the ith circular natural frequency ωi. It is noted that the stiffness matrix [K] is a combination of the structural stiffness matrix and the geometric stiffness matrix whereas the geometric stiffness matrix is obtained through a static analysis of the 3-D finite element model of the bridge. Based on the structural dynamics analysis method and modal analysis theory, the first 60 natural frequencies and model shapes are computed and used for the non-stationary buffeting response analysis.
The structural damping matrix [C] is obtained by using Rayleigh damping, which can be expressed as:
| $\left[ C \right]=\alpha \left[ M \right]+\beta \left[ K \right]$ | (17) |
| $\alpha =2\frac{{{\omega }_{i}}{{\omega }_{j}}}{{{\omega }_{j}}^{2}-{{\omega }_{i}}^{2}}\left( {{\omega }_{j}}{{\zeta }_{i}}-{{\omega }_{i}}{{\zeta }_{j}} \right)$ | (18) |
| $\beta =2\frac{{{\omega }_{i}}{{\omega }_{j}}}{{{\omega }_{j}}^{2}-{{\omega }_{i}}^{2}}\left( -\frac{{{\zeta }_{i}}}{{{\omega }_{j}}}+\frac{{{\zeta }_{j}}}{{{\omega }_{i}}} \right)$ | (19) |
where α and β are Rayleigh damping coefficients; ζ is damping ratio; for Pulite Suspension Bridge, the damping ratio ζ is set as 0.005. Values of Rayleigh damping coefficients α and β are 0.000 93 and 0.019 23, which are obtained by using single modal method.
Wind forces are supposed to act on the bridge deck and tower at the nodes, which is shown in Fig. 2. Only the buffeting response of Pulite Suspension Bridge under zero attack angle is considered in this paper. The drag, lift, torsional aerodynamic force coefficients CD, CL, CM for zero attack angle are 0.588 8, -0.257 1 and 0.004 4, respectively.

|
Figure 2 Node distribution of the bridge |
4.2 Probabilistic Model for Non-stationary Strong Wind Fields
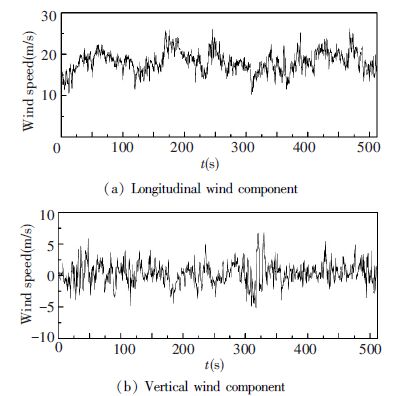
The measured longitudinal wind speed time history U(t) and vertical wind speed time history w(t) as shown in Fig. 3 with duration time 512 s during typhoon Dujuan has been obtained from the site field measurement system, which is used to establish the probabilistic model for non-stationary strong wind fields[22].
|
Figure 3 Measured wind time history during typhoon Dujuan |
The time-varying mean wind is estimated by using short-time averaging method with averaging time 600 s and fitted with least square method. The fitted time-varying mean wind can be expressed as:
| $\bar{U}\left( t \right)=18.43+\left[ 3.2t+8.7+81sin\left( 0.021t+1.73 \right) \right]\times {{10}^{-3}}$ | (20) |
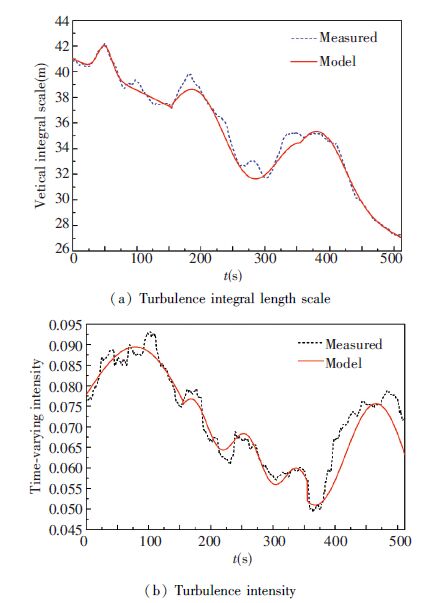
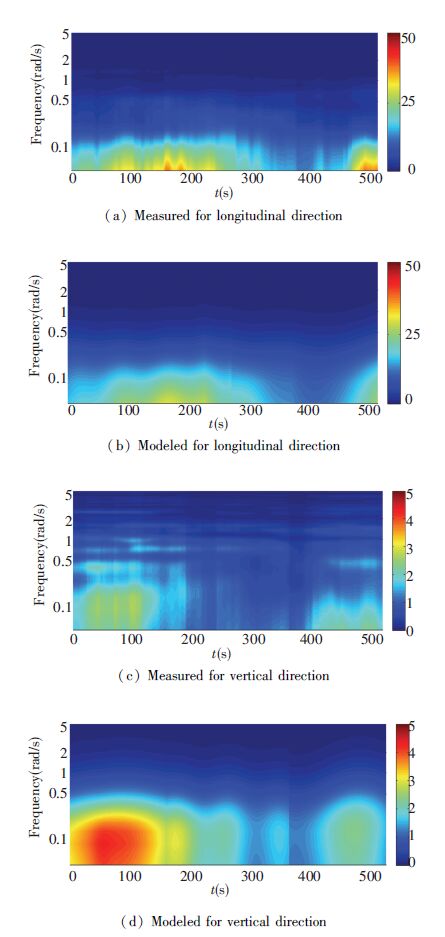
To obtain the evolutionary spectra for longitudinal and vertical fluctuating winds, time-varying integral length scales and turbulence intensities are determined by using formula given by Hu et al. (2013) , which are denoted as dashed line in Figs. 4 and 5. Then, the fitted time-varying integral length scales and turbulence intensities can be obtained by using least square method denoted as solid line in Figs. 4 and 5. Then, the modelled evolutionary spectra for longitudinal and vertical fluctuating winds can be obtained. The comparisons between measured and modelled evolutionary spectra for longitudinal and vertical fluctuating winds are shown in Fig. 6. It can be known that the modeled evolutionary spectra for longitudinal and vertical fluctuating winds basically agree well with the corresponding measured evolutionary spectra.

|
Figure 4 Turbulence integral length scale and turbulence intensity for longitudinal fluctuating winds |
|
Figure 5 Turbulence integral length scale and turbulence intensity for vertical fluctuating winds |
|
Figure 6 Evolutionary spectra comparison of longitudinal and vertical fluctuating winds |
For the coherence function given by Eq.(4) , the decay coefficients Cpy and Cpz are taken as 8.3 and 6.4 for p=u, and 3.8 and 4.8 for p=w.
4.3 Generating Non-stationary Fluctuating WindsSince time-varying mean wind and time-varying variance are two basic non-stationary factors in generating non-stationary fluctuating winds, different combinations of them have different effects on the non-stationary buffeting response of long span suspension bridge. Thus, in this study, all four different combinations of them are considered, including: 1) time-varying mean wind and time-varying variance, defined as case 1; 2) time-invariant mean wind and time-varying variance, defined as case 2; 3) time-varying mean wind and time-invariant variance, defined as case 3; 4) time-invariant mean wind and time-invariant variance, defined as case 4. Time-invariant mean wind uses the mean value of time-varying mean wind within the whole duration time. Since time-varying variance is correlated with time-varying integral length scale and turbulence intensity, time-invariant variance is represented by the mean value of time-varying integral length scale and turbulence intensity.
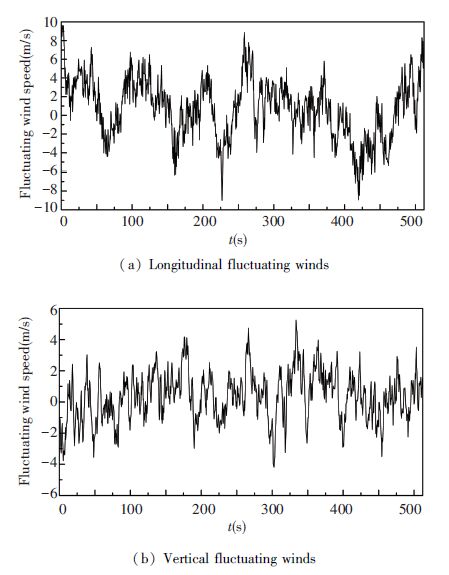
By using the probabilistic model for non-stationary strong wind fields obtained from field measurement data shown in section 4.2 and theory for generating non-stationary fluctuating winds, non-stationary fluctuating winds for all four cases can be generated. Fig. 7 displays the generated non-stationary longitudinal and vertical fluctuating winds acting on the middle points of main span for case 1.
|
Figure 7 Non-stationary fluctuating winds acting on the middle point of main span for case 1 |
4.4 Non-stationary Buffeting Response Analysis
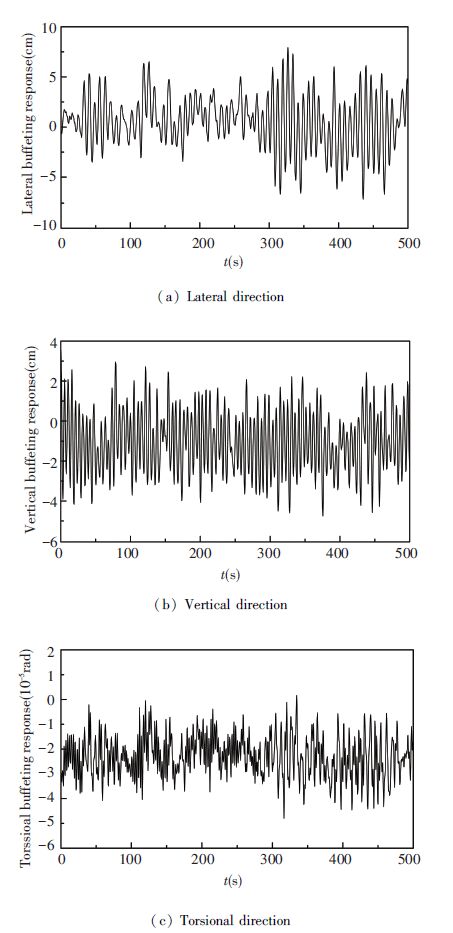
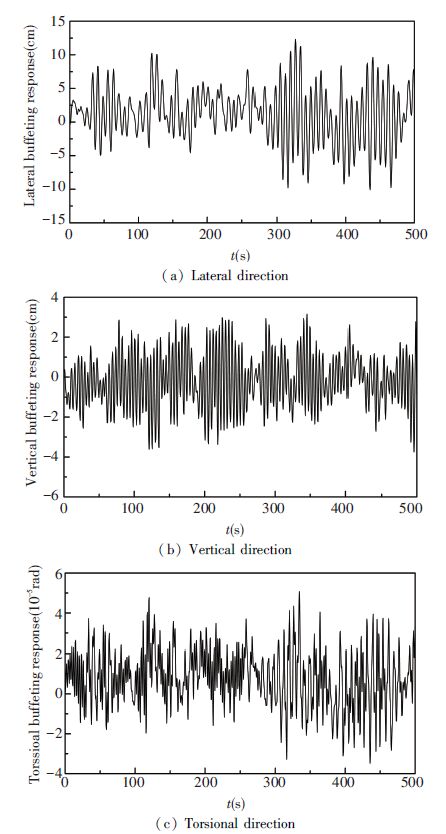
Non-stationary buffeting responses for all four cases in time domain are computed by using ANSYS software. The non-stationary buffeting response varying with time for case 1 at the quarter and middle points of main span in lateral, vertical and torsional directions are shown in Figs. 8 and 9. It can be seen that the buffeting response varies around a certain value in all three directions at the quarter and middle points of main span. In addition, in the quarter point of main span, only the mean value of buffeting response in lateral direction are zero, and mean values of buffeting response in other two directions are both under zero. In the middle point of main span, apart from the mean value of buffeting response in torsional direction has a value slightly greater than zero, mean values of buffeting response in other two directions are both near zero. On the whole, the fluctuating of buffeting response shows a high non-stationary during the whole duration time. In addition, similar fluctuating of buffeting response can be also found in other three cases.
|
Figure 8 Non-stationary buffeting response acting on the quarter point of main span for case 1 |
|
Figure 9 Non-stationary buffeting response acting on the middle point of main span for case 1 |
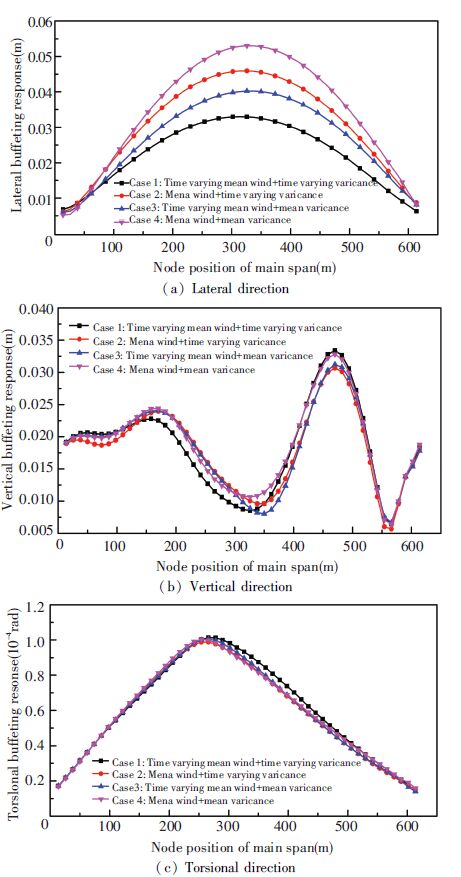
To observe the influence of time-varying mean wind and time-varying variance to buffeting response of long span suspension bridge, the RMS values of buffeting response in lateral, vertical and torsional directions for all four cases are computed and shown in Fig. 10. It can be known that, the maximum RMS values of buffeting response for case 1 in lateral, vertical and torsional directions are 0.052 8 m, 0.032 8 m and 9.842×10⁻⁵ rad, respectively. The effect of time-varying mean wind on buffeting response of long span suspension bridge is reflected by the comparison of cases 1 and 2. The effect of time-varying variance on buffeting response of long span suspension bridge is reflected by the comparison of cases 1 and 4. Through comparison, it can be known that, the time-varying mean wind and time-varying variance has relatively small influence to the buffeting response in vertical and torsional directions and the influence of time-varying mean wind and time-varying variance to buffeting response mainly reflects in lateral direction. The time-varying mean wind has a greater influence on buffeting response than the time-varying variance in lateral direction. In addition, for case 4, if without considering time-varying mean wind and time-varying variance, or just considering the traditional stationary fluctuating winds, an over underestimation of buffeting response of long span suspension bridge may occur when compared with results obtained form case 1. The maximum RMS values of buffeting response for case 4 in lateral, vertical and torsional directions are 0.033 m, 0.033 4 m and 9.736×10⁻⁵ rad, respectively. Therefore, it can be concluded that the time-varying mean wind and time-varying variance should be all considered in buffeting response analysis of long span suspension bridge under strong wind loading.
|
Figure 10 RMS buffeting response along main span |
5 Conclusions
Non-stationary buffeting response of long span suspension bridge in time domain has been conducted based on the non-stationary fluctuating winds generated with probabilistic model for non-stationary strong wind fields and has been applied to Pulite Suspension Bridge in China. Non-stationary buffeting responses of this bridge for all four cases have been computed and the effects of time-varying mean wind and time-varying variance have been also discussed. The results show that it is essential to consider the time-varying mean wind and time-varying variance in non-stationary buffeting response analysis of long span suspension bridge under strong wind loading, although the influence of time-varying mean wind and variance is relatively small in vertical and torsional directions in present study. The necessity of considering the non-stationary buffeting response of long span suspension bridge under strong wind loading is further confirmed.
| [1] |
Davenport A G. Buffeting of a suspension bridge by storm winds.
Journal of Structural Division, 1962 , 88 (ST3) : 233-268.
( 0) 0)
|
| [2] |
Scanlan R H, Gade R H. Motion of suspended bridge spans under gusty wind.
Journal of Structural Division, 1977 , 103 (ST9) : 1867-1883.
( 0) 0)
|
| [3] |
Scanlan R H. The action of flexible bridges under wind, II: Buffeting theory.
Journal of Sound and Vibration, 1978 , 60 (2) : 201-211.
DOI:10.1016/S0022-460X(78)80029-7 ( 0) 0)
|
| [4] |
Jain A, Jones N P, Scanlan R H. Coupled flutter and buffeting analysis of long-span bridges.
Journal of Structural Engineering, 1996 , 122 (7) : 716-725.
DOI:10.1061/(ASCE)0733-9445(1996)122:7(716) ( 0) 0)
|
| [5] |
Katshuchi H, Jones N P, Scanlan R H. Multimode coupled flutter and buffeting analysis of the Akashi-Kaikyo bridge.
Journal of Structural Engineering, 1999 , 125 (1) : 60-70.
DOI:10.1061/(ASCE)0733-9445(1999)125:1(60) ( 0) 0)
|
| [6] |
Xu Y L, Sun D K, Ko J M, et al. Buffeting analysis of long span bridges: A new algorithm.
Journal of Computers and Structures, 1998 , 68 (4) : 303-313.
DOI:10.1016/S0045-7949(98)00072-8 ( 0) 0)
|
| [7] |
Wang L, Kareem A. Modeling of non-stationary winds in gust-fronts. Proceedings of 9th ASCE Joint Specialty Conference on Probabilistic Mechanics and Structural Reliability.
Albuquerque, New Mexico:PMC2004, 2004 .
( 0) 0)
|
| [8] |
Wang L, Kareem A. Modeling and simulation of transient winds in downbursts/hurricanes.
Proceedings of the 10th Americas Conference on Wind Engineering (CD-ROM). Baton Rouge, LA, 2005 : 1-12.
( 0) 0)
|
| [9] |
Chen J, Xu Y L. On modelling of typhoon-induced non-stationary wind speed for tall buildings.
Journal of the Structural Design of Tall and Special Buildings, 2004 , 13 (2) : 145-163.
DOI:10.1002/(ISSN)1541-7808 ( 0) 0)
|
| [10] |
Chen J, Hui M C H, Xu Y L. A comparative study of stationary and non-stationary wind models using field measurements.
Journal of Boundary Layer Meteorology, 2007 , 122 (1) : 105-121.
DOI:10.1007/s10546-006-9085-1 ( 0) 0)
|
| [11] |
Hu L, Xu Y L, Huang W F. Typhoon-induced non-stationary buffeting response of long-span bridges in complex terrain.
Journal of Engineering Structures, 2013 , 57 : 406-415.
DOI:10.1016/j.engstruct.2013.09.044 ( 0) 0)
|
| [12] |
Hu L, Xu Y L. Extreme value of typhoon-induced non-stationary buffeting response of long-span bridges.
Journal of Probabilistic Engineering Mechanics, 2014 , 36 : 19-27.
DOI:10.1016/j.probengmech.2014.02.002 ( 0) 0)
|
| [13] |
Huang G Q, Zhao H T, Xu Y L, et al. Spectrum models for nonstationary extreme winds.
Journal of Structural Engineering, 2015 .
DOI:10.1061/(ASCE)ST.1943-541X.0001257 ( 0) 0)
|
| [14] |
Chen X Z. Analysis of multimode coupled buffeting response of long-span bridges to nonstationary winds with force parameters from stationary wind.
Journal of Structural Engineering, 2014 , 141 (4) .
DOI:10.1061/(ASCE)ST.1943-541X.0001078 ( 0) 0)
|
| [15] |
Deodatis G. Simulation of ergodic multivariate stochastic processes.
Journal of Engineering Mechanics, 1996 , 122 (8) : 778-787.
DOI:10.1061/(ASCE)0733-9399(1996)122:8(778) ( 0) 0)
|
| [16] |
Huang W F, Xu Y L. Prediction of typhoon design wind speed and profile over complex terrain.
Journal of Structural Engineering and Mechanics, 2013 , 45 (1) : 1-18.
DOI:10.12989/sem.2013.45.1.001 ( 0) 0)
|
| [17] |
Simiu E, Scanlan R H.
Wind Effects on Structures. John Wiley & Sons, 1996 .
( 0) 0)
|
| [18] |
Solari G, Piccardo G. Probabilistic 3-D turbulence modeling for gust buffeting of structures.
Journal of Probabilistic Engineering Mechanics, 2001 , 16 : 73-86.
DOI:10.1016/S0266-8920(00)00010-2 ( 0) 0)
|
| [19] |
Priestley M B. Evolutionary spectra and non-stationary processes.
Journal of the Royal Statistical Society, Series B (Methodological), 1965 , 27 (2) : 204-237.
( 0) 0)
|
| [20] |
Zeng X W, Han D J. Time domain analysis of wind-induced buffet on long-span bridges and implementation of analysis in ANSYS.
Bridge Construction, 2004 , 1 : 9-12.
( 0) 0)
|
| [21] |
Miyata T, Yamada H, Boonyapinyo V, et al. Analytical investigation on the response of a very long suspension bridge under gust wind. Proceedings of Ninth International Conference on Wind Engineering.
New Delhi, India, 1995 : 1006-1017.
( 0) 0)
|
| [22] |
Chen J, Hui M C H, Xu Y L. A comparative study of stationary and non-stationary wind models using field measurements.
Boundary Layer Meteorology, 2007 , 122 : 105-121.
DOI:10.1007/s10546-006-9085-1 ( 0) 0)
|
 2016, Vol. 23


