2. School of Civil Engineering and Architecture, Southwest University of Science and Technology, Mianyang 621010, Sichuan, China
Fatigue failure of steel member originating from corrosion pits is an important issue for durability inspector of steel structure, which often leads to serious consequences[1-2]. After decades of works with the aim of understanding the basic phenomena and predicting damage evolution, the necessity of an applicable methodology was still a contemporary issue. Some studies[3-4] had found that the pits can signally grow under the condition of plastic deformation. Under the repeated service loading, the pit, when exceeds a critical size, can initiate a fatigue crack. For the evaluation of crack growth due to pitting, several authors[5-8] had done in terms of linear elastic fracture mechanics (LEFM). It was assumed that pits can be treated as effective cracks, which allow the determination of threshold stress intensity factor range, ΔKth, for crack growth under cyclic loading. With this estimation, the crack growth can be estimated for pitting components according to the pit size. Kitagawa and Takahashi[9-10] provided an extension of LEFM to small cracks by using the threshold stress intensity factor; and it was possible to determine the threshold for small crack growth[11]. Thus, the applicability to small defects (as corrosion pits) allows the description of the pit-to-crack transition in terms of fracture mechanics.
Moreover, although safety factor in initial design may delay the occurrence of the fatigue problems, the priori negligence of structural integrity analysis leads to a significant overestimation of the damage tolerance ability. Therefore, the crack nucleated from corrosion pits will make the structural members suddenly fracture much sooner than the designed service life[12-15]. And it is difficult to find the obvious plastic deformation before fracturing[16]. So it is significant to establish fatigue model steel structure.
In this study, the material (Q235 steel) was used in corrosion test under the atmospheric environment. Then, for researching the effect on the crack growth, the fatigue crack growth (FCGR) measurements in the near threshold regime was performed[17]. FCGR measurements allowed the defining threshold stress intensity factors within a reasonable time.
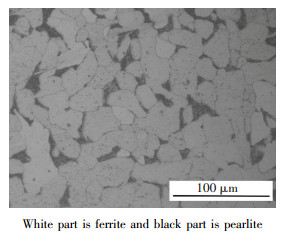
2 Experimental Procedures 2.1 MaterialThe material used in this study was a Q235 steel, which is a normalized 0.25% low-carbon steel, extensively used in industrial and civil buildings: the matrix consists of a ferritic-pearlitic microstructure with a 20-40 μm ferrite grain size, as shown in Fig. 1[18]; its basic chemical composition is shown in Table 1. All specimens were cut out from a same steel plate.
|
Figure 1 Microstructure of Q235 steel material |
| Table 1 Chemical composition of Q235 steel |
2.2 Experimental Conditions
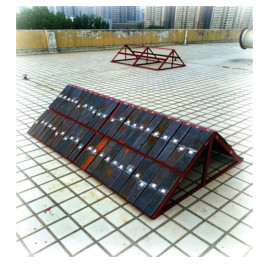
The rectangular specimen (Fig. 2) with 280 mm in length, 50 mm in width and 8 mm in thickness was used for corroding. The specimens were respectively exposed for 0.5, 1, 2 and 4 years in the atmospheric environment (latitude 39°45' N, longitude 108°56′E). The test setup of the corrosion experiment is shown in Fig. 2. During the experimental period, the monthly temperature (T), relative humidity (HR), annual precipitation (P), and rainwater acidity (pH) values were measured to identify the atmospheric corrosive environment (Table 2)[18].
|
Figure 2 Setup of atmospheric exposure test |
| Table 2 Atmospheric corrosion conditions on the test site |
2.3 Corroded Specimen Measurements
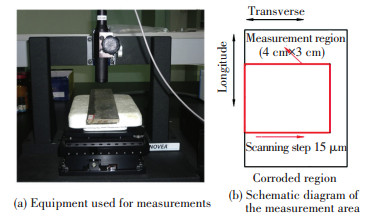
After the atmospheric exposure tests, the corroded specimens were immersed in hydrochloric acid solution (12% by volume) and methenamine solution (0.5% by volume) for 25-30 min for removing the rust; then, cleaned with water and neutralized with sodium chloride solution; finally, cleaned again with water, and dried in oven. The corrosion morphology of the specimens was measured using a noncontact PS50 3D profiler after the removal of rust from each aged corrosion specimen[19]. The vertical and horizontal resolutions of the profiler were 280 nm and 8 μm, respectively. The equipment used for 3D surface profile measurements is shown in Fig. 3(a). Each specimen had one measurement region of 40 mm×30 mm (along the directions of transverse and longitude, respectively) approximately arranging at the center of specimen, and the scanning step was set to 15 μm[19]. The elementary diagram of the measurement area is shown in Fig. 3(b).
|
Figure 3 Laser focus measurement of the atmospheric exposure test specimen |
The pit depths were measured by focusing on the specimen surface first at the lip of the pit and then at the bottom of the pit, the difference of the focuses handles reading can be recognized as the pit depth. The pits were generally elongated in the sheet rolling direction; therefore, the dimension along the rolling direction was designated as the pit length and that along the transverse direction as the width.
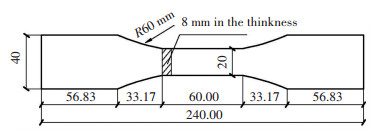
2.4 Fatigue TestThe dog-bone specimen with a size based on GB/T 3075-2008[20] (as shown in Fig. 4) was used for fatigue test. One thing to note here is that,for reducing the fatigue test error, the specimen for corrosion needs to be longer and wider. All specimens should be machined with no residual stress, surface damage, and deformation. To avoid fatigue crack initiation, the side surface was polished without groove and scratch, and the surface smoothness should be no less than Δ9.
|
Figure 4 Details of specimen for fatigue studies |
All specimens were tested according to GB/T6398-2000[21] in the environmental test chamber, humidity kept from 20% HR up to 85% HR. All specimens were tested in Hydraulic Servo Universal Fatigue Testing Machine (NO. HT-9711) operating at 15 Hz. The loading amplitude was loaded in the form of sinusoid, the maximum stress was 414 MPa, and the stress ratio R was 0.5.
In addition, the AFGROW software was used for the numerical fatigue testing of the corroded specimen. It is well known that the stress intensity factors are computed for the particular crack geometry, dimensions and stress condition[22-24]; the software can derive the stress intensity factor solutions by LEFM. As a consequence, the crack growth rate (dc/dN) can be acquired by the value of dc/dN versus stress intensity factor curve. In AFGROW, when the crack growth got calculated and quickly added to the original crack length, the process will repeat the above process until the crack reaches a critical size. At the moment, the failure can be defined to occur, for example, the stress intensity factor equals to the fracture toughness of the specimen. Uses of this software in other cases will be described in a recent review[19].
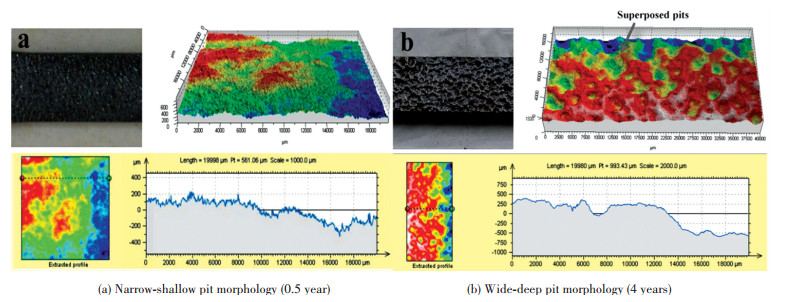
3 Experimental Results and Discussions 3.1 Pitting CharacterizationFig. 5 clearly shows the surface morphology of corroded specimens. Two types of morphology with exposure lapse can be observed from different specimens with different exposure time, i.e., 0.5 year and 4 years, slight pits densely distributed on the surface at the initial stage of corrosion; however, with the passing of corrosion, the pits expand rapidly and join together, at this moment, the corrosion damage (wide and shallow pits) tends to be corrosive pitting.
|
Figure 5 Types of corrosion morphology |
From Fig. 5, it can be seen that, the growth of pit not only independently develops based on the electrochemistry but it also grew by link up of adjacent pits. Especially in Fig. 5(b), it can be clearly observed that the superimposed pits linked to from single pit: pits usually grow up with the beginning of narrow-shallow shape (as shown in Fig. 5(a)); with the overlap effect, the adjacent pits link to the macro-flaw.
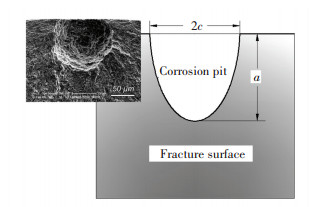
In addition, the shape of pit is mostly approximated as semi-circular or semi-elliptical as shown in Fig. 6. Therefore, it can be considered that the pit dimensions consist mainly of the surface length (2c) and the pitting depth (a).
|
Figure 6 Corrosion pit on steel surface and schematic pit size |
There are many studies that have found both of the dimensions and the spatial relationships between adjacent pits are important parameters of corroded surface, which can be obtained by using the method as follows.
The corrosion depth, h(xi, yi), of every point on corroded surface is of regional characteristics. At the scope of the same pit, the value of h(xi, yi) increases gradually outward from the lowest point of the pit.
1) Eight radials with the endpoint, the lowest point of pit, are set up and spreaded out from center to around as shown in Fig. 7[25].
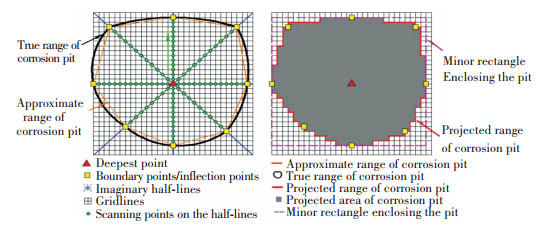
|
Figure 7 Calculation principle of pit dimensions |
2) The lowest point is individually connected with each scanning spots on one of the radials. The slopes (k) of the lines are calculated, respectively.
3) When the slop ki>ki+1, the scanning spot corresponding to ki+1 can be considered as the boundary point of the pit. Then it can be determined the eight boundary points from the radials. The proximity between each boundary point and the lowest point can be also clearly calculated.
4) It can be obtained surface length (2c), pitting depth (a) and margin distance, S, between the adjacent pits as shown in Table 3.
| Table 3 Pit dimensions in bare, Q235 steel specimen exposed to atmospheric environment |
Here it can be seen that, the pit dimensions (a and c) increase evidently with corrosion exposure; the increasing is obeyed to power exponent law: the pit dimensions have a marked increasing first and then the degree of increasing decreases gradually. Furthermore, both of cmax/amax and cave/aave generally increases with the increasing exposure, of which the changes are regular. Therefore, the value of c/a can be estimated by using the condition expressed as follows:
For the maximum value of the pit dimensions,
| $ \left\{ \begin{array}{l} c/a = 0.3,{\rm{the}}\;{\rm{exposure}}\;{\rm{time}}\;{\rm{is}}\;{\rm{0}}{\rm{.5}}\;{\rm{year}}\\ c/a = 1.0,{\rm{the}}\;{\rm{exposure}}\;{\rm{time}}\;{\rm{is}}\;{\rm{1}}\;{\rm{year}}\\ c/a = 1.2,{\rm{the}}\;{\rm{exposure}}\;{\rm{time}}\;{\rm{is}}\;{\rm{2}}\;{\rm{year}}\\ c/a = 1.4,{\rm{the}}\;{\rm{exposure}}\;{\rm{time}}\;{\rm{is}}\;{\rm{4}}\;{\rm{year}} \end{array} \right. $ | (1) |
For the average value of the pit dimensions,
| $ \left\{ \begin{array}{l} c/a = 0.5,{\rm{the}}\;{\rm{exposure}}\;{\rm{time}}\;{\rm{is}}\;{\rm{0}}{\rm{.5}}\;{\rm{year}}\\ c/a = 1.7,{\rm{the}}\;{\rm{exposure}}\;{\rm{time}}\;{\rm{is}}\;{\rm{1}}\;{\rm{year}}\\ c/a = 1.1,{\rm{the}}\;{\rm{exposure}}\;{\rm{time}}\;{\rm{is}}\;{\rm{2}}\;{\rm{year}}\\ c/a = 1.1,{\rm{the}}\;{\rm{exposure}}\;{\rm{time}}\;{\rm{is}}\;{\rm{4}}\;{\rm{year}} \end{array} \right. $ | (2) |
Moreover, the margin distance, S, decreases with the increasing exposure since the impact from effect of pit growth. The value of S is closely related to the dimensions of corresponding pits. The longer the exposure time is, the larger the scale of the pit is, and the larger the scale of the pit is, the smaller the margin distance is.
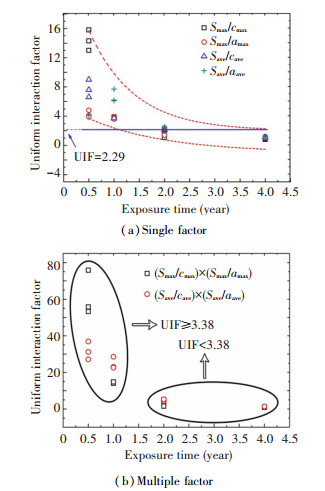
As is well known, the failure crack was frequently nucleated from more interacting pits[3], which was mainly determines by S[26]. For the spatial characteristic of the pits, Smax decreases with the increasing of the pits dimensions; Save increases firstly and then decreases. The change law of average value (Save) can be explained that: at the early age of corrosion, the pits occur in the form of cluster at locality. Therefore, the average value is smaller. With the increasing exposure, Save increases with the extensive and random occurring of more pits. Until when the pits overlap, Save decreases.
Leek and Howard proposed a model to assess the interaction between adjacent pits[26], which can play a very important role on understanding the mechanism of crack growth. For pits treated as being coplanar, when
| $ \left( {S/{c_{{\rm{ave}}}}} \right) \times \left( {S/{a_{{\rm{ave}}}}} \right) > 3.38\;{\rm{and}}\;S/{a_{{\rm{ave}}}} \ge 2.29 $ | (3) |
the pits as local flaw are considered to be independent. In this study, S will be studied by the maximum and the average value of the adjacent pits, respectively. Fig. 8 shows the changing of the spatial position factor (SPF). The changing of SPF varied from the different factor, but the changed trend is apparent: the SPF continually decreases with increasing exposure. In addition, it can be seen from Figs. 8(a) and (b), the exposure with 2 years is a critical time for both of single factor (Smax/cmax, Smax/amax, Save/cave or Save/aave) and multiple factor ((Smax/cmax)×(Smax/amax) or (Save/cave)×(Save/cave)): when the corrosion time is less than 2 years, the initiation of fatigue crack is caused by the effect of a single pit; when more than 2 years, fatigue failure of the corroded specimens can often occur owing to the coalescence of simultaneous cracks nucleating from more interacting pits.
|
Figure 8 Changing of UIF with single factor and multiple factor |
While the interaction of abject pits cannot be neglected, the equivalent pit is assumed with dimensions given by Ref.[26]:
| $ \left\{ \begin{array}{l} {c_{{\rm{new}}}} = {c_1} + {c_2} + S\\ {a_{{\rm{new}}}} = \max {\left\{ {\frac{{{a_i}}}{{\sqrt {1 - {{\left( {1 - c/{c_{{\rm{new}}}}} \right)}^2}} }}} \right\}_{i = 1,2}} \end{array} \right. $ | (4) |
Although the common model for single flaw has been widely used in studying the fatigue failure of corroded specimen, it is not suitable for predicting the fatigue life of the corroded specimen (do not satisfy the requirements of Eq.(3)). Therefore, when the exposure time is more than 2 years, the fatigue life should be calculated by using the model with single flaw; when more than 2 years, the fatigue life should be calculated by using the model with the multiple flaw interaction.
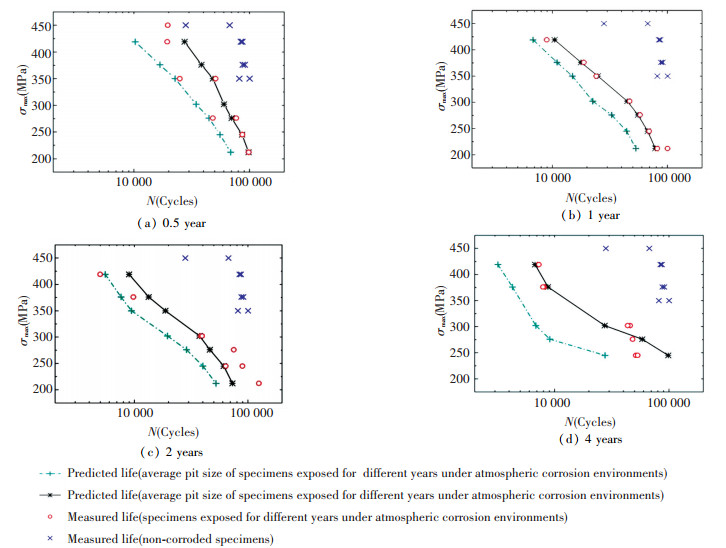
3.2 Fatigue Test Results and DiscussionsThe fatigue lives of the corroded specimens calculated from the AFGROW model are shown as the solid lines in Fig. 9. The results of the constant amplitude fatigue tests conducted on non-corroded specimens and corroded specimens are also plotted in Fig. 9.
|
Figure 9 Predicted and measured fatigue lives of Q235 steel specimens exposed for different years under atmospheric corrosion environments |
Fatigue life predictions using both the maximum and average measured pit dimension as the initial flaw size are shown in Figs. 9(a) and (b), respectively. Life predictions based on UIF of pit spatial conditions are shown in Figs. 9(c) and (d), respectively. It can be found that N decreases with increasing of the maximum stress (σmax) and the exposure time. It is noted that there is still a decrease of N for non-corroded specimens compared to the corroded ones. It can be also readily observed that the fatigue life predictions using the model with the average value whether from the single flaw size or the factors of UIF can be generally considered as in good agreement with measured lives; the fatigue life predictions using the maximum level as the initial flaw condition are lower than the measured lives. This means that the distribution and size of pits can provide a very significant index near the average level. The average level has a better opportunity to initiate cracks.
Thus, the mechanisms of fatigue life corresponding to different spatial conditions of pits require distinct calculation models by using the inverse analysis. Especially, the multiple pits interaction based on the average level of pit dimension has a very significant effect on the short crack growth.
3.3 Model of Coalescence between Adjacent Pits 3.3.1 Pit-to-crack transitionThe requirement using the spatial conditions to assess the multiple pits interaction is given in Eq.(3). In order to clearly understand the influences of the multiple pits interaction on the crack growth, it should be started with the internal reasons in micromechanics.
As is well known, the growth rate of a fracture source is influenced by the spatial conditions of adjacent pits, and this influence is reflected in the calculation of stress intensity factor. During the process of crack growth, the interaction between the adjacent pits should not be ignored even if the pits tips do not contact together (as shown in Figs. 10(a) and (b)). Under the action of load, when the pit touches with the others (as shown in Fig. 10(c)), a new single crack without being necessary a semi-elliptical shape immediately replaces them and then gradually develops to a semi-elliptical surface crack: it is the first step of coalescence. After that, the growth of this crack succeeds until it also interacts with a new one and so on.

|
Figure 10 Typical fatigue crack propagation behavior |
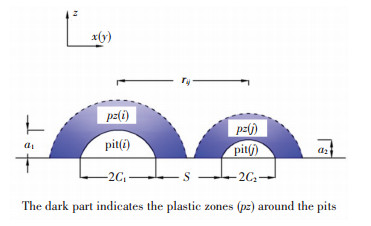
It can be explained that the coalescence is occurring when the crack tips plastic zones of different pits developed to touch each other (as shown in Fig. 11).
|
Figure 11 Coalescence criteria conventions |
If, for instance, one of the pits is entirely on one side of the other one, the condition of coalescence can be expressed as follows[27]:
| $ {r_{ij}} \le pz\left( i \right) + pz\left( j \right) $ | (5) |
| $ \begin{array}{l} pz = \frac{1}{{\rm{\pi }}}{\left( {\frac{{{K_{\max }}}}{{pr}}} \right)^2}\\ {r_{ij}} = \sqrt {{{\left( {{x_j} - {x_i}} \right)}^2} + {{\left( {{z_j} - {z_i}} \right)}^2}} \end{array} $ | (6) |
| $ {r_{ij}} = \sqrt {{{\left( {{y_j} - {y_i}} \right)}^2} + {{\left( {{z_j} - {z_i}} \right)}^2}} $ | (7) |
At this moment, the multiple pits interaction can be considered from using a uniform interaction factor (γ). The value of γ is concerned with the spatial characteristics of pits and determined from Table 4.
| Table 4 Conditions giving the value of the uniform interaction factorto be used in calculating the dimensions of the equivalent crack[26] |
When either conditions of Eq.(3) are not satisfied, a uniform interaction factor, γ, is given in Table 4 and must be used in the calculations of the fatigue crack growth.
3.3.2 Condition of crack propagationIt is well known that there is a functional relationship between the crack growth rate (dc/dN) and the stress intensity factor range (ΔK). Commonly, the relationship is given by:
| $ \frac{{{\rm{d}}c}}{{{\rm{d}}N}} = C{\left( {\Delta K} \right)^m} $ | (8) |
where C and m indicate the material coefficient of Paris' law.
A phenomenon called effect of crack closure was observed in experiments[28], which can be kept by the crack under the action of cyclic stress. This means that the control factor of dc/dN may not be nominal value of ΔK but the effective value of ΔK (ΔKeff)[29]. Moreover, ΔKeff is often obtained in the way of modifying the nominal value[30].
| $ \Delta {K_{{\rm{eff}}}} = \Delta K \cdot \left( {\frac{{1 - q}}{{1 - R}}} \right) $ | (9) |
where R indicates stress ratio; q indicates variable with respect to R[30], i.e.,
Therefore, Paris's law needs to be modified by using considering the effect of crack closure, which can be given as:
| $ \frac{{{\rm{d}}c}}{{{\rm{d}}N}} = C{\left( {\Delta {K_{{\rm{eff}}}}} \right)^m} $ | (10) |
The condition for propagation of a crack nucleated from a pit (i) is that ΔKeff at the bottom of this pit is higher than the corresponding short crack effective stress intensity threshold ΔKeff, th, pits[29, 31].
If ΔKeff≤ΔKeff, th, pits then no propagation.
The short crack effective stress intensity threshold ΔKeff, th, pits is calculated using Bernd M.'s model[32]:
| $ \Delta {K_{{\rm{eff,th,pits}}}} = \frac{{\Delta {K_{{\rm{eff,th}}}}}}{{\sqrt {1 + \frac{{{c_0}}}{c}} }} $ | (11) |
where ΔKeff, th is the threshold effective stress intensity factor range obtained from corrosion pits; c0 is the intrinsic crack length, which can be given by[33]:
| $ {c_0} = \frac{1}{{\rm{\pi }}}{\left( {\frac{{\Delta {K_{{\rm{eff,th}}}}}}{{\Delta {\sigma _0}}} \cdot \frac{{Q\left( {a,c} \right)}}{{F\left( {a,c,d,\phi = 0} \right)}}} \right)^2} $ | (12) |
where F(a, c, d, Φ) indicates the boundary correction factor provided by Newman and Raju. Q(a, c) indicates the shape factor for an ellipse. Δσ0 is the fatigue limit for non-corroded specimens; herein, a and c indicate the depth and the half surface length of pit, respectively. d indicates the residual thickness of corroded specimen in the gauge length.
Therefore, based on the analysis of sections 3.1 and 3.3.1, the multiple interacting pits have an outstanding influence on the value of ΔKeff, pits. The user-defined effective stress intensity can be also denoted as γΔKeff, pits. And when γΔKeff>ΔKeff, th, pits, the relations used to calculate the cracks growth rate is given by:
| $ \frac{{{\rm{d}}c}}{{{\rm{d}}N}}\left| {_{fc,{c_{0i}}}} \right. = C \cdot {\left( {\gamma \cdot \Delta {K_{{\rm{eff,pits}}}}} \right)^m} $ | (13) |
where γ is the uniform interaction factor as shown in Table 4.
Eq.(13) can be defined to be the model of FCGR-MPI.
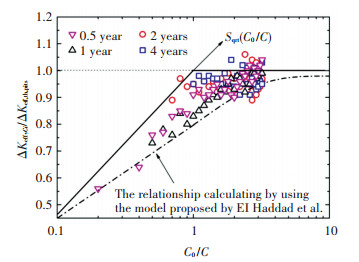
4 Fatigue Crack Growth DataFig. 12 shows the effective stress intensity factor ranges (ΔKeff, ci) for fatigue tests and calculated values with corrosion pits, in which the abscissa is the normalized crack size c/c0 and the ordinate is the normalized effective stress intensity factor range (ΔKeff, ci/ΔKeff, th, pits). It can be found that the normalized ΔKeff, ci is well agreed with the experimental result. This means that a precise estimation of the pit-to-crack transition causing failure can be shown as Eq.(9).
|
Figure 12 Modified ΔKeff for fatigue tests and calculated value with corrosion pits |
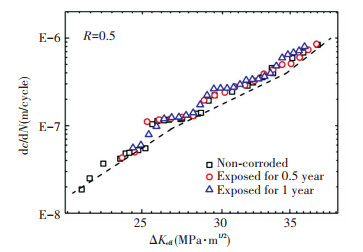
The fatigue crack growth rate curves of corroded specimens with different exposure time are shown in Figs. 13 and 14. From Fig. 13, it can be clearly seen that the typical crack growth rate (dash line) calculated by using the method of LEFM is well agreed with the experimental results without considering the multiple interacting pits, it showed, and when the exposure time is less than 2 years, the pit-to-crack interaction can be reasonably ignored in calculating the crack growth rate.
|
Figure 13 Effective stress intensity factor range against crack growth rate |
|
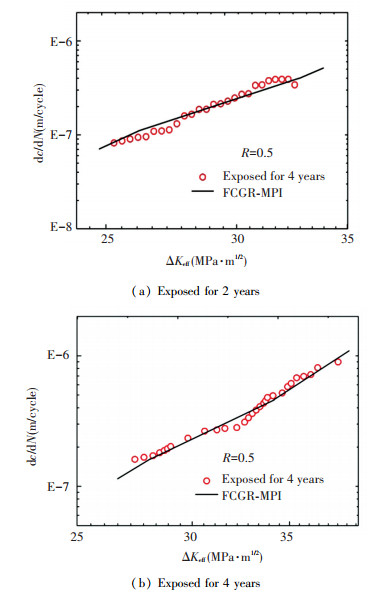
Figure 14 FCGR results of experimental data and calculated data |
In addition, from Fig. 13, the value of ΔKeff corresponding the crack the initiate increases with the increase of exposure time. It shows that the pits without the effect from the interaction can have an influence on the crack initiating.
Figs. 14(a) and (b) are two groups of crack growth rate for corroded specimens exposed for 2 and 4 years, respectively. From Tables 3 and 4, the values of γ corresponding to specimens exposed for 2 and 4 years was determined to be 1.3 and 1.4, respectively. Thus, the modified crack growth curves is obtained from Eq.(13), and denoted as the solid lines.
As can be seen from Fig. 14, the exposure time has the effect on the beginning of crack: the longer the exposure time is, the earlier the crack begins. For example, the beginning of the crack is at about 26 MPa·m1/2 for the corroded specimen with 2-years exposure time; and that of the corroded steel with 4 years is at about 29 MPa·m1/2.
Through section 3.1, it can be found that the corrosion pit is gradually wider and deeper with increasing exposure time. And it is well known that the longer the exposure is, the larger the pits is, and the larger the pit is, the higher level the stress concentration around the pit is. In terms of micromechanics, the accumulation of plastic strain can be signally caused by the high stress concentration. Therefore, the wide-deep pit can lead to the high stress concentration and then the high level of ΔKeff.
Moreover, Fig. 14 shows that the calculated crack growth rate (by using the model of FCGR-MPI) is considered as in good agreement with experimental results. This further proved that the conditions of Eq.(3) are necessarily considered for calculating the fatigue crack growth rate.
At last, it can be also found that, except for the beginning of the crack, the entire curve of the crack growth rate slightly rises with the increase of exposure time. Here, it can be explained that the material of base metal might has been influenced by the corrosive damage.
5 ConclusionsIn this study, we obtained the surface data of the corroded steel specimens and analyzed their profile characteristics. Then, to evaluate the fatigue life and the crack growth rate of the corroded steel, the multi-pits interaction was used. And the following conclusions can be drawn:
1) On the steel surface under atmospheric corrosion, slight pits densely distribute at the initial stage of corrosion; with the passing exposure, the pits rapidly expand and join together.
2) The average size of pits can be well used as the initial flaw size when calculating the fatigue life; and the predicted lives are well agreed with the measured lives of corroded steel specimens.
3) The conditions, given in Eq.(3) for estimating whether the pits interfere with each other, should not be ignored when calculating the fatigue life. While the exposure time is less than 2 years, the life should be predicted by using the model with single flaw; while more than 2 years, the model should be used by one of the multiple flaw interaction.
4) The beginning of crack growth is earlier with the increase of exposure. When the exposure time is less than 2 years, the model of FCGR-MPI can give a good estimation of the crack growth rate.
| [1] |
Barter S A. Fatigue crack growth in 7050 aluminium alloy thick section plate with a surface condition simulating some regions of F/A-18 structure. Melbourne: DSTO, 2003. 154-199.
( 0) 0)
|
| [2] |
Oskouei R H, Ibrahim R N. Restoring the tensile properties of PVD-TiN coated Al 7075-T6 using a post heat treatment.
Surface and Coatings Technology, 2011, 205(15): 3967-3973.
DOI:10.1016/j.surfcoat.2011.02.041 ( 0) 0)
|
| [3] |
Xu S H, Wang Y D. Estimating the effects of corrosion pits on the fatigue life of steel plate based on the 3D profile.
International Journal of Fatigue, 2015, 72: 27-41.
DOI:10.1016/j.ijfatigue.2014.11.003 ( 0) 0)
|
| [4] |
Horner D A, Connolly B J, Zhou S, et al. Novel images of the evolution of stress corrosion cracks from corrosion pits.
Corrosion Science, 2011, 53(11): 3466-3485.
DOI:10.1016/j.corsci.2011.05.050 ( 0) 0)
|
| [5] |
Dolley E J, Lee B, Wei R P. The effect of pitting corrosion on fatigue life.
Fatigue and Fracture of Engineering Materials, 2000, 23(7): 555-560.
DOI:10.1046/j.1460-2695.2000.00323.x ( 0) 0)
|
| [6] |
Acuña N, González-Sánchez J, Kú-Basulto G, et al. Analysis of the stress intensity factor around corrosion pits developed on structures subjected to mixed loading.
Scripta Materialia, 2006, 55(4): 363-366.
DOI:10.1016/j.scriptamat.2006.04.024 ( 0) 0)
|
| [7] |
Beretta S, Carboni M, Fiore G, et al. Corrosion-fatigue of A1N railway axle steel exposed to rainwater.
International Journal of Fatigue, 2010, 32(6): 952-961.
DOI:10.1016/j.ijfatigue.2009.08.003 ( 0) 0)
|
| [8] |
Hoeppner D W. Model for Prediction of Fatigue Lives Based Upon a Pitting Corrosion Fatigue Process. New York: ASTM-NBS-NSF Symposium, 1979. 841-870.
( 0) 0)
|
| [9] |
Kitagawa H, Takahashi S. Applicability of Fracture Mechanics to Very Small Cracks or the Crack in the Early Stage. Boston: American Society of Metals, 1976. 627-631.
( 0) 0)
|
| [10] |
Kitagawa H, Takahashi S. Proceedings of the 2nd International Conference on Mechanical Behaviour of Materials. Boston, 1976.
( 0) 0)
|
| [11] |
Bernd M, Schönbauer S E, Stanzl T, et al. Fatigue life estimation of pitted 12% Cr steam turbine blade steel in different environments and at different stress ratios.
International Journal of Fatigue, 2014, 65: 33-43.
DOI:10.1016/j.ijfatigue.2013.10.003 ( 0) 0)
|
| [12] |
Chuan Z, Chen Y, Yao W. The use of fractal dimensions in the prediction of residual fatigue life of pre-corroded aluminum alloy specimens.
International Journal of Fatigue, 2014, 59(3): 282-291.
( 0) 0)
|
| [13] |
Frulla G, Avalle G, Sapienza V. Preliminary evaluation of the fatigue behaviour of aluminium alloy in corrosive environment.
Aircraft Engineering and Aerospace Technology, 2015, 87(2): 165-171.
DOI:10.1108/AEAT-11-2013-0211 ( 0) 0)
|
| [14] |
Yasser F, Mostafa E l M. Shot-peening effect on high cycling fatigue of Al-Cu alloy.
Metallurgical and Materials Transactions A, 2013, 44(12): 5488-5492.
DOI:10.1007/s11661-013-1899-0 ( 0) 0)
|
| [15] |
Li H Y, Tang Y, Zeng Z D, et al. Exfoliation corrosion of T6-and T8-aged AlxCuyLiz alloy.
Transactions of Nonferrous Metals Society of China, 2008, 18(4): 778-783.
DOI:10.1016/S1003-6326(08)60134-X ( 0) 0)
|
| [16] |
Xu S H, Qiu B. Experimental study on fatigue behavior of corroded steel.
Materials Science & Engineering A, 2013, 584(6): 163-169.
( 0) 0)
|
| [17] |
Bernd M, Schönbauer S E, Stanzl T. Influence of environment on the fatigue crack growth behaviour of 12% Cr steel.
Ultrasonics, 2013, 53(8): 1399-1405.
DOI:10.1016/j.ultras.2013.02.007 ( 0) 0)
|
| [18] |
Xu S H, Ren S B, Wang Y D. Three-dimensional surface parameters and multi-fractal spectrum of corroded steel.
PLoS ONE, 2015, 10(6): e0131361.
DOI:10.1371/journal.pone.0131361 ( 0) 0)
|
| [19] |
Qiu B. The Study on Surface Characteristics and Eccentric Compressive Load Capacity of Corroded H-shape Steel Members at Neutral Salt Fog Environment. Xi' an: Xi' an University of Architecture and Technology, 2014.
( 0) 0)
|
| [20] |
National Standard of the People's Republic of China. Metallic Materials-Fatigue Testing-Axial-Force-Controlled Method: GB/T3075-2008. (in Chinese)
( 0) 0)
|
| [21] |
National Standard of the People's Republic of China. Standard Test Method for Fatigue Crack Growth Rates of Metallic Materials: GB/T6398-2000.(in Chinese)
( 0) 0)
|
| [22] |
Paggi M, Carpinteri A. Fractal and multifractal approaches for the analysis of crack-size dependent scaling laws in fatigue.
Chaos, Solitons & Fractals, 2009, 40(3): 1136-1145.
( 0) 0)
|
| [23] |
Carpinteri A. Scaling laws and renormalization groups for strength and toughness of disordered materials.
International Journal of Solids and Structures, 1994, 31(3): 291-302.
DOI:10.1016/0020-7683(94)90107-4 ( 0) 0)
|
| [24] |
Ding H Z, Xing X S, Zhu H S. Fractal behaviour in fatigue of materials.
Journal of Materials Science Letters, 1994, 13(9): 636-638.
DOI:10.1007/BF00271218 ( 0) 0)
|
| [25] |
Xu S H, Wang Y D, Xue Q F. Evaluation indicators and extraction method for pitting corrosion of structural steel.
Journal of Harbin Institute of Technology, 2015, 22(3): 15-21.
( 0) 0)
|
| [26] |
Leek T H, Howard I C. An examination of methods of assessing interacting surface cracks by comparison with experimental data.
International Journal of Pressure Vessels and Piping, 1996, 68(2): 181-201.
DOI:10.1016/0308-0161(94)00052-2 ( 0) 0)
|
| [27] |
Michel C, Catherine M, Majid S, et al. A predictive fatigue life model for anodized 7050 aluminium alloy.
International Journal of Fatigue, 2013, 48(1): 205-213.
( 0) 0)
|
| [28] |
Elber W. The significance of fatigue crack closure. ASTM, STZP 486, 1971. 230-243.
( 0) 0)
|
| [29] |
Newman J C. A crack closure model for predicting fatigue crack growth under aircraft spectrum loading. Methods and Models for Predicting Fatigue Crack Growth Under Random Loading. ASMT, STP 748, 1981. 53-84.
( 0) 0)
|
| [30] |
Veers P J. Fatigue Crack Growth Due to Random Loading. Sand: Sandia National Laboratory, 1987. 20-39.
( 0) 0)
|
| [31] |
Chapetti M D. Fatigue propagation threshold of short cracks under constant amplitude loading.
International Journal of Fatigue, 2003, 25(12): 1319-1326.
DOI:10.1016/S0142-1123(03)00065-3 ( 0) 0)
|
| [32] |
Santus C, Taylor D. Physically short crack propagation in metals during high cycle fatigue.
International Journal of Fatigue, 2009, 31(8/9): 1356-1365.
( 0) 0)
|
| [33] |
Kitagawa H, Takahashi S. Application of fracture mechanics to very small cracks or the cracks in the early stage. Proceedings of the 2nd International Conference on Mechanical Behavior of Materials. Int Conf Mech Behav, 1976.
( 0) 0)
|
 2017, Vol. 24


