This era has witnessed the increasing popularity and importance of Location-Based Services (LBSs) accompanying by the rapid proliferation of smart mobile computing devices. While Global Navigation Satellite System (GNSS) can easily satisfy localization needs for outdoor environments, yet the attenuated signal strength turns out to be disturbing in indoor circumstances[1]. Being motivated by the commercial and personal demands for megacities' indoor localization, increasing attention has been attached to a more affordable method: Wi-Fi fingerprinting localization. Featured by the application of Received Signal Strength Indication (RSSI), it realizes the function of localization through comparing online measurements with a pre-built, location-tagged database. Wi-Fi fingerprint approach stands out as it achieves a relatively accurate result by utilizing the off-the-shelf communication infrastructures.
Wi-Fi fingerprinting Indoor Localization System that fits for mass market users should be adaptive to highly complex and dynamic indoor environment. Moreover, it should be resistant to environmental changes so that the localization accuracy can be guaranteed. Accidental environmental changes, especially Access Point (AP) movement, occurs frequently in our daily life. No matter malicious or unintentional, it can directly change the propagation channel from signal sources to mobile users, and consequently give rise to the disability of corresponding data in offline database. As localization accuracy relies heavily on accurate real-time offline database, continually utilizing the same but distorted database will certainly debase the localization results.
However, typical fingerprinting localization methods fail to withstand environmental changes. Ref.[2] confirmed that various RF-fingerprinting localization algorithms were not robust enough under non-cryptographic attacks. Several methods have hitherto been put forward by scholars targeting to solve these issues[3-5]. The defects of them are a failure to cope with either intentional environmental changes or requirement of relatively high computational complexity. Therefore, AP's movement should be taken into full consideration for a commercial indoor positioning system.
Besides robustness, another vital issue that influences the user experience of indoor LBSs is localization accuracy and efficiency. To be more specific, the performance of simple methods (such as K Nearest Neighbor, KNN[6]) are not accurate enough due to complex indoor environment. Whereas probabilistic method[7], being more accurate, requires mass computation. Indeed, quite a few methods combine machine learning with fingerprinting positioning problem, such as cluster[8], support vector machine[9-10] and Compressive Sensing (CS) theory[11-13]. However, relying massively on the complex mathematical deduction, some methods make no remarkable progress on accuracy comparing with simpler ones.
With these concerns in mind, two contributions are brought out in this paper: first, we motivate the needs for the efficient design of moved AP detection and elimination, developing a deterministic algorithm to realize this objective. In this algorithm, a three-step decision mechanism based on vote scheme is introduced. Second, the optimization of an existing algorithm[14] is achieved, resulting in a more accurate positioning performance. Experimental results confirm that our proposed methods are effective in eliminating outliers and attaining relatively higher localization accuracy.
The paper proceeds as follows. Section 2 illustrates the overview of the system. Section 3 proposes the offline operation. Section 4 offers a detailed description of the online methods that we implemented. The performance of our system is presented in Section 5. The conclusion is drawn in Section 6.
2 System OverviewThe proposed system is divided into two phase: offline phase and online phase. Its overview is shown in Fig. 1.

|
Figure 1 System overview |
In the offline phase, fingerprints are collected and processed to establish the radiomap. In the online phase, after collecting the fingerprints, the erroneous AP detecting algorithm is firstly launched, detecting and eliminating moved APs. RSSI distributions' distance are explored to measure the fingerprints similarity. Weighted K Nearest Neighbor (WKNN) module is lastly utilized to achieve the function of location estimation.
3 Offline Phase ProcessingDuring the offline phase, the testing area is divided into grids based on the corresponding floor plan.Intersection points of adjacent grids are normally chosen as reference points (RP)[15], being used to collect RSSI readings. Hence, a specific fingerprint is assigned to every RP. Time samples of signal strength collected at the RP (xj, yj) can be mathematically represented as Eq.(1) shows:
| $ {\mathit{\boldsymbol{\psi }}_{\left( {{x_j}, {y_j}} \right)}}\mathit{\boldsymbol{ = }}\left[{\begin{array}{*{20}{c}} {{r_{1, 1}}} & {{r_{1, 2}}} & \cdots & {{r_{1, N}}}\\ {{r_{2, 1}}} & {{r_{2, 2}}} & \cdots & {{r_{2, N}}}\\ \vdots & \vdots & \vdots & \vdots \\ {{r_{M, 1}}} & {{r_{M, 2}}} & \cdots & {{r_{M, N}}} \end{array}} \right] $ | (1) |
In this matrix, ri, k refers to the ith scan from AP k, for i=1, 2, …, M, and k=1, 2, …, N. M is the total number of scans over a single AP. N is the total number of all approachable APs. Each observation will be displayed as an integer number[16-18].
To extract useful information, the average value and the standard deviation of above columns are computed using Eq.(2) and Eq.(3):
| $ {{\bar R}_k} = \frac{1}{M}\sum\limits_{i = 1}^M {{r_{i, k}}}, {\rm{for}}\;k = 1, 2 \cdots, N $ | (2) |
| ${s_k} = \sqrt {\frac{1}{{M-1}}\sum\limits_{i = 1}^M {{{({r_{i, k}}-{{\bar R}_k})}^2}} }, {\rm{for}}\;k = 1, 2, \cdots, N $ | (3) |
Hence, we can get:
| $ \begin{array}{l} {\mathit{\boldsymbol{M}}_{({x_j}, {y_j})}} = \left[{{{\bar R}_1}\;\;{{\bar R}_2}\;\; \cdots \;\;{{\bar R}_N}} \right]\\ {\mathit{\boldsymbol{S}}_{({x_j}, {y_j})}} = \left[{{s_1}\;\;{s_2}\;\; \cdots \;\;{s_N}} \right] \end{array} $ |
In this way, a table of ((xj, yj), {M(xj, yj), S(xj, yj)}), j=1, 2, …, L can be obtained. L is the number of all RPs. This is known as the radiomap.
4 Online Phase ComputationIn the online phase, the erroneous AP detecting algorithm is firstly introduced and then the fingerprinting localization algorithm is demonstrated.
4.1 Erroneous AP Detecting Algorithm 4.1.1 Preparation and flow chart of algorithmDuring the online detecting phase, the average of observations at an unknown location
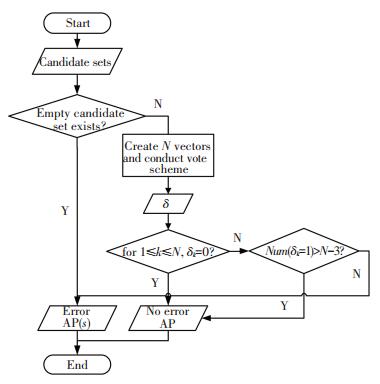
The flow chart of the decision mechanism is shown in Fig. 2.
|
Figure 2 Flow of erroneous AP detecting algorithm |
4.1.2 Step 1
The first condition is whether or not an empty candidate set exists. If it exists, then the corresponding AP(s) will be the erroneous one(s). This decision captures the intuitions that resembling fingerprints will be seen by the same user's device when it is in the same place. If the online observations contain some values that has never been observed in this place before, then it is very likely that their corresponding AP are moved.
4.1.3 Step 2However, considering the highly unpredictable environment, this situation is not applicable in most cases. For example, if an AP is slightly relocated or some preexisting obstacles disappear, its emitted signal strength can still be located in our preset ranges. Hence, a more strict decision condition should be made. Before that, we firstly define a binary vector as: pk=[p1, p2, …, pL] for AP k, where pφk=1, others are equal to 0. In this way, N vectors can be obtained. The second determination of moved APs can be retrieved through comparing the correlation between these vectors. The underlying intention of this step is: if none of AP is moved, the pattern of these N vectors should be related. In other words, the intersection of any two of those vectors are generally not empty. A vote theme is proposed to realize this, its pseudocode code is shown as:
| Algorithm: vote scheme Input: (1) pk, k=1, 2, …, N, the binary vector of each AP. (2) β, scalar product threshold for determining whether two binary vectors are correlated. (3) n, score threshold for determining whether or not an AP is an outlier. Output: δ=[δ1 δ2 … δN], the logical value vector for specifying the outliers. Initialization: s=0 // The initialization value of score is set to 0. For i=1:N, do For j=1:N, j≠i, do if piT·pj≠β, then s=s+1 else s=s End if End For if s>n then δk=0 else δk=1 End if Reset s=0 End For Return δ |
Second decision starts after obtaining the output of voting scheme. If δk= 0, for 1≤k≤N, then no erroneous AP exists in the testing environment.
4.1.4 Step 3If not, we cannot recklessly decide that for those δ equal to 1, corresponding APs are erroneous. An extreme case: δk=1, for 1≤k≤N may happen, indicating that all APs are moved. Hence, to ensure that three APs are involved in fingerprint localization[6], a third decision is deployed. If the number of δk=1 in δ is greater than N-3, we decide that no erroneous AP exists. If not, we then identify the APs whose δ equal to 1 are erroneous.
4.1.5 Key parameters discussionParameters involved in algorithm must be taken into careful account. The threshold α depends on the geographical distribution of APs. When APs are uniformly distributed in the testing area, we set the thresholds to be identical, because the amplitudes of global RSSI variations under each AP are almost the same. α 's range also worths a discussion. Large values will filter out most reference points and lead to information redundancy, whereas small values will restrict the candidate set to few points, producing incomplete estimate. In our experiments, αk=2 dBm, for 1≤k≤N.
In step 2, two parameters β and n are involved. β denotes the threshold of scalar product between two vectors. We let β equal 0, specifying that as long as two vectors have one common element, they are identified as related. For n, it manifests the score threshold used to determine whether or not an AP is an outlier. We let it equal N/2 (when N is even) or (N+1)/2 (when N is odd).
4.2 Distribution Distance CalculationIn this section, a fingerprint localization algorithm—MAximum Overlap algorithm (MAO) is firstly introduced. Then the optimization of this algorithm is demonstrated.
4.2.1 Introduction to MAximum Overlap algorithm (MAO)MAximum Overlap algorithm was first brought in Ref.[14]. Two key contributions of MAO algorithm are:
1) A new offline attribute-AP's weight is added for collaborating with mean and standard deviation for localization. AP's weight wk represents the ratio of observed scans under AP k to all APs' observed scans. Hence the offline table in section 3 will be changed to ((xj, yj), {M(xj, yj), S(xj, yj), W(xj, yj)}), j=1, 2, …, L;
2) An innovative and efficient way to compute the fingerprint distance. In MAO, the distribution of samples per AP per RP is considered as a Gaussian distribution, their similarity is measured by overlapping coefficient, which is the accounting of the overlapping area shown in Fig. 3.

|
Figure 3 AP 3's distributions observed at RP (6, 18) during four days interval |
According to the author, MAO's accuracy is 10% higher than those current state-of-art. More details of MAO are introduced in Ref.[14].
4.2.2 Optimization to MAximum Overlap algorithm (MAO)However, one weakness of applying MAO in indoor fingerprinting localization is the way it calculates distribution similarity. Sometimes, observed distributions from the same AP at the same RP during different periods can hardly overlap due to the highly complex indoor environment. Even for situations shown in Fig. 3, the values are normally lower than 0.2. Consequently, the value of overlapping coefficient always stays at an extremely low level, indicating that the distributions' divisibility is not strong enough. In order to enhance this characteristic, we replace the overlapping coefficient with Bhattacharyya distance[19-20], as Eq.(4) define:
| $ {d_{{\rm{Bhattacharyya distance}}}} =-{\rm{ln}}\left( {\smallint \sqrt {f\left( x \right)g\left( x \right)} {\rm{d}}x} \right) $ | (4) |
where f(x) and g(x) are two probability distributions. For a special case of two Gaussian distributions N(μi, σi2), for i= 1, 2, their Bhattacharyya distance is:
| $ \begin{array}{l} {d_{{\rm{Bhattacharyya distance}}}} = \frac{1}{8}{({\mu _1}- {\mu _2})^{\rm{T}}}{\left[{\frac{{{\sigma _1}^2 + {\sigma _2}^2}}{2}} \right]^{ -1}}({\mu _1} -\\ \;\;\;\;\;\;\;{\mu _2}) + \frac{1}{2}{\rm{ln}}\frac{{\left| {\frac{{{\sigma _1}^2 + {\sigma _2}^2}}{2}} \right|}}{{\sqrt {|{\sigma _1}^2||{\sigma _2}^2|} }} \end{array} $ |
Then, to achieve a higher accuracy of the result, we add a WKNN module after the computation of fingerprint distance dMAO, j, j=1, 2, …, L: firstly ascending sort fingerprint distance, followed by choosing the least K position tags, and in this way the estimated position
| $ \hat p = \sum\limits_{j = 1}^K {{w_j}{p_j}} $ |
where the weight wj of tag pj is computed as:
| $ \begin{array}{l} {w_j} = 1/\left( {\varepsilon + {\mathit{\boldsymbol{d}}_{MAO, j}}} \right)\\ \;\;\;\;\;\;\;\;\;\sum\limits_{j = 1}^K {{w_j} = 1} \end{array} $ |
Here, ε is an extremely small constant.
5 Simulation and Result AnalysisThis section provides details on our proposed algorithms' experimental evaluation by using real data through simulation.
5.1 Experiment SetupAs Fig. 4 shows, the size of our testing area is 27 m×10 m. We partition this area into 1 m×1 m grids. 6 APs are implemented uniformly. All APs come from a same vendor—TP-LINK with the same model—TL-WR886N.

|
Figure 4 Testing area |
During the training phase, training data are collected by Samsung Galaxy Note 2 over 118RPs. The Android software used to collect real RSSI data is developed by SJTU-GNC lab. At each RP, all APs are approachable, the sampling frequency is 1 Hz and the period of measurement per location is 300 s. The orientation of terminal in offline phase is designated (as shown in Fig. 4). In terms of the online data collecting, it was conducted four days later to capture the environmental variety. We randomly choose 33 central points of each grid as the testing points. At each point we use the same sampling frequency but reduce the number of samples to 30. The terminal's orientation keeps the same as it is in offline phase.
After two types of data are collected, we use MATLAB to test the performance of our algorithms. Euclidean distance is chosen as the metric of positioning error between the true position and its estimation.
5.2 Evaluation of Erroneous AP Detecting AlgorithmIn this section, for simplicity, our proposed erroneous AP detecting algorithm is added on NN to verify its performance.
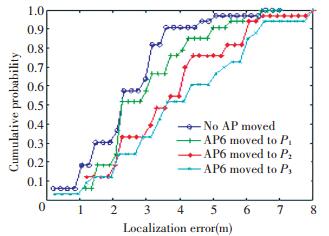
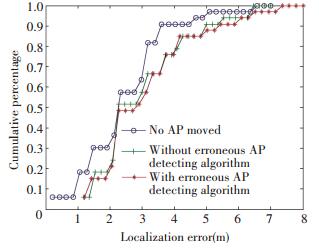
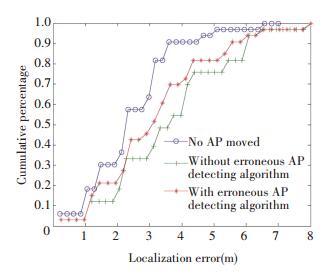
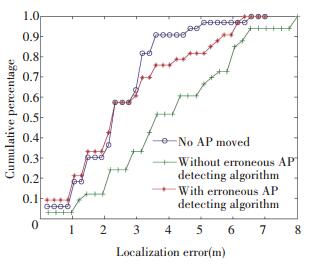
5.2.1 Distortion evaluation and single AP movement scenario comparisonIn the first experiment, we pick AP6 as test AP to evaluate the distortion caused by single AP movement and testify our erroneous AP detecting algorithm's effectiveness. Three uniformly separated points P1, P2 and P3 are firstly chosen, locating from near to far regarding AP6 (see yellow signs in Fig. 4). We move AP6 to these positions in turn before online fingerprints collection. We run the simulation program both with and without our erroneous AP detecting algorithm. Cumulative Distribution Function (CDF) is implemented to illustrate the localization results, which are shown as below.
Fig. 5 indicates the movement of AP's position can incur damage on location accuracy in varying degrees, depending on the distance of movement (22.58, 49.26, 63.72 per cent decrease on average overall accuracy for three scenarios). In short, the farther APs are moved, the severer the damage is. The following three figures(Figs. 6-8) illustrate the cumulative probabilities with detecting algorithm added on. It's worth mentioning that in scenario 1(as shown in Fig. 6) where AP6 is moved to P1, its cumulative probabilities is close to the healthy one, which indicates that slight movement will not bring too much distortion. At this time, our algorithm is not working so well. While the circumstances in Fig. 7 and Fig. 8 specify that with our erroneous AP detecting algorithm, the average overall accuracy can be improved from 3.632 4 m to 3.149 8 m (13.29%) and from 3.984 2 m to 2.712 3 m (31.92%) respectively.
|
Figure 5 Localization error comparison between healthy case and three testing scenarios |
|
Figure 6 Localization error comparison with and without outlier detection in scenario 1 |
|
Figure 7 Localization error comparison with and without outlier detection in scenario 2 |
|
Figure 8 Localization error comparison with and without outlier detection in scenario 3 |
5.2.2 Multi-AP movement scenario comparison
The second experiment illustrates of test of multi-AP's movement before online phase. The testing process is split into two parts: in test one, AP1 and AP2 are moved 5 m away from its original position, and the orientation is randomly chosen. For the second one, we still randomly choose the orientations and move AP4 and AP5 simultaneously for 15 m.
As seen from the Fig. 9, when short-distance operation is executed, the average overall accuracy is improved by 12.16% with the detecting algorithm added on (from 3.636 1 m to 3.194 0 m). In Fig. 10, under the second scenario where long-distance operation conducted, the localization performance is improved by 29.12% (from 4.781 7 m to 3.389 2 m).

|
Figure 9 Localization error comparison with and without outlier detection in scenario 1 |

|
Figure 10 Localization error comparison with and without outlier detection in scenario 2 |
5.2.3 Summary and discussion
While the effectiveness of our algorithm is clearly confirmed, especially in cases of long-distance AP movement, this algorithm is not sensitive enough to short-distance AP movement. Under this circumstance, the application of this algorithm only retains the original accuracy, even resulting in a slight reduction of accuracy. The complex indoor environment admittedly accounts for this deficiency—in short-distance AP movement, the renewed offline fingerprint database presents no notable difference comparing with the previous one, which leads to erroneous responses or no response of our algorithm. However, as we notice, the localization accuracy suffers little decline as well when short-distance AP movement occurs. Arguably, the influence that short-distance AP movement exerts on localization results is so very slight, and therefore is within the tolerable range.
5.3 Accuracy Comparison with Other MethodsIn this experiment, we compare our optimized MAO algorithm with original MAO algorithm and other typical algorithms in terms of overall localization accuracy. No AP is moved as we only consider the performance of localization algorithm. Parameters involved in those algorithms are adjusted to their optimal states via cross-validation. Fig. 11 clearly confirms that the new optimized MAO has the best performance. The average overall accuracy is 1.829 9 m, which is increased by 26.13% (KNN, 2.477 3 m), 18.81% (WKNN, 2.253 8 m), 10.77% (Gaussian Kernel, 2.050 8 m) and 5.95% (MAO, 1.945 6 m).

|
Figure 11 Localization accuracy comparison of various methods |
6 Conclusions
This paper proposed a moved AP detecting algorithm against AP's movement in Wi-Fi indoor positioning system. During the offline phase, RSSI's average, standard deviation and AP's weight are computed and thus the radiomap combined by these three attributes is formed. In the online phase, our AP detecting algorithm is firstly implemented to detect and filter out the erroneous AP. Then based on our healthier radiomap, an optimized edition of MAO algorithm is applied. The simulation results show that our proposed techniques have reached the preset requirement and have outperformed other typical methods in accuracy.
| [1] |
Djuknic G M, Richton R E. Geolocation and assisted GPS.
IEEE Computer, 2001, 2: 123-125.
DOI:10.1109/2.901174 ( 0) 0)
|
| [2] |
Chen Y, Kleisouris K, Li X, et al.
The robustness of localization algorithms to signal strength attacks: a comparative study. Proceedings of the International Conference on Distributed Computing in Sensor Systems. Berlin. Berlin: Springer, 2006: 546-563.
( 0) 0)
|
| [3] |
Haeberlen A, Flannery E, Ladd A M, et al.
Practical robust localization over large-scale 802.11 wireless networks. Proceedings of the 10th annual international conference on Mobile computing and networking. Philadelphia: ACM, 2004: 70-84.
( 0) 0)
|
| [4] |
Meng W, Xiao W, Ni W, et al. Secure and robust Wi-Fi fingerprinting indoor localization. Proceedings of the 2011 International Conference on Indoor Positioning and Indoor Navigation.
Piscataway: IEEE, 2011: 1-7.
DOI:10.1109/IPIN.2011.6071908 ( 0) 0)
|
| [5] |
Liu C.
Principle and Application Progress in Location-Based Services. Berlin, Heidelberg: Springer International Publishing, 2014: 47-57.
( 0) 0)
|
| [6] |
Bahl P, Padmanabhan V N. RADAR: An in-building RF-based user location and tracking system. INFOCOM 2000. Proceedings of the 19th Annual Joint Conference of the IEEE Computer and Communications Societies.
Piscataway: IEEE, 2002, 2: 775-784.
DOI:10.1109/INFCOM.2000.832252 ( 0) 0)
|
| [7] |
Roos T, Myllymäki P, Tirri H, et al. A probabilistic approach to WLAN user location estimation.
International Journal of Wireless Information Networks, 2002, 9(3): 155-164.
DOI:10.1023/A:1016003126882 ( 0) 0)
|
| [8] |
Youssef M, Agrawala A. The Horus location determination system.
Wireless Networks, 2008, 14(3): 357-374.
DOI:10.1007/s11276-006-0725-7 ( 0) 0)
|
| [9] |
Brunato M, Battiti R. Statistical learning theory for location fingerprinting in wireless LANs.
Computer Networks, 2005, 47(6): 825-845.
DOI:10.1016/j.comnet.2004.09.004 ( 0) 0)
|
| [10] |
Wu C L, Fu L C, Lian F L. WLAN location determination in e-home via support vector classification. Proceedings of the 2004 IEEE International Conference on Networking, Sensing and Control.
Piscataway: IEEE, 2004, 2: 1026-1031.
DOI:10.1109/ICNSC.2004.1297088 ( 0) 0)
|
| [11] |
Feng C, Au W S A, Valaee S, et al. Compressive sensing based positioning using RSS of WLAN access points. Proceedings of the INFOCOM.
Pisacataway: IEEE, 2010: 1-9.
DOI:10.1109/INFCOM.2010.5461981 ( 0) 0)
|
| [12] |
Feng C, Au W S A, Valaee S, et al. Received-signal-strength-based indoor positioning using compressive sensing.
IEEE Transactions on Mobile Computing, 2012, 11(12): 1983-1993.
DOI:10.1109/TMC.2011.216 ( 0) 0)
|
| [13] |
Sun B, Guo Y, Li N, et al. TDL: Two-dimensional localization for mobile targets using compressive sensing in wireless sensor networks.
Computer Communications, 2016, 78: 45-55.
DOI:10.1016/j.comcom.2015.10.006 ( 0) 0)
|
| [14] |
Ledlie J, Park J, Curtis D, et al. Molé: a scalable, user-generated Wi-Fi positioning engine.
Journal of Location Based Services, 2012, 6(2): 55-80.
DOI:10.1109/IPIN.2011.6071942 ( 0) 0)
|
| [15] |
Kaemarungsi K, Krishnamurthy P. Analysis of WLAN's received signal strength indication for indoor location fingerprinting.
Pervasive and mobile computing, 2012, 8(2): 292-316.
DOI:10.1016/j.pmcj.2011.09.003 ( 0) 0)
|
| [16] |
IEEE Computer Society LAN MAN Standards Committee. Wireless LAN Medium Access Control (MAC) and Physical Layer (PHY) Specifications: IEEE Standard, 802. 11. Piscataway: IEEE, 1997.
( 0) 0)
|
| [17] |
Bardwell J. Converting signal strength percentage to dBm. http://madwifi-project.org/attachment/wiki/UserDocs/RSSI/Converting_Signal_Strength.pdf?format=raw, 2002-12-17.
( 0) 0)
|
| [18] |
Kaemarungsi K. Distribution of WLAN received signal strength indication for indoor location determination. Proceedings of the 20061st International Symposium on Wireless Pervasive Computing. Piscataway: IEEE, 2006. Paper No. 9053889. DOI: 10.1109/iswpc.2006.1613601.
( 0) 0)
|
| [19] |
Kailath T. The divergence and Bhattacharyya distance measures in signal selection.
IEEE Transactions on Communication Technology, 1967, 15(1): 52-60.
DOI:10.1109/tcom.1967.1089532 ( 0) 0)
|
| [20] |
Kushki A, Plataniotis K N, Venetsanopoulos A N. Kernel-based positioning in wireless local area networks.
IEEE Transactions on Mobile Computing, 2007, 6(6): 689-705.
DOI:10.1109/tmc.2007.1017 ( 0) 0)
|
 2017, Vol. 24


