2. College of Instrumentation & Electrical Engineering, Jilin University, Changchun 130026, China
GEMISs are generalized induction coil sensors applied in geo-magnetic exploration. In order to increase the detection sensitivity in two orders of magnitude, soft magnetic material as the magnetic core is often added to induction coil. These sensors are characterized by the advantages of high detection sensitivity, low output noise level, broad response frequency bands, low mass, ultra compact, etc[1-2]. GEMISs are the most effective sensors to obtain alternating magnetic field information via various geo-electromagnetic detection methods such as the magnetotelluric method (MT), audio frequency magnetotelluric method (AMT), controlled-source audio-frequency magnetotelluric method (CSATM), oceanic controlled source electromagnetic method (OCSEM) and time domain electromagnetic method (TEM), etc. Moreover, they are widely used in various fields, especially in deep crust detection, mineral and energy resources exploration, underground water resources discovery, and environmental survey, and so on[2-3].
Generally, the research on the GEMISs is derived from original hollow induction coil. Tumanski[4] introduced the origin of the induction sensor and summarized the common hollow induction coil and magnetic induction sensor. Tumanski[4] mainly proposed the output voltage parameters, signal-noise ratio and preamplifier circuit (non-chopper amplifier circuit, author's note) of the ferrite magnetic induction sensor. Ripka[5] offered a noise and stability analysis of the magnetic sensor. Palangio et al.[6] provided the three-component magnetic measurement at Ferrara University, Italy. Prance et al.[7] designed an ultra-low noise induction sensor working in changing temperature conditions. Séran and Fergeau[8] developed a triaxial magnetic induction sensor for measuring the change of earth's magnetic field utilized in satellites. Matzander[9] illustrated the calculation method for GEMISs detection sensitivity, signal-noise ratio and the calibration parameters in the technical document of MFS-06e sensor. Geng et al.[1] described the research and development on broadband and ultra-low-frequency magnetic sensors. Ju et al.[10] summarized the following aspects of GMIESs: inductance and capacitance loss, induction coil design step, preamplifier circuit, shielding room calibration, etc (non-chopper amplifier circuit, author's note). In addition, the authors have published several scientific papers to analyze and discover the implementation methods for high-performance GEMISs[11]. Due to the technical and theoretical limitations, expanding the bandwidth to low frequency presented great difficulties. High detection sensitivity of GEMISs is a main parameter when they are applied in weak magnetic field detection. However, low-frequency noise level constrains detection sensitivity improvement at low frequency.
The fundamental operation principle of GEMISs is the Faraday's Law's of electromagnetic induction. The complete output induced electromotive force of GEMISs is[12]:
| $ \varepsilon = {\mu _{{\rm{app}}}}ANSj\omega B\cos \theta $ | (1) |
where μapp is the effective permeability of magnetic core; A is the magnification of preamplifier; N is the number of induction coil turns; S is the effective area of a single coil (cross-sectional area of magnetic core); j is an imaginary unit; ω is the frequency of measured magnetic field; B is magnetic induction intensity of the measured magnetic field; θ is the angle between the measured magnetic induction intensity and the axial direction of the sensor. Therefore, when the parameters ω, B, θ and S are given, the induced output signal of GEMISs is only related to the parameters of magnetic core, μapp, A and N. So the research on GEMISs is mainly on the optimization of the aforementioned three parameters, especially the realization of a large effective area under high effective permeability condition, the development of broadband chopper amplifiers and induction coils with low distributed parameters.
The proposed manuscript firstly introduces the performance parameters of typical international GMIESs. Then, combining the development of typical sensors and the above-mentioned three research emphases (detection sensitivity, output noise level and response frequency band), five key technologies for sensors fabrication are given. The performance character of GEMISs made by us is introduced, and then the technical parameters difference between our sensor and typical international sensors are summarized. Finally, the development orientation of GEMISs is analyzed.
2 The Performance Characters of Typical Interna-tional GEMISsAt present, the world prestigious manufacturers of GEMISs are the Phoenix Company in Canada, the Metronix company in Germany, Zonge company, KJT Company and Schlumberger's EMI Technique Center in United States and the LCISR Research Institute in Ukraine[13]. There are certain differences in the performance of GEMISs produced by each company. There are 3-4 categories generally distinguished according to response frequency band. The specific parameters of each category are shown in Table 1.
| Table 1 Comparison of properties of typical international GEMISs[13] |
In Table 1, the sensors produced by Phoenix and Metronix[13] are mainly applied in the MT and CSAMT fields, while the products fabricated by Zonge[13] are chief applied in the CSAMT application. The proposed three types of GEMISs have been widely utilized in China. Meanwhile, the representative sensors MFS-08U and MFS-09 of Metronix[13] are also used in OCSEM range. LCISR products (exclude LEMI-120) are most fitted in real detection. Seen from the properities, the response frequency band of GEMISs used in MT is usually 10-4Hz-1 kHz, the maximum detection sensitivity can reach up to f× 2 500 mV/nT@0.01 Hz, and the output noise level is usually 0.1pT/
In addition, the EH4 electromagnetic imaging system produced by Laurel company is equipped with a specialized GEMIS[14]. Its performance parameters are closed because of its specialization for EH4. However, it can be divided into two types: one is 0.1 Hz-1 kHz for low frequency application; the other is 10 Hz-100 kHz for high frequency application.
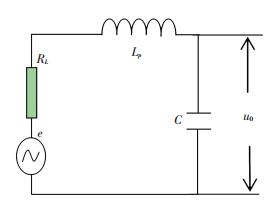
3 Key GEMISs TechnologiesThe basic equivalent circuit of induction coil is a second-order system, in which coil inductance is connected in series with internal resistance, and then the series circuit is in parallel with distributed capacitance. The basic equivalent circuit of the GEMIS is illustrated in Fig. 1.
|
Figure 1 Basic equivalent circuit of the GEMIS |
In Fig. 1, e is the induced voltage; u0 is the output voltage of the induction coil. The output signal depends linearly on frequency, but due to internal resistance RL, self-inductance Lp and the distributed capacitance C of the sensor, the dependence V=f(f) is more complex.
3.1 Band Spreading Technology Based on Flux Negative FeedbackAnalyzing the equivalent circuit of the GEMIS (Fig. 1), we find that the output signal increases linearly with the frequency of measured magnetic field, up to resonance frequency. And the resonance frequency above, the influence of distributed capacitance causes the output signal to drop. So there is a large sensitivity threshold between the low corner frequency and the high corner frequency, which is unfavorable for sensor design and application. There are several useful methods for improving the sensor frequency characteristic: one is the connection of an integrating transducer to the sensor output; another is a load of a sensor with a very low resistance (current-to-voltage converter). By adopting these two methods, we can obtain a flat frequency response between the low and high corner frequency. Unfortunately, the low matched resistance will produce termal noise, which can lead to the noise level of the sensor increase and the sensitivity decrease[15]. Therefore, GEMISs adopt flux negative feedback circuit to obtain steady output from the sensor[16-18]. In this way, the output voltage is converted into current via Ⅴ-Ⅰ transformation, and then the feedback magnetic field will be effect on the feedback coil. At the corner frequency, a steady negative feedback system is formed by the combination of the feedback magnetic field and the measured magnetic field[19-20]. In addition, the bandwidth is expanded to lower frequency by adding frequency compensation[7, 21]. The structure of the GEMISs with flux negative feedback is illustrated in Fig. 2.

|
Figure 2 Structure of the GEMISs with flux negative feedback |
In Fig. 2, Ls is the self-inductance of feedback coil; Rfb is the feedback resistance. Supposed: N is the number of induction coil turns; S is the cross-sectional area of the magnetic core; G is the magnification of electric circuit; μapp is the effective permeability of magnetic core; M is the mutual inductance between induction coil and feedback coil, and k is the mutual coupling factor, when the two coils are tightly coupling, k=1; and M can be obtained as follows:
| $ M = k\sqrt {{L_s}{L_p}} = \sqrt {{L_s}{L_p}} $ | (2) |
According to the transfer function of GEMISs structure provided by Fig. 2, the amplitude-frequency function[8] of GEMISs is shown in Eq.(3):
| $ H\left( \omega \right) = \frac{{\omega NS{\mu _a}G}}{{\sqrt {{{\left( {1 - {\omega ^2}C{L_p}} \right)}^2} + {\omega ^2}{{\left( {{R_{\rm{L}}}C + \frac{{GM}}{{{R_{fb}}}}} \right)}^2}} }} $ | (3) |
wherein, G, M, Rfb, C and RL are general in 103, 10-1, 103, 10-10 and 102 of magnitude respectively. Therefore, RLC can be negligible during the whole frequency bands. In addition, resonance frequency is usually at about 1 kHz, and the following approximation can be given:
| $ {\left( {1 - {\omega ^2}C{L_p}} \right)^2} \ll {\omega ^2}{\left( {{R_L}C + \frac{{GM}}{{{R_{fb}}}}} \right)^2} $ | (4) |
Then Eq.(3) is simplified as:
| $ H\left( \omega \right) = \frac{{\omega NS{\mu _a}G}}{{\sqrt {{\omega ^2}{{\left( {\frac{{GM}}{{{R_{fb}}}}} \right)}^2}} }} = \frac{{NS{\mu _a}G}}{{\frac{{GM}}{{{R_{fb}}}}}} = \frac{{NS{\mu _a}{R_{fb}}}}{M} $ | (5) |
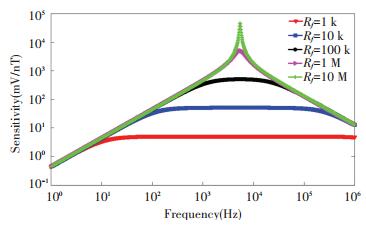
As Eq.(5) describes, there is no relationship between amplitude-frequency characteristic of GEMISs and frequency ω at around resonance frequency. Besides, the amplitude-frequency characteristic curve keeps flat within a wide frequency range. The amplitude-frequency characteristic curves under different feedback depths are illustrated in Fig. 3.
|
Figure 3 Amplitude-frequency characteristics curve of GEMISs with flux negative feedback |
The phase-frequency characteristic function of GEMISs with flux negative feedback is illustrated as:
| $ \phi \left( \omega \right) = {90^ \circ } - \arctan 2\frac{{\omega \left( {{R_L}C + \frac{{GM}}{{{R_{fb}}}}} \right)}}{{1 - {\omega ^2}C{L_p}}} $ | (6) |
Because GM/Rfb is far more than RLC, so within a wide frequency range at about resonance frequency, there is
| $ 2\frac{{\left| {\omega \left( {{R_L}C + \frac{{GM}}{{{R_{fb}}}}} \right)} \right|}}{{\left| {1 - {\omega ^2}C{L_p}} \right|}} \to \infty $ | (7) |
wherein,
| $ \arctan 2\frac{{\omega \left( {{R_L}C + \frac{{GM}}{{{R_{fb}}}}} \right)}}{{1 - {\omega ^2}C{L_p}}} \to {90^ \circ } $ | (8) |
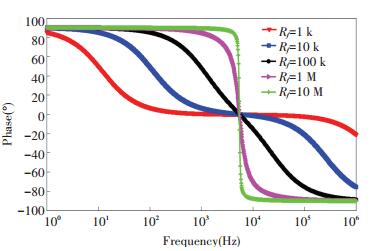
So within a wide frequency range at resonance frequency, phase angle φ(ω)≈ 90°-90°=0°. Normally, the phase suddenly changes 180° at the resonance-frequency, but the phase angle of the GEMISs with flux negative feedback structure changes smoothly during the entire response frequency bands which contributes GEMISs applied in geo-electromagnetics application. The simulation results of phase-frequency characteristic curve under different feedback depths are described in Fig. 4.
|
Figure 4 Phase-frequency characteristics curve of GEMISs with flux negative feedback |
Sensor with transformer coupled negative feedback by the magnetic flux allows obtaining wideband frequency response, low sensitivity threshold and the main feature of this version is the possibility to control the flat part of amplitude-frequency response in wide range[22-23].Chen[24] referenced that the flat frequency response with frequency band of 1 Hz-9.8 kHz will be obtained on the condition of Rfb=2.4 kΩ, the turns number of feedback coil N= 30. Compared to non-flux feedback structure, this method not only expands the response frequency bandwidth of GEMISs, but also changes the phase smoothly which is helpful for phase processing.
However, some researchers such as Coillot[25] considered that simply adding a second coil did not efficiently extend the frequency band beyond the first resonance due to the mutual impedance of the two coils, so they used the so called "mutual reducer" to build a DBSC (dual-band search-coil) which is able to measure magnetic field fluctuations from 0.1 Hz up to 1 MHz. Therefore, we should analyze the effect of the mutual impedance between the induction coil and the feedback coil by theoretical derivation and experiment.
3.2 Eddy Current Loss Suppression Technology Based on Laminated Magnetic CoreIn order to improve the GEMIS's performance, the magnetic core is usually composed of high permeability material with low coercivity and high saturation magnetic induction. Permalloy is usually used for magnetic core, but its resistivity is very low, which is only about 55 μΩ·cm. The induced current is lost in magnetic core inside via heat energy losses when the magnetic core under an alternating magnetic field, which could reduce the output sensitivity of GEMIS[26-27].
When the work frequency is increased, the magnetic loss of the core is much larger than the impedance loss of the coil. The magnetic loss of the core consists of eddy current loss, hysteresis loss, and residual loss. The residual loss which is proportional to the work frequency is difficult to estimate. For the induction magnetic sensor with gracile core, the residual loss effects are negligible. The hysteresis loss is associated with the properties of the magnetic material (coercivity) and the manufacturing technology[10]. In general applications, the core shape is rectangular parallelepiped. In order to reduce eddy current loss at higher frequency, the core is cut into thinner stripes and annealed with adhesive[8]. The computational function for eddy current loss of the magnetic core can be obtained by the surface current equivalent method. Supposed that the magnetic core is composed of solid magnetic material with the thickness n, and then the eddy current loss is:
| $ {P_c} = \frac{{{{\rm{\pi }}^2}{n^2}{a^2}}}{{8\rho }}{f^2}B_m^2 $ | (9) |
wherein, Pc is the eddy current loss of magnetic core; a is the cross section width of magnetic core; ρ is the resistivity of the magnetic material; f is the frequency of external magnetic field; Bm is the external magnetic induction density. So the eddy current loss of a magnetic core with n pieces of magnetic material in unit thickness is:
| $ {P_{ns}} = n{P_s} = n\frac{{{{\rm{\pi }}^2}{a^2}}}{{8\rho }}{f^2}B_m^2 $ | (10) |
And:
| $ {P_c} = n{P_{ns}} $ | (11) |
From Eq.(9), the eddy current loss of the magnetic core with n pieces of magnetic material is reduced by n times compared to that of a solid magnetic core at the same condition.
In addition, the effective cross-section area of the core reduced by skin effect can be increased to its theoretical value thanks to the "laminated" structure. The skin depth formula is shown as Eq. (12)[28]:
| $ \delta = \sqrt {\frac{\rho }{{{\rm{\pi }}{\mu _0}{\mu _r}f}}} $ | (12) |
wherein, δ is skin depth; ρ is the resistivity of the magnetic material; μ0 is magnetic permeability in vacuum; μr is the relative permeability of magnetic material, and f is measured magnetic field frequency. From the formula we know, once the material of the magnetic core is identified, the skin depth in different work frequencies is identified simultaneously. When the core is cut into many thinner slices, the thickness of each slice reduces. Then the flux cross the entire cross-section surface of the magnetic core (δ> thickness of the core), that is to say, the effective cross-section area of the core increases. Moreover, the relative effective permeability can be calculated by Eq.(13) determined by the depth-diameter ratio. The thin slice is sliced very thin during the manufacturing process of the laminated magnetic core. So the edge of lamination goes upward seriously. We can misplace the laminations to solve the problem. The concrete procedure is: the odd lamination aligned with the odd one, the even lamination aligned with the even one, and the position deviation in length between the two layers is about 2 mm[10]. In addition, the space between the two adjacent layers can also affect flux distribution of the magnetic core.
Therefore, improving the manufacturing process of the laminated magnetic core is very important to the development of the induction magnetic core.
3.3 Effective Permeability Enhancing Technology Based on Flux ConcentratorsThere is an accurate evaluation for the effective permeability of the core (μeff)[4]:
| $ {\mu _{{\rm{eff}}}} = \frac{{{\mu _r}}}{{1 + {N_B}\left( {{\mu _r} - 1} \right)}} $ | (13) |
wherein NB is the demagnetizing factor[29].
| $ {N_B} = \frac{1}{{\frac{{{l^2}}}{{{d^2}}} - 1}}\left\{ {\frac{{\frac{l}{d}}}{{2{{\left( {\frac{{{l^2}}}{{{d^2}}} - 1} \right)}^{\frac{1}{2}}}}}\ln \left( {\frac{{\frac{l}{d} + \sqrt {\frac{{{l^2}}}{{{d^2}}} - 1} }}{{\frac{l}{d} - \sqrt {\frac{{{l^2}}}{{{d^2}}} - 1} }}} \right) - 1} \right\} $ | (14) |
where l/d is called length-to-diameter ratio. From Eqs.(13) and (14), it is certain that the effective permeability μeff is far less than the initial permeability of the core material (μr) because of the influence of demagnetization factor (NB)[23, 30]. And the demagneti-zation factor depends on the length-to-diameter ratio (l/d). So there is a relationship between l/d and μeff: the greater length-to-diameter ratio is, the higher the relative effective permeability is[31-32], and the higher the output sensitivity can be obtained. To utilize the magnetic permeability of a core material to its maximum with a coil, the aspect ratio of this core must be infinite[33].
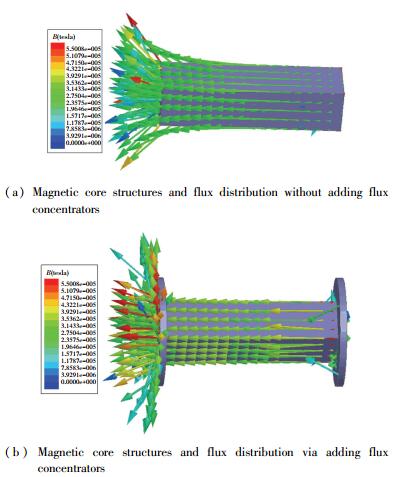
In order to assure enough cross-sectional area of GEMISs with finite length, the length-diameter ratio of GEMISs is restricted. In this situation, we can attach flux concentrators in the shape of thin disks to the core to enhance the effective permeability[20, 25, 34-38]. The finite element simulation results show that the intrinsic flux distribution can be changed via adding flux concentrators to the two ends of magnetic core. Thus the relative effective permeability is increased without changing the depth-diameter ratio. The magnetic core structures and flux distributions simulation results before and after adding the flux concentrators are shown in Figs. 5(a) and 5(b), respectively.
|
Figure 5 The magnetic core structures and flux distributions simulation result before and after adding the flux concentrators |
The concentrator has resolved the flux leakage phenomenon, that is to say, the flux distributed out of the core is gathered to the inside of the core by the flux concentrator, and then the relative effective permeability increases. Chen mentioned that adding flux concentrator at the terminals of ferromagnetic core can increase the effective magnetic conductance and the coupling coefficient (the coupling coefficient between induction coil and magnetic core)[30].
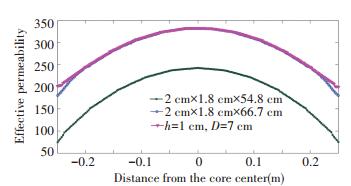
When the magnetic core length is 54.8 cm, the length and width of the cross section are 2 cm and 1.8 cm, respectively. The relative effective permeability distribution of the magnetic core in length is shown in Fig. 6 as the green line[12]. In the center of magnetic core, the maximal relative effective permeability is about 240. When a flux concentrator with thickness of 1 cm and diameter of 7 cm is adopted, the relative effective permeability distribution of magnetic core in length is shown in Fig. 6 as the pink line. In the center of the core, the maximal relative effective permeability increases up to 330. However, on both sides of the central point, the relative effective permeability has increased much more, from 75 to 200. Under the same condition, the output sensitivity of GEMISs with flux concentrators is higher than that of GEMISs without flux concentrators. In Fig. 6, the blue line is the relative effective permeability distribution in length when the cross-section area is unchanged but the length of the core increases to 66.7 cm. The distribution is the same as that of the core length of 54.8 cm with flux concentrators. The relative effective permeability of a finite-length core via adding a flux concentrator can be improved, which plays an important role in increasing the output sensitivity of GEMISs.
|
Figure 6 The effective permeability distribution curve of the magnetic core |
In practice, the effective permeability of magnetic core is different because of the different sizes of flux concentrator. To a certain extent, the inductive voltage will increase as the diameter of the flux concentrator increase. Generally, the thickness of the flux concentrator is (10-20) mm. Taking the above-mentioned magnetic core with a length of 54.8 cm as an example, the effective permeability parameters varied with the change of the flux concentrator size are shown in Table 2.
| Table 2 The effective permeability parameters with different collectors |
Table 2 indicates that the effective permeability μa has increased 200% after adding a flux concentrator to the core with diameter of 7 cm, thickness of 4 cm. However, the relationship between the size of the flux concentrator and the inductive voltage (effective permeability) should be discussed in detail. And then, a higher inductive voltage is obtained with a smaller size flux concentrator.
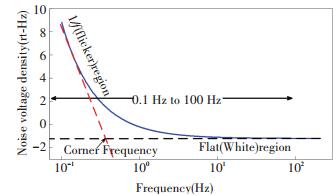
3.4 1/f Noise Suppression Technology Based on the Chopper AmplifierLow-frequency noise is mainly caused by the conductivity random variation due to poor contact between conductors, which universally exists in electronic devices, called contact noise or flicker noise. The power spectrum density of low-frequency noise is inversely proportional to the frequency f. So the lower frequency f is, the greater power spectrum density is[39-40]. The frequency spectrum density is shown in Fig. 7.
|
Figure 7 Frequency spectrum density of 1/f noise |
The point where the slope of 1/f noise intersects white noise is called the corner frequency[41]. In the corner frequency, the total noise raises because broadband (white) noise and 1/f noise are added. The common operational amplifier can only obtain a 1/f corner frequency in hertz level. And the chopper amplifier can merely obtain the corner frequency with 0.1 Hz. On the other hand, the application frequency of GEMISs is low down to 10-4 Hz, which is lower than the 1/f corner frequency of the general amplifier. Therefore, it is necessary to design the custom preamplifier for GEMISs according to the performance requirement.
If the noise is inherent to the operational amplifier then a commutating auto zero amplifier may be the best route in reducing the 1/f noise[42]. The HTS SQUID picovoltmeter can be used as preamplifier to reduce the amplifier noise, and the noise level of the preamplifier will be decreased to a level of 110pV Hz-1/2[43], but the dynamic performances of such a circuit will be deteriorated. And also, chopper amplifier technology is considered as an effective method to decrease the preamplifier 1/f noise[15, 44-45]. Drung and Storm[46] introduced an ultralow-noise chopper amplifier to restrain the white and 1/f noise in their paper. A CMOS low-noise amplifier using chopper modulation is introduced by Nielsen and Bruun[47]. The application results indicate that the 1/f noise is removed and the measurement bandwidth is extended by adopting the chopper amplifier technology. The basic principles are as follows: firstly, input signal is modulated from low-frequency to high-frequency via using the modulation switch; then, the high-frequency signal is amplified. Note that the amplified low-frequency noise brought by amplifier itself exits in low-frequency band, which does not affect the modulated input signal in high-frequency band. Thirdly, the amplified signal is demodulated to original low frequency, while the low-frequency noise is demodulated oppositely to high-frequency in different band. Finally, the high-frequency noise can be removed through a low pass filter to extract original signal.
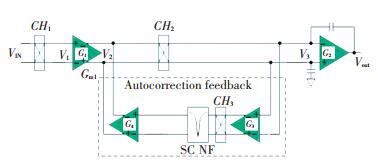
In order to restrain the output voltage drift and ripple, a feedback circuit is applied to the chopper amplifier. And some filter circuits are also necessary to restrain the noise brought by the amplifier itself. The schematic diagram of chopper amplifier is shown in Fig. 8.
|
Figure 8 Schematic diagram of chopper amplifier technology |
In Fig. 8, CH1, CH2 and CH3 are the chopper networks; VIN is the input low-frequency signal; V1 is the modulated high-frequency signal; V2 is the amplified signal of V1; V3 is the demodulated output signal; G1, G2, G3 and G4 are the magnification of transconductance amplifier, and Vout is the amplified low-frequency output signal. The frequency spectrums of signal of chopper amplifier are shown in Fig. 9. Supposed that the frequency spectrum of low-frequency signal VIN induced by magnetic coil is shown in sequence 0 of Fig. 9.

|
Figure 9 Frequency spectrums of signals of chopper amplifier |
During this process, VIN being modulated by CH1 becomes V1 whose frequency is the odd harmonic of the chopper frequency, as shown in Eq.(15):
| $ {V_1}\left( t \right) = {V_{{\rm{IN}}}}\left( t \right)\sum\limits_{k = 1}^\infty {{M_k}\cos \left( {2{\rm{\pi }}{f_{{\rm{chop}}}}kt} \right)} $ | (15) |
wherein, Mk=(4/kπ)sin(kπ/2), which is a Fourier coefficient; fchop is the chopper frequency. The frequency spectrum of the modulated signal is shown in sequence 1 of Fig. 9.
The 1/f noise of amplifier G and white noise will be brought into the signal after the signal is amplified. The frequency spectrum of V2 is shown in sequence 2 of Fig. 9. Blue is the spectrum of the low-frequency input signal and red is the noise spectrum brought by amplifier G.
Generally, the 1/f noise of the amplifier is greater than the amplitude of the low-frequency signal. The effective signal will be overwhelmed by amplifier noise when using a general amplifier to process the signal. In this case, it is difficult to extract the signal from the noise. The spectrum of the input signal is modulated in odd harmonic of chopper frequency, while the spectrum of the 1/f noise is still in low frequency. Therefore, the modulated input signal is only affected by the common voltage noise of operational amplifier. After demodulating, signal V2 becomes V3, whose expression is:
| $ {V_3}\left( t \right) = G{V_{{\rm{IN}}}}\left( t \right)\sum\limits_{k = 1}^\infty {{M_k}\cos \left( {2{\rm{\pi }}{f_{{\rm{chop}}}}kt} \right)} \cdot \sum\limits_{l = 1}^\infty {{M_{\rm{l}}}\cos \left( {2{\rm{\pi }}{f_{{\rm{chop}}}}lt} \right)} $ | (16) |
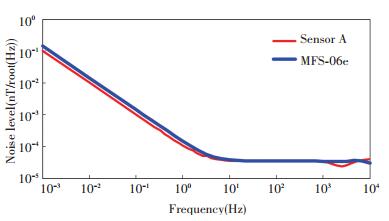
The spectrum of signal V3 is shown in sequence 3 of Fig. 9. The modulated signal moves to original frequency while the 1/f noise spectrum moves to odd harmonic frequency after modulation. Therefore, the 1/f noise spectrum can be removed by using a low pass filter and the input signal can be extracted effectively. The noise level of magnetic sensor can be reduced after adopting chopper technology. The compared theoretical noise level curve between Chinese-made sensor and the MFS-06e (made in Germany) is shown in Fig. 10.
|
Figure 10 Noise level comparison curve between Chinese-made sensor and MFS-06e made in Germany |
As shown in Fig. 10, the theoretical noise level of the Chinese-made sensor is lower than that of the MFS-06e in one order of magnitude.
In general, the preamplifier of the chopper amplifier should have high input impedance and output voltage. In addition, the magnetic signal obtained by GEMIS is quite weak, to improve SNR of the signal, the preamplifier should have a very low noise. If the equivalent input noise of the preamplifier is high, the turns number of the coil should be increased to obtain higher output voltage. However, the result is that the weight of GEMIS is greater and the thermal noise voltage increases because of the increased internal resistance of the coil. The equivalent input noise of the integrated operational amplifier with lowest input noise is 0.3 nV/
As well known, the magnetic sensor is capable of transforming the magnetic signal into electrical signal to data acquisition system. The electrical signal, representing magnetic field signal, should be reverted to actual magnetic field intensity prior to process. Therefore it is necessary to obtain the calibration curve that indicates the relationship between the magnetic field intensity and the electrical signal (magnitude and phase) in different frequency[50-51]. In addition, the performance specifications of magnetic sensor will be changed after used period of time. Therefore, the magnetic sensor should be calibrated under a certain working condition before measuring the magnetic field.
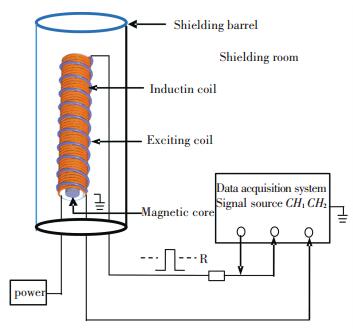
So far, there are two devices used for producing excitation field, one is Helmhotlz coil[7] and the other is solenoid coil[23]. Pulz introduced a calibration facility for search coil magnetometers. And its usable frequency range of 10 mHz to 100 kHz enables calibration of all standard types of search coil magnetometer[52]. The calibration schematic of magnetic sensor is shown in Fig. 11.
|
Figure 11 Schematic diagram of calibration |
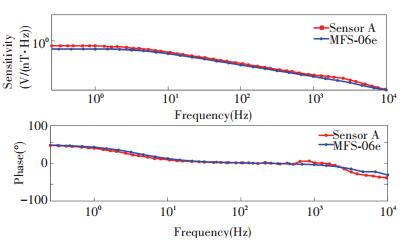
According to the theoretical analysis and experimental testing, the solenoid was utilized to produce the magnetic field for calibration because of its uniform internal distribution[53-54]. A 1 nT standard unit magnetic field is generated from an excitation signal in certain frequency to solenoid when calibrating. In this case, the sensitivity of the magnetic sensor at this frequency is 1 nV/nT when the response voltage of magnetic sensor is 1 nV. As a result, the calibration can be completed by plotting the dynamic sensitivity curve, which is fitted via some measured sensitivity values at certain frequencies. To avoid electromagnetic interference, especially the noise at power line frequency, the calibration system was built in the shielding room, and the magnetometer was placed inside the shielding barrel which is far away from city environment. The calibration system is current driven by the tracking generator output from a spectrum analyzer (35670A). The frequency response of Chinese-made magnetic sensor and MFS-06e sensor made in Germany (amplitude-frequency curve, phase-frequency curve) are shown in Fig. 12.
|
Figure 12 The sensitivity amplitude/phase of Chinese-made magnetometer and MFS-06e |
As can be seen from Fig. 12, the sensitivity curve of the magnetic field sensor (amplitude and frequency) in the low frequency remains substantially constant, the attenuation is higher than the start frequency of 10 Hz. The phase shift is ~0° in the mid-frequency band (10 Hz-1 kHz). And phase shift is in the range of -90°-+90° during the entire frequency band. The acquisition signal of magnetic sensor can be expressed real information after converting from calibration curve.
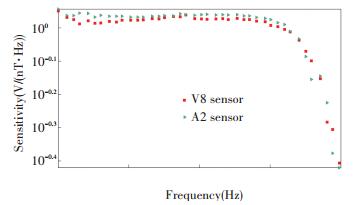
The sensitivity test is done in the field. And the test frequency band is 1 Hz to 10 kHz. The sensitivity comparison curve between the Chinese-made magnetometer (A2 sensor) and the magnetometer equipped for V8 measuring system is shown in Fig. 13. The contrast result shows that the sensitivity curves are well consonant with each other except for some values at low frequency.
|
Figure 13 Sensitivity amplitude of Chinese-made magnetometer (A2) and magnetometer equipped for V8 system |
4 Controllable Magnetotelluric Exploration Results of the Chinese-made GEMISs
In recent years, our country has invested a lot of manpower in the development of the GEMISs. The Chinese-made GEMIS is gradually beginning to play an important role in geophysical exploration. The exploration results are even more precise than those of foreign instruments.
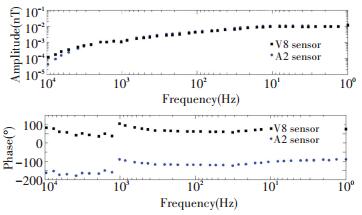
In some one field experiment (frequency band: 1 Hz-10 kHz), the magnetic field data is obtained respectively using Chinese-made magnetometer (A2) and the magnetometer equipped for V8 measuring system. The amplitude and phase comparison chart of the two GEMISs are shown in Fig. 14. And the magnetic field obtained by the two GEMISs is in basic agreement on the amplitude. However, there is phase deviation (180°) between the two magnetic sensors due to data processing. This phase deviation will be corrected by post data processing.
|
Figure 14 Magnetic field measurement results (amplitude, phase) by Chinese-made magnetometer and magnetometer equipped for V8 system |
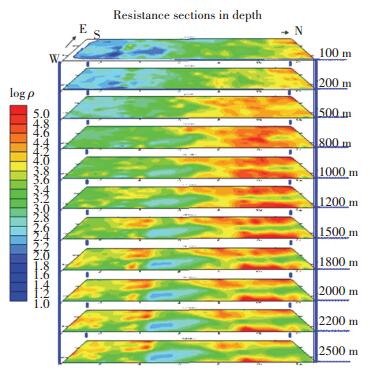
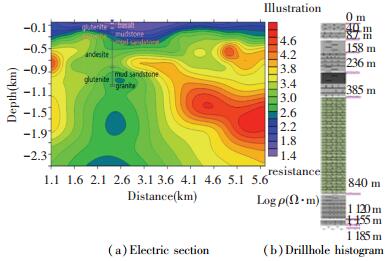
The College of Instrumentation & Electrical Engineering of Jilin University has developed the JLEM-Ⅲ model controllable audio magnetotelluric instrument. Explorers explored and surveyed the Qitai River area of Heilongjiang in 2011 and 2012. The exploration focused on basic oil-gas exploration on the deep part and periphery of the Songliao Basin. Fig. 15 shows the horizontal resistivity section of the Qitai River surveying area. It shows the geological structure characteristic of the survey area, and the low-resistance area and fracture zone in the deep part which have also been discovered. The effective depth of that exploration reached to 2 500 m. Fig. 16 shows the comparisons between surveying line interpretation results and drillhole (ZK06-1) data on the north side of a farm in a Boli county town. It also shows the low-resistance fracture zone in the deep part of the surveying area. The surveying results are in agreement with the drillhole data.
|
Figure 15 The horizontal resistivity section of the Qitai River surveying area |
|
Figure 16 The comparisons between surveying line interpretation results and drillhole (ZK06-1) data on the north side of a farm in a Boli county town |
5 Conclusions and Prospects
Due to the above mentioned technologies, the GEMIS has advantages: low sensitivity threshold and noise value, high stability and sensitivity, broad frequency band and so on. But its disadvantages are big size and heavy weight. So it is necessary to analyze the equivalent circuit of induction magnetometer, and to give out the formulas of optimization values of the sensor's basic parameters. For example, quasi random or subsection coiling mode is adopted to minish distributing capacitance and to get higher resonance frequency. Due to the thermal noise influence of the preamplifier and coil, the turns of coils should be increased to obtain resolvable induction voltage, but this operation caused large volume and heavy weight. Therefore, the requirements of sensor sensitivity and size on coil turns is inconsistent if the problem of preamplifier noise is not resolved. And the miniaturization is the development direction in the future. Design and application of low noise preamplifier is also the problem to solve. By far, the lowest thermal noise of the preamplifier can reach 0.3 nV/
| [1] |
Tian Yongwei, Geng Shengli. Research and development on brand-band and ultra-low-frequency magnetic sensor.
Sensor World, 2008, 14(8): 31-34.
( 0) 0)
|
| [2] |
Chen Xiaodong, Zhao Yi, Feng Xiaolan. The development of an inductive sensor for TEM.
Geophysical and Geochemical Exploration, 2013, 37(1): 88-91.
( 0) 0)
|
| [3] |
Tang Jingtian, Luo Weibin, Liu Changsheng. Impulse response of seafloor hydrocarbon reservoir model.
Chinese Journal of Geophysics, 2008, 51(6): 1929-1935.
( 0) 0)
|
| [4] |
Tumanski S. Induction coil sensors-A review.
Measurement Science and Technology, 2007, 18(3): 31-46.
DOI:10.1088/0957-0233/18/3/R01 ( 0) 0)
|
| [5] |
Ripka P. Noise and stability of magnetic sensors.
Journal of Magnetism and Magnetic Materials, 1996(157/158): 424-427.
( 0) 0)
|
| [6] |
Palangio P, Masci F, Di Persio M, et al. Electromagnetic field measurements in ULF-ELF-VLF[0.001Hz-100kHz] bands.
Advances in Geosciences, 2008, 14: 69-73.
DOI:10.5194/adgeo-14-69-2008 ( 0) 0)
|
| [7] |
Prance R J, Clark T D, Prance H. Ultra low noise induction magnetometer for variable temperature operation.
Sensors and Actuators, 2000, 85: 361-364.
DOI:10.1016/S0924-4247(00)00375-7 ( 0) 0)
|
| [8] |
Séran H C, Fergeau P. An optimized low-frequency three-axis search coil magnetometer for space research.
Review of Scientific Instruments, 2005, 76(4): 044502-1.
DOI:10.1063/1.1884026 ( 0) 0)
|
| [9] |
Matzander U.
MFS-06e Broadband Induction Coil Magnetometer. Braunschweig: Metronix Measurement Instruments and Electronix Ltd., 2001.
( 0) 0)
|
| [10] |
Ju Hanji, Zhu Wanhua, Fang Guangyou. A review on ferromagnetic induction coil sensors.
Progress in Geophysics, 2010, 25(5): 1870-1876.
( 0) 0)
|
| [11] |
Wang Yanzhang, Cheng Defu, Wang Jun, et al. Research of broad frequency difference magnetic field sensor based on nanocrystalline alloy.
Chinese Journal of Sensors and Actuators, 2007, 20(9): 1967-1970.
( 0) 0)
|
| [12] |
Shao Yingqiu.
Development of Broadband Inductive Magnetic Sensor. Changchun: Jilin University, 2012.
( 0) 0)
|
| [13] |
Chen Xingming.
Research of Magnetic Field Sensor in AMT. Changsha: Central South University, 2012.
( 0) 0)
|
| [14] |
Laurel Company.
EH-4 electromagnetic instrument operation and technical manual. California: Laurel Company, 1998.
( 0) 0)
|
| [15] |
Zhu Wanhua, Di Qingyun, Liu Leisong, et al. Development of search coil magnetometer based on magnetic flux negative feedback structure.
Chinese Journal of Geophysics, 2013, 56(11): 3683-3689.
DOI:10.6038/cjg20131109 ( 0) 0)
|
| [16] |
Cavoit C. Closed loop applied to magnetic measurements in the range of 0.1-50 MHz.
Review of Scientific Instruments, 2006, 77: 064703-1-064703-7.
DOI:10.1063/1.2214693 ( 0) 0)
|
| [17] |
Clerc G, Gilbert D. La Contre-réaction de flux appliquée aux bobines à noyau magnétique utilisées pour l'enregistrement des variations rapides du champ magnétique, Ann.
Géophys., 1964, 20: 499-502.
( 0) 0)
|
| [18] |
Micheel H J. Induktionsspulen mit induktiver Gegenkopplung als hochaufl sende Magnetfeldsonden (The coil with inductive feedback used as magnetic field sensor) NTZ Archiv, 1987, 9: 97-102.
( 0) 0)
|
| [19] |
Zhang Haixia, Zhao Yingjun, Yang Shuzi. Design and optimization of a novel co-based amorphous magnetic field sensor.
Chinese Journal of Sensors and Actuators, 1998, 2: 7-12.
( 0) 0)
|
| [20] |
Paperno E, Grosz A. A miniature and ultralow power search coil optimized for a 20 mHz to 2 kHz frequency range.
Journal of Appplied Physics, 2009, 105: 07E.
DOI:10.1063/1.3072718 ( 0) 0)
|
| [21] |
Prance R J, Clark T D, Prance H. Compact broadband gradiometric induction magnetometer system.
Sensors and Actuators, 1999, 76: 117-121.
DOI:10.1016/S0924-4247(98)00363-X ( 0) 0)
|
| [22] |
Pronenko V, Korepanov V. Induction magnetometers-design peculiarities.
Sensors & Transducers Journal, 2010, 120: 92-106.
( 0) 0)
|
| [23] |
Yan Bin, Zhu Wanhua, Liu Leisong, et al. An optimization method for induction magnetometer of 0.1 mHz to 1 kHz.
IEEE Transactions on Magnetics, 2013, 49(10): 5294-5300.
DOI:10.1109/TMAG.2013.2264821 ( 0) 0)
|
| [24] |
Chen Xingming, Song Gang, Zhou Sheng, et al. Development of magnetic sensor in audio-frequency magnetotelluric sounding.
The Chinese Journal of Nonferrous Metals, 2012, 22(3): 922-927.
( 0) 0)
|
| [25] |
Coillot C, Moutoussamy J, Lebourgeois R, et al. Principle and performance of a dual-band search coil magnetometer: A new instrument to investigate fluctuating magnetic fields in space.
IEEE Sensors Journal, 2010, 10(2): 255-260.
DOI:10.1109/JSEN.2009.2030977 ( 0) 0)
|
| [26] |
Marycko M, Krupicka S. Calculation of the eddy current loss in a ferrite core.
Journal of Magnetism and Magnetic Materials, 1996, 157: 469-470.
DOI:10.1016/0304-8853(95)01138-2 ( 0) 0)
|
| [27] |
Mizuno T, Enoki S, Suzuki T, et al. Reduction of eddy current loss in magnetoplated wire.
COMPEL -The International Journal for Computation and Mathematics in Electrical and Electronic Engineering, 2009, 28: 57-66.
DOI:10.1108/03321640910918869 ( 0) 0)
|
| [28] |
Uchiyama Susumu.
Application of Magnetism. Tianjin: Tianjin Science and Technology Press, 1983.
( 0) 0)
|
| [29] |
Osborn J A. Demagnetizing factors of the general ellipsoid.
Physical Review, 1945, 67: 351-357.
DOI:10.1103/PhysRev.67.351 ( 0) 0)
|
| [30] |
Chen Zhiyi, Zhou Suihua, Jiang Anlin. Miniaturization design on magnetic induction sensors. Proceedings of the 2011 International Conference on Electronic & Mechanical Engineering and Information Technology.
Piscataway:IEEE, 2011: 4626-4629.
DOI:10.1109/EMEIT.2001.6024006 ( 0) 0)
|
| [31] |
Hong Zehong, He Naiming, Wang Zhanhui, et al. Technology problems of magnetic sensor design.
Journal of Naval University of Engineering, 2005, 17(5): 72-77.
( 0) 0)
|
| [32] |
Bao Binghao, Wu Wei, Hu Enqiu. Study of the new magnetic sensor using single amorphous wise core and double winding closed loop system.
Journal of Electronic Measurement and Instrument, 2001, 15(3): 61-63.
( 0) 0)
|
| [33] |
Doug DeMaw M F.
Ferromagnetic Core Design Application Handbook. New York: Longman Higher Education, 1981.
( 0) 0)
|
| [34] |
Prance R J, Clark T D, Prance H. Compact room-temperature induction magnetometer with superconducting quantum interference device level field sensitivity.
Review of Scientific Instrument, 2003, 74(8): 3735-3739.
DOI:10.1063/1.1590745 ( 0) 0)
|
| [35] |
Kazuaki Abe, Jun-ichi Takada. Simulation and design of a very small magnetic core loop antenna for an LF receiver.
Ieice Transactions on Communications, 2007, E90-B(1): 122-130.
DOI:10.1093/ietcom/e90-b.1.122 ( 0) 0)
|
| [36] |
Coillot C, Moutoussamy J, Chanteur G, et al. Improvements on the design of search coil magnetometer for space experiments.
Sensor Letters, 2007, 5(1): 167-170.
DOI:10.1166/sl.2007.050 ( 0) 0)
|
| [37] |
Grosz A, Paperno E, Amrusi S, et al. Integration of the electronics and batteries inside the hollow core of a search coil.
Journal of Applied Physics, 2010, 107: 09E703-1-09E703-3.
( 0) 0)
|
| [38] |
Grosz A, Paperno E, Amrusi S, et al. A three-axial search coil magnetometer optimized for small size, low power, and low frequencies.
IEEE Sensors Journal, 2011, 11(4): 1088-1094.
DOI:10.1109/JSEN.2010.2079929 ( 0) 0)
|
| [39] |
Talmat R, Achour H, Cretu B, et al. Low frequency noise characterization in n-channel FinFETs.
Solid State Electronics, 2012, 70: 20-26.
DOI:10.1016/j.sse.2011.11.007 ( 0) 0)
|
| [40] |
Ioannidis E G, Haendler S, Dimitriadis C A, et al. Characterization and modeling of low frequency noise in CMOS inverters.
Solid State Electronics, 2013, 81: 151-156.
DOI:10.1016/j.sse.2012.12.001 ( 0) 0)
|
| [41] |
Yan K T, Forbes L. A model for the 1/f noise corner frequency of FETs on semi-insulating substrates based on bulk phenomena: Theory and experiments.
Solid State Electronics, 1996, 39: 857-861.
DOI:10.1016/0038-1101(95)00274-X ( 0) 0)
|
| [42] |
Lekkala J O, Malmivuo J A V. Noise reduction using a matching input transformer.
Journal of Physics E Scientific Instruments, 1981, 14: 939-942.
DOI:10.1088/0022-3735/14/8/012 ( 0) 0)
|
| [43] |
Erikssona T, Blomgren J, Winkler D. An HTS SQUID picovoltmeter used as preamplifier for Rogowski coil sensors.
Physica C, 2002, 368: 130-133.
DOI:10.1016/S0921-4534(01)01153-4 ( 0) 0)
|
| [44] |
Jander A, Nordman C A, Pohm A V, et al. Chopping techniques for low-frequency nanotesla spin-development tunneling field sensors.
Journal of Applied Physics, 2003, 93: 8382-8384.
DOI:10.1063/1.1555975 ( 0) 0)
|
| [45] |
Mars K, Kawahito S. A single-ended CMOS chopper amplifier for 1/f noise reduction of n-channel MOS transistors.
IEICE Electronics Express, 2012, 9(2): 98-103.
DOI:10.1587/elex.9.98 ( 0) 0)
|
| [46] |
Drung D, Storm J-H. Ultralow-noise chopper amplifier with low input charge injection. Proceedings of the 2010 Conference on Precision Electromagnetic Measurements.
Daejeon, 2010: 759-760.
( 0) 0)
|
| [47] |
Nielsen J H, Bruun E. A CMOS low-noise instrumentation amplifier using chopper modulation.
Analog Integrated Circuits and Signal Processing, 2005, 42(1): 65-76.
DOI:10.1007/s10470-004-6849-8 ( 0) 0)
|
| [48] |
Feng Shimin, Zhou Suihua, Chen Zhiyi. A very low noise preamplifier for extremely low frequency magnetic antenna.
Journal of Semiconductors, 2013, 34(7): 075003-1.
DOI:10.1088/1674-4926/34/7/075003 ( 0) 0)
|
| [49] |
Coillot C, Leroy P. Induction magnetometer principle, modeling and ways of improvement.
Magnetic Sensors, 2012, 9: 45-64.
( 0) 0)
|
| [50] |
Jiang Anlin, Zhou Suihua, Zhang Xiaobing, et al. Design of the induction coil sensors.
Marine Electric & Electronic Technology, 2011, 31(12): 35-37.
( 0) 0)
|
| [51] |
Xie Shilin, Chen Shenglai, Zhang Xinong, et al. Neural network hybrid modeling method for transducer calibration.
Journal of Mechanical Engineering, 2010, 46(22): 6-15.
DOI:10.3901/JME.2010.22.006 ( 0) 0)
|
| [52] |
Pulz E. A calibration facility for search coil magnetometers.
Institute of Physics Publishing, 2002, 13: 49-51.
( 0) 0)
|
| [53] |
Wan Yunxia, Wang Yanzhang, Cheng Defu. Research on the processing method of calibration magnetic field for inductive magnetic sensor.
Chinese Journal of Sensors and Actuators, 2013, 26(4): 520-524.
( 0) 0)
|
| [54] |
Chen Zhiyi, Zhou Suihua, Wu Zhidong. Optimization of induction magnetic sensors at lower frequency.
Journal of Sichuan Ordnance, 2013, 34(4): 123-126.
DOI:10.1590/S1516-14392008000200006 ( 0) 0)
|
| [55] |
Asaf Grosz, Eugene Paperno, Shai Amrusi, et al. Minimizing crosstalk in three-axial induction magnetometers.
Review of Scientific Instruments, 2010, 81: 125106-1.
DOI:10.1063/1.3509392 ( 0) 0)
|
 2017, Vol. 24


