2. University of Chinese Academy of Sciences, Beijing 100049, China
Total Solar Irradiance (TSI) study is necessary to understand different contributions to global climate changes[1-5]. Increasing number of Total Solar Irradiance Radiometers (TSIRs) has conducted long-term high-precision measurement on space platforms since 1970, including the Differential Absolute Radiometers (DIARADs) of Royal Meteorological Institute of Belgium (RMIB)[6], the Active Cavity Radiometer Irradiance Monitors (ACRIMs) of the National Aeronautics and Space Administration (NASA)[7], the POM-6 type radiometer of World Radiometer Center (WRC)[8], etc. The Total Solar Irradiance Monitors (TSIMs), developed by Changchun Institute of Optics, Fine Mechanics and Physics (CIOMP) for China Meteorological Administration (CMA), have been operated on the Feng Yun-3A satellites (FY-3A) for nearly seven years since 2008[9-11]. The TSIM/FY-3B and TSIM/FY-3C were separately launched on 2010 and 2014[12-14].
In order to calibrate different space-born TSIRs, the ground-based absolute radiometers are applied to transfer World Radiance Reference (WRR). WRR is established by World Meteorological Organization (WMO)[15]. WMO conducts International Pyrheliometers Comparison (IPC) at WRC every five years. The transfer radiometers are calibrated by the comparison measurement of solar irradiance. The TSIRs' traceability to WRR can be obtained by the transfer radiometers.
Solar Irradiance Absolute Radiometer (SIAR) is the transfer radiometer for calibrating TSIMs, and has attended IPC for three times[16]. SIAR adopts electrical substitution principle[17]. The solar irradiance is absorbed by the detector of SIAR, resulting in a temperature rise. When the temperature rise reappeared with an equivalent electrical power, the solar irradiance can be obtained by precisely measuring the equivalent electrical power. The relationship between temperature response and heating power is named as sensitivity. The sensitivity is an important parameter for estimating equivalent electrical power. And the measurement result of SIAR should be corrected by the sensitivity, because of the non-equivalence between optical and electrical heating[18].
In the practical comparison experiment, the sun is the optical source. The solar irradiance is depended on the atmospheric condition. For higher radiant power, SIAR can obtain a measure precision superior to 0.08%[19]. But the measure precision rapidly decreases with the reduction of the radiant power. This problem is investigated and solved in this paper.
The sensitivity is assumed as linear within the whole measurement interval in the traditional method[19]. But the sensitivity has nonlinearity. The nonlinearity comes from complex factors, including the radiant power, the ambient temperature drift, and the convection environment[20]. Thus this assumption leads to a system error, which decreases the measure precision. The traditional method needs an optimization to compensate the system error[21].
In this paper, the nonlinearity of sensitivity is experimentally investigated and corrected. Based on the interpolation approximation principle, an optimization method is proposed to improve the measure precision[22-23]. The optimization method is adopted by the fourth generation of SIAR. The comparison experiment results illustrate that the system error of sensitivity nonlinearity is compensated by the real-time interpolation approximation. Due to the improvement of measure precision, the optimization method significantly improves the calibration precision of ground-based comparison experiment. The investigation of sensitivity nonlinearity also provides the theoretical and experimental basis for optimizing the on-orbit calibration precision for TSIM.
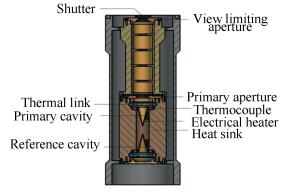
2 SIAR Fundamentals 2.1 Detector DesignThe diagrammatic sketch of SIAR is shown in Fig. 1. The primary cavity and the reference cavity constitute the detector of SIAR. They are weakly linked to the heat sink. The cavities and heat sink constitute a heat conduction structure. When loading an invariable power on the primary cavity, the heat conduction structure obtains a thermal equilibrium state. Normally, the establishment time of thermal equilibrium state is between 7τ and 10τ. The τ is the thermal time constant of primary cavity.
|
Figure 1 Detector structure of SIAR |
2.2 Equilibrium Temperature
In practical engineering application, the output voltage of thermocouple represents the temperature variation of primary cavity. Therefore the output voltage of thermocouple is named as temperature voltage. Meanwhile, the temperature voltage at thermal equilibrium state is named as the equilibrium temperature. Each thermal equilibrium state corresponds to a unique equilibrium temperature.
2.3 Electrical Substitution PrincipleSIAR applies the principle of photoelectric equivalence. When the shutter is opened, the primary cavity absorbs solar irradiance. Then the equilibrium temperature is obtained. This process is called irradiance observation. When the shutter is closed, the primary cavity is only heated by electrical power. The electrical power is adjusted in order to get the same equilibrium temperature with irradiance observation. This process is called electrical calibration. The adjusted electrical power is named as the equivalent electrical power. The solar irradiance is obtained by precisely measuring the equivalent electrical power.
3 Optimization Method PrincipleIn order to compensate the nonlinearity error of sensitivity nonlinearity, an optimization method is proposed. Based on the interpolation approximation principle, the real-time correction sensitivity is obtained by two point interpolation approximation.
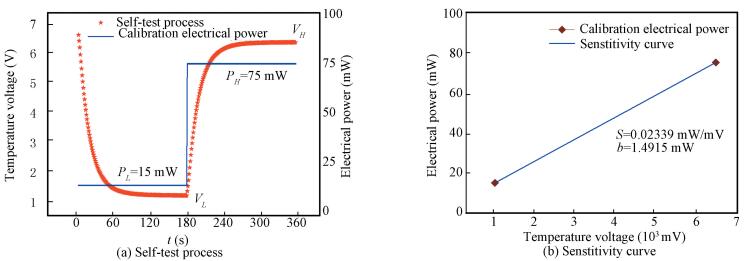
3.1 Self-test ProcessBefore the irradiance measurement, the shutter is closed. Two calibration electrical powers (PL and PH) are respectively loaded on the primary cavity, resulting in the temperature variations as shown in Fig. 2(a). Then the equilibrium temperatures (VL and VH) are obtained. The sensitivity (S) of SIAR is calculated by
|
Figure 2 Self-test of SIAR |
| $ S = \left( {{P_H} - {P_L}} \right)/\left( {{V_H} - {V_L}} \right) $ | (1) |
where S is used to approximately represent the sensitivity of the wide power interval (PL-PH) as shown in Fig. 2(b). This process is called Self-test. When an equilibrium temperature (V) is obtained, the corresponding electrical power (PE) can be calculated by
| $ {P_E} = S \cdot V - b $ | (2) |
where b is the intercept of sensitivity curve.
3.2 Measurement ProcedureThe optimization method has one irradiance observation and two electrical calibrations as shown in Fig. 3. Before the irradiance observation, the primary cavity is warmed by PE1, resulting in an equilibrium temperature of V1.

|
Figure 3 The measurement process of optimization method consists of irradiant observation and electrical calibrations |
The shutter is opened before the irradiance observation. The primary cavity absorbs PO. Meanwhile a compensation electrical power (PE2) is calculated and loaded on the primary cavity in order to maintain the equilibrium temperature of V1[17]. Due to the non-equivalence between optical and electrical heating, the equilibrium temperature of irradiance observation is V2. Shutter is closed before the electrical calibrations. According to V2, the primary cavity is only heated by the electrical power (PE3) calculated by Eq. (2). The equilibrium temperature of the first electrical calibration is V3.
In the second electrical calibration, the primary cavity is heated by the electrical power (PE4), which is expressed as
| $ {P_{E4}} = {P_{E3}} + S \cdot \left( {{V_2} - {V_3}} \right) $ | (3) |
The equilibrium temperature of the second electrical calibration is V4. The real-time correction sensitivity (S1) is obtained by two point interpolation approximation. Then S1 is calculated by
| $ {S_1} = \left( {{P_{E4}} - {P_{E3}}} \right)/\left( {{V_4} - {V_3}} \right) $ | (4) |
Then PO is derived by
| $ {P_O} = {P_{E3}} - {P_{E2}} + {S_1} \cdot \left( {{V_2} - {V_3}} \right) $ | (5) |
The area (A) of primary aperture is determined at high accuracy. Meanwhile the absorptivity (ρ) of primary cavity is precisely measured. The calibration coefficient (ε) is obtained by the calibration experiment. Thus solar irradiance (E) is calculated by
| $ E = \frac{{\varepsilon {P_O}}}{{\rho A}} $ | (6) |
However, the traditional method only has one electrical calibration, and uses S to calculate PO. Thus PO is given by
| $ {P_O} = {P_{E3}} - {P_{E2}} + S \cdot \left( {{V_2} - {V_3}} \right) $ | (7) |
where S1 is obtained in the solar irradiance measurement process, and represents the sensitivity of the little power interval (PE3-PE4). Compared with the traditional method, the system error of sensitivity is compensated by real-time correction. Thus the optimization method can improve measure precision.
4 Sensitivity Nonlinearity InvestigationS and S1 are experimentally measured, so as to investigate the nonlinearity effects to the measure precision of SIAR.
4.1 Sensitivity Measurement 4.1.1 Equipment set upLaser radiant power (λ=532 nm) is the optical source. The laser radiant power is modulated by power stabilizer in order to improve the stability. The Semi-reflecting mirror separates the laser radiant power into a single optical path and a reference optical path as shown in Fig. 4. The single optical path is measured by SIAR. The reference optical path is used for monitoring the stability of laser radiant power. The reference optical path enters the integrating sphere, resulting in a response voltage of photodiode (Hamamatsu S1406). The response voltage is measured by a digital multimeter (Keithley 2 700). The different power level of single optical path is obtained by regulating the attenuator. Then S1 is repeatedly measured at different radiant power level.

|
Figure 4 Experiment equipment of sensitivity measurement |
4.1.2 Experiment result
S is measured according to the method of self-test. S1 is repeatedly measured at different radiant power level. The average relative standard deviation (σr1) of S1 is calculated by
| $ {\sigma _{r1}} = \frac{1}{N}\sum\limits_{j = 1}^N {\left[ {\frac{1}{{{\mu _j}}}\sqrt {\frac{1}{{n - 1}}\sum\limits_{i = 1}^n {{{\left( {{S_{1ji}} - {\mu _j}} \right)}^2}} } } \right]} $ | (8) |
where N is the irradiance power levels; n is the measurement times; S1ji is the measurement results; μj is the average value of S1j.
The sensitivity nonlinearity is represented by the average relative nonlinearity error (σr2), which is calculated by
| $ {\sigma _{r2}} = \frac{1}{N}\sum\limits_{j = 1}^N {\left[ {\frac{1}{{{\mu _j}}}\sqrt {\frac{1}{{n - 1}}\sum\limits_{i = 1}^n {{{\left( {{S_{1ji}} - S} \right)}^2}} } } \right]} $ | (9) |
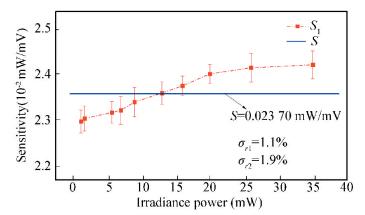
At different radiant power level, the sensitivity of SIAR is obviously nonlinear as shown in Fig. 5.
|
Figure 5 The nonlinearity of sensitivity |
When the sensitivity of SIAR is assumed as linear, the relative system error (σr3) of S is expressed as
| $ {\sigma _{r3}} = \sqrt {\sigma _{r1}^2 + \sigma _{r2}^2} $ | (10) |
The measurement result illustrates that σr3 is 2.2%, and S is 0.023 70 mW/mV. Thus the systemic error (σ3) of S is 0.000 521 mW/mV.
4.2 Precision AnalysisAccording to Eq. (4) and Eq. (5), the relative precision (δr) of SIAR is expressed by
| $ {\delta _r} = \sqrt {2\delta _{r1}^2 + 2\delta _{r2}^2 + \delta _{r3}^2} $ | (11) |
where δr1 (≈0.041%) is the relative measure precision of electrical power; δr2 (≈0.040%) is the relative measure precision of temperature voltage; δr3 is the relative precision of sensitivity. δr3 can be calculated by
| $ {\delta _{r3}} = \frac{{\left( {{V_2} - {V_3}} \right){\sigma _3}}}{{{P_O}}} = \frac{{\mu {\sigma _3}}}{{{P_O}}} $ | (12) |
where μ is the deviation between V2 and V3.
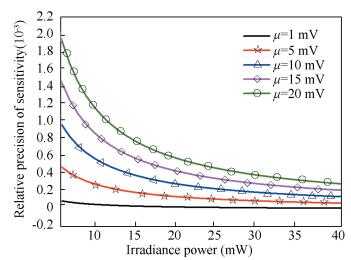
The μ is random in practical measurement, and changes in the range of 1 mV to 20 mV. δr3 and PO are inversely related as shown in Fig. 6. When PO is large enough, δr3 is smaller than 2.0×10⁻⁴, which is little enough to be neglected compared with δr1 and δr2. Then the optimal δr is 0.08%. In case of μ is 10 mV. When PO is larger than 30 mW, δr3 is lower than 0.02%. Then δr3 can be neglected. When PO is lower than 20 mW, δr3 is more than 0.03%. δr3 cannot be neglected in this situation. This result explains that the measurement precision of SIAR rapidly decreases with the irradiance reduction.
|
Figure 6 The relationship between δr3 and PO |
5 Comparison Experiment
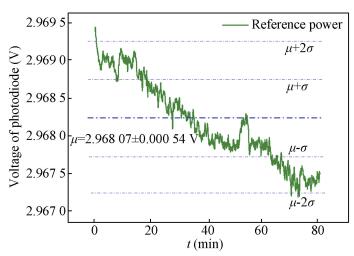
The precisions of optimization method and traditional method are compared by the experiment equipment in Fig. 4. The stability of laser radiant power is better than 0.02% within 80 min as shown in Fig. 7. The laser radiant powers at each power level are respectively measured by traditional method and optimization method.
|
Figure 7 Stability of laser radiant power |
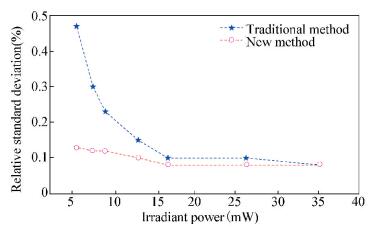
The optimization method obtains a better measurement precision approximated to 0.1% as shown in Fig. 8. The measure precision of traditional method rapidly decreases with the reduction of irradiant power. The comparison result illustrates that the system error of sensitivity is compensated by real-time correction. Thus the optimization method improves the measure precision of SIAR.
|
Figure 8 Measurement result comparison |
6 Application in External-Field Calibration Experiment
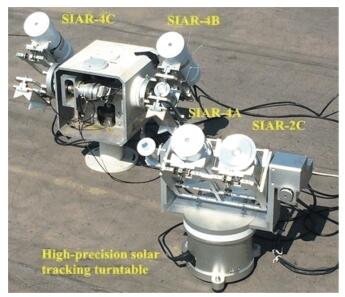
The fourth generation of SIAR is manufactured for the coming IPC-Ⅻ. They are named as SIAR-4A, SIAR-4B and SIAR-4C. Before attending IPC-Ⅻ, SIARs are tested by External-Field calibration experiment. The second generation SIAR, which is named as SIAR-2C, is adopted as the transfer detector.
SIAR-2C, SIAR-4A, SIAR-4B and SIAR-4C are installed on the high-precision solar tracking turntables as shown in Fig. 9. The solar irradiance is used as optical source. Based on GPS and servo control system, the high-precision solar tracking turntables can guarantee the same solar irradiance to be absorbed by SIARs. Meanwhile SIARs start and finish measurement at the same time.
|
Figure 9 External-field calibration experiment |
SIAR-2C has attended IPC-Ⅹ, obtaining the calibration coefficient (ε) of 0.999 839. The WRR irradiance (EWRR(i)) can be calculated by
| $ {E_{WRR}}\left( i \right) = 0.999839 \times {E_{SIAR - 2C}}\left( i \right),\left( {i = 1,2, \cdots ,N} \right) $ | (13) |
where ESIAR-2C(i) is the irradiance measurement result of SIAR-2C. N is the total measurement number. Calibration coefficient is calculated by
| $ \varepsilon = \frac{{\sum\limits_{i = 1}^N {{E_{WRR}}\left( i \right)/{E_{SIAR}}\left( i \right)} }}{N},\left( {i = 1,2, \cdots ,N} \right) $ | (14) |
where ESIAR is the irradiance measurement result of SIAR. The calibration precision (σε) is expressed as
| $ {\sigma _\varepsilon } = \sqrt {\frac{{\sum\limits_{i = 1}^N {\left[ {{E_{WRR}}\left( i \right)/{E_{SIAR}}\left( i \right) - \varepsilon } \right]} }}{{N - 1}}} ,\left( {i = 1,2, \cdots ,N} \right) $ | (15) |
The traditional method is adopted by SIAR-4A and SIAR-4C. The optimization method is adopted by SIAR-4B. The calibration coefficients are obtained as shown in Table 1. The differences (d) between WRR and the new generation SIARs are respectively 0.001 3, 0.000 5 and 0.001 5. The calibration precisions of new generation SIARs satisfy the IPC standard. Meanwhile, σε-SIAR-4A=0.001 1, σε-SIAR-4B=0.000 7, σε-SIAR-4C=0.001 2. Thus the optimization method improves the calibration precision as shown in Fig. 10.
| Table 1 Calibration coefficient of the fourth generation SIAR |

|
Figure 10 The result of External-Field calibration experiment |
Measurement results (E) and relative standard deviations (σ) at five irradiance power levels are shown in detail. When the solar irradiance is higher than 700 W/m2, the relative standard deviations of the two methods are both approximated to 0.08% as shown in Table 2. With the reduction of solar irradiance, the relative standard deviation of optimization method is stable at 0.1%. But the relative standard deviation of traditional method changes from 0.1% to 0.3%. Thus, due to the improvement of measure precision, the optimization method significantly improves the calibration precision of SIAR.
| Table 2 Measurement result in different irradiance power |
7 Conclusions
The fourth generation of SIAR is optimized both in measurement method and development technology, in order to attend IPC-Ⅻ. In the past, there is a problem that the measure precision of SIAR rapidly decreases with the reduction of irradiance power. The optimization of calibration method is introduced in this paper.
The sensitivity is assumed as linearity within the whole measurement interval in the traditional method. The sensitivity of SIAR is experimentally investigated and corrected. When the sensitivity is assumed as linear, the relative system error of nonlinearity is 2.2%. The system error cannot be neglected for little solar irradiance measurement. Thus the sensitivity nonlinearity reduces measure precision. In order to compensate the sensitivity nonlinearity, the optimization method is proposed based on the interpolation approximation principle. During the irradiance measurement process, the real-time correction sensitivity is obtained by two point interpolation approximation. The real-time correction sensitivity represents the sensitivity of the little radiant power interval, which is exceedingly close to the solar irradiance power. The comparison experiment result illustrates that the optimization method compensates the system error of sensitivity nonlinearity, and obtains a stable measure precision approximated to 0.1%.
The optimization method is adopted by the fourth generation SIAR. The experimental results illustrate that the optimization method significantly improves the calibration precision of ground-based comparison experiment. Influenced by the measure environment on satellite, the sensitivity of TSIM has also nonlinearity. The investigation of sensitivity nonlinearity also provides the theoretical and experimental basis for optimizing the on-orbit calibration precision for TSIM.
| [1] |
Willson R C. Active cavity radiometer.
Applied Optics, 1973, 12: 810-817.
DOI:10.1364/AO.12.000810 ( 0) 0)
|
| [2] |
Willson R C. Active cavity radiometer type Ⅳ.
Applied Optics, 1979, 18: 179-188.
DOI:10.1364/AO.18.000179 ( 0) 0)
|
| [3] |
Mecherikunnel A. A comparative study of solar total irradiance measured by active-cavity radiometers.
Metrologia, 1993, 30: 271-273.
DOI:10.1088/0026-1394/30/4/010 ( 0) 0)
|
| [4] |
Uwe Schlifkowitz, Wolfgang Finsterle, Werner Schmutz.
Development of a phase-sensitive absolute radiometer for space and ground-based use. Proceedings of the 17th ESA Symposium on European Rocket and Balloon Programmes and Related Research. Sandefjord: ESA, 2005: 467-469.
( 0) 0)
|
| [5] |
Henryk Madura, Mariusz Kastek, Tomasz Sosnowski, et al. Pyrometric method of temperature measurement with compensation for solar radiation.
Metrology and Measurement Systems, 2010, 17(1): 77-86.
DOI:10.2478/v10178-010-0008-6 ( 0) 0)
|
| [6] |
Sabri Mekaoui, Steven Dewitte, Christian Conscience, et al. Total solar irradiance absolute level from DIARAD/SOVIM on the international space station.
Advances in Space Research, 2010, 45(11): 1393-1406.
DOI:10.1016/j.asr.2010.02.014 ( 0) 0)
|
| [7] |
Lee R B, Barkstrom B R, Cess R D. Characteristics of the earth radiation budget experiment solar monitors.
Applied Optics, 1987, 26(15): 3090-3096.
DOI:10.1364/AO.26.003090 ( 0) 0)
|
| [8] |
Brusa R W, Frohlich C. Absolute radiometers (PM06) and their experimental characterization.
Applied Optics, 1986, 25(22): 4173-4180.
DOI:10.1364/AO.25.004173 ( 0) 0)
|
| [9] |
Wang Hongrui, Li Huidan, Fang Wei. Timing parameter optimization for comparison experiments of TSIM.
Applied Optics, 2014, 53(9): 1718-1726.
DOI:10.1364/AO.53.001718 ( 0) 0)
|
| [10] |
Wang Yupeng, Fang Wei, Gong Chenghu, et al. Dual cavity inter-compensating absolute radiometer.
Optics and Precision Engineering, 2007, 15(11): 1662-1667.
( 0) 0)
|
| [11] |
Yang Dongjun, Fang Wei, Ye Xin, et al. High precision sun-tracking of spaceborne solar irradiance monitor.
Optics and Precision Engineering, 2014, 22(9): 2483-2490.
DOI:10.3788/OPE. ( 0) 0)
|
| [12] |
Fang Wei, Wang Hongrui, Li Huidan, et al. Total solar irradiance monitor for Chinese FY-3A and FY-3B satellites-instrument design.
Solar Phys, 2014, 289: 4711-4726.
DOI:10.1007/s11207-014-0595-6 ( 0) 0)
|
| [13] |
Wang Hongrui, Li Huidan, Qi Jin, et al. Total solar irradiance monitor for the FY-3B satellite-space experiments and primary data corrections.
Solar Phys, 2015, 290: 645-655.
DOI:10.1007/s11207-014-0627-2 ( 0) 0)
|
| [14] |
Gong Chenghu, Fang Wei. Software design and implementation for solar irradiance monitor on FY-3A satellite.
Optics and Precision Engineering, 2010, 18: 1476-1482.
( 0) 0)
|
| [15] |
Sapritskii V I, Pavlovich M N. Absolute radiometer for reproducing the solar irradiance unit.
Metrologia, 1989, 26: 81-86.
DOI:10.1088/0026-1394/26/2/001 ( 0) 0)
|
| [16] |
Fang Wei, Yu Binxi, Yao Haishun, et al. Solar irradiance absolute radiometer and international comparison.
Acta Optica Sinica, 2003, 23: 112-116.
( 0) 0)
|
| [17] |
Boivin L, McNeely F T. Electrically calibrated absolute radiometer suitable for measurement automation.
Applied Optics, 1986, 25: 554-561.
DOI:10.1364/AO.25.000554 ( 0) 0)
|
| [18] |
Yang Zhenling, Fang Wei, Luo Yang, et al. Experimental characterization and correction of non-equivalence of Solar Irradiance Absolute Radiometer.
Chinese Optics Letters, 2014, 12(10): 101202.
DOI:10.3788/COL ( 0) 0)
|
| [19] |
Yu Bingxi, Yao Haishun, Fang Wei. Rapid measurement method of absolute radiometer by using forecast radiation in electrically heating compensation.
Acta Optica Sinica, 2005, 25(6): 786-790.
( 0) 0)
|
| [20] |
Sroka R. Application of sensitivity analysis to the correction of static characteristics of a phase angle modulator.
Metrology and Measurement Systems, 2011, 18(2): 249-259.
( 0) 0)
|
| [21] |
Oulton R F, Adjiman C S. Global optimization and modeling techniques for planar multilayered dielectric structures.
Applied Optics, 2006, 45(23): 5910-5922.
DOI:10.1364/AO.45.005910 ( 0) 0)
|
| [22] |
Weng Fuzhong, Zhou Xiaolei. Errors from Rayleigh-Jeans approximation in satellite microwave radiometer calibration systems.
Applied Optics, 2013, 52(3): 505-508.
DOI:10.1364/AO.52.000505 ( 0) 0)
|
| [23] |
Eplee R E, Jr Turpie K R, Meister G, et al. On-orbit calibration of the Suomi national polar-orbiting partnership visible infrared imaging radiometer suite for ocean color applications.
Applied Optics, 2015, 54(8): 1984-2006.
DOI:10.1364/AO.54.001984 ( 0) 0)
|
 2017, Vol. 24


