Human being have been tightly connected with water quality, and getting to plenty, safe water is necessary for good living[1-2]. Finished water left from waterworks always meets national standards, but some chemical and microbiological reaction happened in the water network. Drinking water stayed in the water distribution system for several hours or several days before arriving the end-user[3-4]. The quality of drinking water deteriorated because of bacteria growth which is still a exist difficult for the water utilities[5-6]. To limit bacteria regrowth, biological stability is used as an evaluation index which primarily relies on the content of residual disinfectant and substrate needed for microorganisms growth[7-8].It was used to produce biologically stable water which could prevent bacteria regrowth in the water distribution system. Many studies showed disinfectants could turn natural organic matter (NOM) to produce more substrate for heterotrophic bacteria[9-12]. Potential problems resulting from bacteria regrowth not only increase risking ofopportunistic pathogens but also enhance the corrosion of pipe materials[13-14]. Studies showed that bacteria growth could be restricted by phosphorus if organic matters concentration was high[15-16]. Phosphorus is also necessary elements of bacterial growth. When BDOC concentration is very low, phosphorus is a limiting factor for controlling microorganisms growth[17].
The above studies suggest that there may be a balance between keeping sufficient disinfectant and gaining lower substrate content for limiting bacteria regrowth in the water distribution system. Bacteria regrowth could be restricted by controlling water biological stability, which primarily managed by an intricate reaction among bacteria, disinfectants, and substrates. This article presents a comprehensive approach to study biological stability of a northern living district, to find the relation between biological stability and its influencing factors, to determine biological stability effective on the regrowth of bacteria. Moreover, the study tried to determine the relation between the bacteria regrowth and limiting factors, such as microbially available phosphorus (MAP).
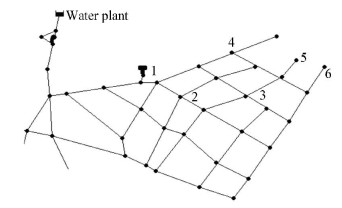
2 Materials and Method 2.1 Arrangement of Sampling SitesThe test was implemented in a housing estate water distribution system located in the north of China. Source water was drawn from surface water, Songhuajiang River. To carry out the research under different hydraulic conditions, six sampling sites were selected. The information was shown in Fig. 1, site 1 is at the entrance of the housing estate, and the rest of sites 2-6 covered the entire housing estate. The mains are composed primarily of unlined cast iron, and the diameter was between 100 and 300 mm. Water sample was taken one time each week in winter, and twotimes every week in summer. The temperature of water was respectively 1 ℃ and 25 ℃ in winter and summer. The pipe information was shown in Table 1.
|
Figure 1 Sampling sites in living district water distribution system |
| Table 1 Basic situation of sampling sites |
2.2 Glassware
All glassware used in this study was disposed free from the carbon. Glassware was cleaned by phosphate free detergents. At first the glassware was immersed in 2% HCl solution for 2 h, then they were flushed by deionized water, then at last was heated for 6 h at 550 ℃. The step was conducted to wipe off all residual carbon and phosphorus inside the glassware.
2.3 Sample TransportWater samples were gathered from each samplingsite in the living district. The water samples can be delivered to the laboratory within 2 h by using a technical transport system. The temperature during transport was maintained 4-8 ℃ with cold storage facilities. The water samples were analyzed at once when they arrived. There were no remarkable bacteria growing discovered by plate counts during transporting. Table 2 was water quality index value in different seasons.
| Table 2 Average water quality of six sampling sites |
2.4 Analysis of BDOC
BDOC measurement used the method in accordance with a modified version with applying a suspended inoculum of bacteria[18]. Firstly, the water sample was filtered with a 60-mL polypropylene syringe, thereafter through a double thickness of glass fibre microfilter which was free from carbon. To estimate background DOC, the 40 mL of residual filtrate was kept as a blank. Every time water sample was measured by using the changed filter. Firstly the filter was washed, then rendered free form the carbon through treatment at 450 ℃ for 6 h, and at last each sample was injected as 40-mL portions into 45-mL borosilicate tube. Each sample was treated by thiosulphate before the inoculation. Dissolved organic carbon in three tubes (parallels) was measured once (day 0) for providing initial dissolved organic carbon content. The incubated tubes were standing at the darkness kept at 20 ℃. When 28-day came, firstly samples were filtered through a double thickness of glass filter, then dissolved organic carbon was measured.
2.5 Method of MAP MeasurementFirstly 50-mL water sample was put into a 50-mL triangle flask with a grinding mouth which was disposed free of the carbon, thereby take sufficient carbon and other inorganic matters except phosphorus into measured samples, so the restriction of carbon and other inorganic matters for bacteria growth may be eliminated. Therefore phosphorus became the only nutrient factore limited bacteria growth. Take 50 μL inorganic matters (calcium, potassium, nitrogen, magnesium) and 50 μL 2 g/L Acetic acid sodium solution (with Acetic acid sodium Plan) to the 50 mL water samples to ensure the solution concentration as follows: 102.5 mg/L MgSO4·7H2O, 98 mg/L CaCl2·2H2O, 101.9 mg/L KCl, 101.7 mg/L NaCl. The plant cell and the spores bacteria were destroyed and inactivate by 70 ℃ water bath. Then make the water bath to room temperature, in accordance with the Vaccination concentration of 103 CFU/mL, inoculate pseudomonas fluorescens 17, train at 15 ℃ in the darkness. On the third and fourth day of cultivation, to count the p17 in the water sample respectively.
2.6 Heterotrophic Plate CountingR2A medium was used for Heterotrophic Plate Counting, which cultivated 7 d at 22-28 ℃. R2A medium is broadly employed in water quality analyzing in the world. Its constituent is comparatively general, available for most extensive bacteria living in water. At the meantime a great deal of growing slowly bacteria can be detected due to HPC cultivation requiring long time. Thus, HPC could indicate the quantity of heterotrophic bacteria in water effectively.
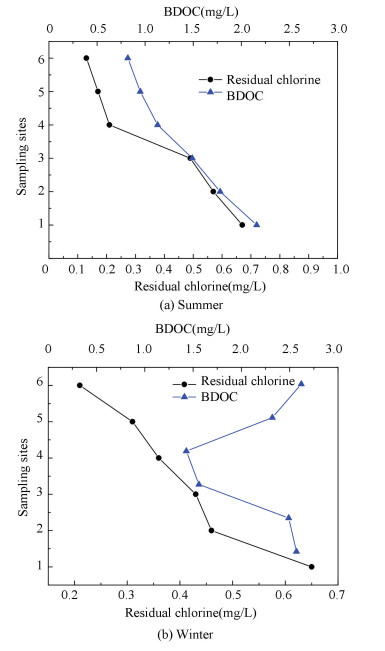
3 Result Analysis 3.1 Effect of Residual Chlorine on BDOCFor purpose of verifying residual chlorine effectiveness on BDOC, summer and winter data of 6 sampling sites was shown in Fig. 2. BDOC concentration gradually dropped during the route from sampling site 1 to 6 in Fig. 2(a). From sampling site 1 to site 3, BDOC content was respectively 2.16, 1.78 and 1.49 mg/L, but at sampling site 4-6, BDOC content was separately 1.13, 0.95 and 0.82 mg/L. The reason was that bacteria were metabolizing more BODC than that chlorine decomposing organic matters. Organic matters can be oxidized into small molecule carbon by the chlorine[19-20]. In summer organic matters are easily oxidized by chlorine because of the higher temperature. At sampling sites 4, 5 and 6, the residual chlorine concentration decreased remarkably, at the same time BDOC also declined sharply. This was because at the pipe network peripheral, the restriction of bacteria weakened, further bacteria activities strengthened, as a result of consuming a great deal of BDOC and residual chlorine.
|
Figure 2 Change of residual chlorine and BDOC in different seasons |
BDOC and residual chlorine changes in winter were shown in Fig. 2(b). BDOC concentration between sites 1 and 3 fell slightly, but it declined sharply at sampling site 4. The reason is that originally bacteria used BDOC a little, for their growth inhibited by the lower temperature. Then bacteria become more active due to residual chlorine decreasing. Residual chlorine decayed fast at sampling site 6, where far away from the entrance is much lower, thus due to the bacteria consuming. From the site 4 to site 6, BDOC concentration was increasing in Fig. 3. The reason lies in that the rate of residual chlorine oxidizing organic matters into BDOC was higher than that of bacteria consuming BDOC.
|
Figure 3 Change of Fe and BDOC in different seasons |
3.2 Effect of Fe Concentration on BDOC
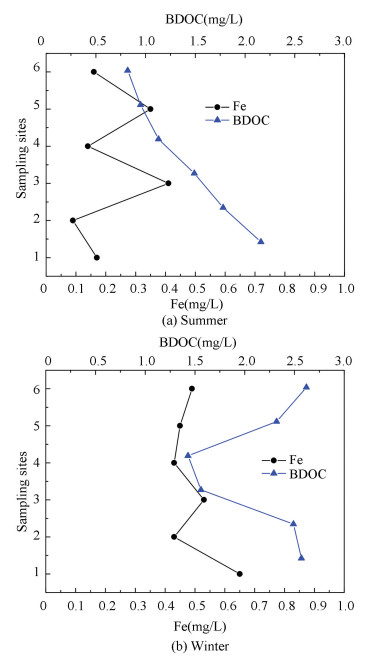
From Fig. 3, Fe concentration and BDOC change can be seen clearly. Fe and BDOC had a positive correlation indicated that concentration of BDOC increased can result in Fe rising. One source of Fe ion in the water distribution system mainly came from corroded cast iron pipes which were widely used, and some old pipes have been used for several decades in big cities in China. Another source came from water treatment agent, such as Polymeric Aluminum Ferric Chloride. Irion bacteria metabolism activity is also a major source causing Fe increasing. It's well known that Fe is ubiquitous in natural water, and high iron content in the pipe promotes the growth of iron bacteria. Moreover, Fe content also increases water turbidity, color, smell and taste in drinking water. If the iron content is 0.3 mg/L, accordingly chroma is about 20 degrees. If the iron content is 0.5 mg/L, accordingly chroma can be greater than 30 degrees. People would feel the metal taste of tap water obviously when Fe content rise to 1.0 mg/L. The total iron consists a metal iron and iron elements in various valence states, including iron, Fe2+, Fe3+, and ferric hydroxide colloid in drinking water[21].
The corrosion theory of iron pipes may be illustrated with the electrochemical reaction, and the reaction equations are shown below
| $ {\rm{Fe}} \to {\rm{F}}{{\rm{e}}^{2 + }} + 2{{\rm{e}}^ - }\;\;\;2{\rm{H}} + 2{{\rm{e}}^ - } \to {{\rm{H}}^2} $ | (1) |
| $ {{\rm{H}}_2}{\rm{O}} \to {{\rm{H}}^ + } + {\rm{O}}{{\rm{H}}^ - }\;\;\;{\rm{F}}{{\rm{e}}^{2 + }} + 2{\rm{O}}{{\rm{H}}^ - } \to {\rm{Fe}}{\left( {{\rm{OH}}} \right)_2} \downarrow $ | (2) |
The above reaction released hydrogen, then hydrogen and Fe(OH)2 gathered in the cathode polarization, continue to prevent the corrosion proceeding. This reaction will not cause water pipe's corrosion. When an oxidizing agent exists in water, it will play a depolarization effective impelling the corrosion reaction to continue. The reaction as follows:
| $ {{\rm{H}}_2} + \frac{1}{2}{\rm{O}} \to {{\rm{H}}_2}{\rm{O}}\;\;\;\;2{\rm{Fe}}{\left( {{\rm{OH}}} \right)_2} + \frac{1}{2}{{\rm{O}}_2} + {{\rm{H}}_2}{\rm{O}} \to 2{\rm{Fe}}{\left( {{\rm{OH}}} \right)_3} $ | (3) |
Firstly dissolved oxygen oxidized Fe to Fe2+, and then Fe2+ was oxidized into Fe3+, becoming solid Fe(OH)3, which could gather on the inner wall of the iron pipe[22]. Inversely the above reaction aggravated corrosion, increasing iron content in water. It can be seen the total iron concentration and BDOC has a positive correlation from Fig. 3, iron is the main factor causing network turbidity. Therefore, BDOC content control was an effective method to reduce Fe content in the network.
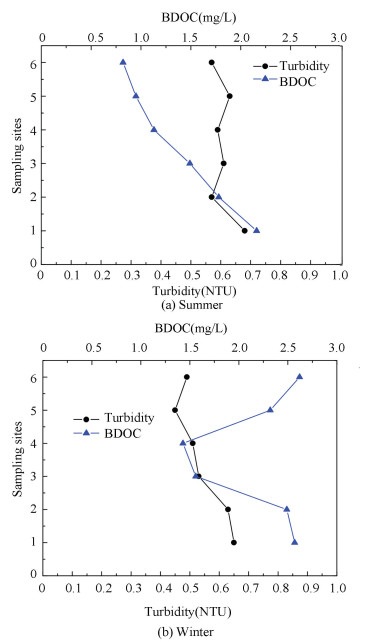
3.3 Effect of Turbidity on BDOCFrom Fig. 4, BDOC content and Turbidity change in summer and winter were shown respectively. Turbidity data of 6 sampling sites can match the national water quality standard. The turbidity of site 1 was higher than other 5 sites, due to the complex hydraulic conditions of site 1 which was the entrance of the living district. In Fig. 4(a), the turbidity of site 3, 4 and 5 was higher than site 2, because site 3 was located at an old building where the pipe corroded seriously. Sites 4 and 5 were at the end of the network, chlorine concentration was lower, and bacteria activities strengthened resulting in turbidity increasing in summer. While in winter, the turbidity decreased from site 2 to site 5, because bacteria regrowth was restricted by chlorine and lower temperature. Turbidity may play a main role on the photodegradation of organic matter which could help bacteria increase attain substrates[23].Higher turbidity can protect bacteria from the chlorine disinfection.
|
Figure 4 Change of turbidity and BDOC in different seasons |
3.4 Effect of pH on BDOC
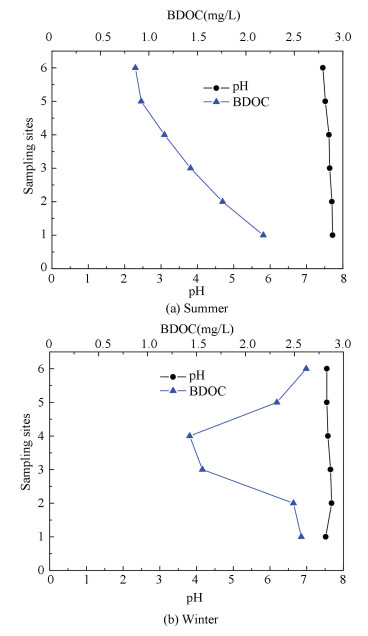
The reaction among organic matters, chlorine and other matters were influenced by pH greatly[24]. The data of each site was shown in Fig. 5, the maximum value was 7.72, and the minimum value was 7.45 in summer and winter. So they all meet the national standard. From Fig. 5 can be seen that pH decreased along the pipeline, which can be explained from the following two aspects. The first reason is due to bacteria influence in network water. There are two kinds of typical bacteria existing in the water network. Iron bacteria existing grow in an environment where pH is 5.96-7.89. Nevertheless sulfate reducing bacteria germinate in the environment of pH is 5.96-8.35. Thus the pH flocculation region favors the two kinds of bacteria. Iron bacteria consume OH- in water, then generate Fe(OH)2 or Fe(OH)3. At the same time, sulfate reducing bacteria induced the reduction consuming OH-, the following equation:
|
Figure 5 Change of pH and BDOC in different seasons |
The dissolution of iron at anode area
| $ 4{\rm{Fe}} \to {\rm{F}}{{\rm{e}}^{2 + }} + 3{\rm{F}}{{\rm{e}}^{2 + }} + 8{{\rm{e}}^ - } $ | (4) |
The cathode reaction
| $ 8{{\rm{H}}_2}{\rm{O}} \to 8{{\rm{H}}^ + } + 6{\rm{O}}{{\rm{H}}^ - } + 2{\rm{O}}{{\rm{H}}^ - } $ | (5) |
| $ 8{{\rm{H}}^ + } + 8{{\rm{e}}^ - } \to 8{\rm{H}} $ | (6) |
| $ 8{\rm{H}} + {\rm{SO}}_4^{2 - }\xrightarrow{{{\rm{hydrogenase}}}}4{{\rm{H}}_2}{\rm{O}} + {{\rm{S}}^{2 - }} + {\rm{energy}} $ | (7) |
| $ {\rm{F}}{{\rm{e}}^{2 + }} + {\rm{SO}}_4^{2 - } \to {\rm{FeS}} $ | (8) |
| $ 3{\rm{F}}{{\rm{e}}^{2 + }} + 6{\rm{O}}{{\rm{H}}^ - } \to 3{\rm{Fe}}{\left( {{\rm{OH}}} \right)_2} $ | (9) |
As a result, these reaction caused pH decrease in the water. Furthermore, electrochemical reaction could consume OH- in the water. When the pH is over 7.0 in the metal pipeline, micro cell corrosion reaction would happen, its cathode redox reaction happens:
| $ {{\rm{H}}_2}{\rm{O}} + \frac{1}{2}{{\rm{O}}_2} + 2{{\rm{e}}^ - } \to 2{\rm{O}}{{\rm{H}}^ - } $ | (10) |
On the cathodic reduction, due to electrostatic interactions, anode and cathode product diffuse to each other, further action will form Fe(OH)2, then generate Fe(OH)3. Part of the product is dewatered to form rust, the reaction could continue to go on for its texture osteoporosis, then sedimentary rust scale formed. Therefore these two aspects of effective induced pH value decline in the water distribution system.
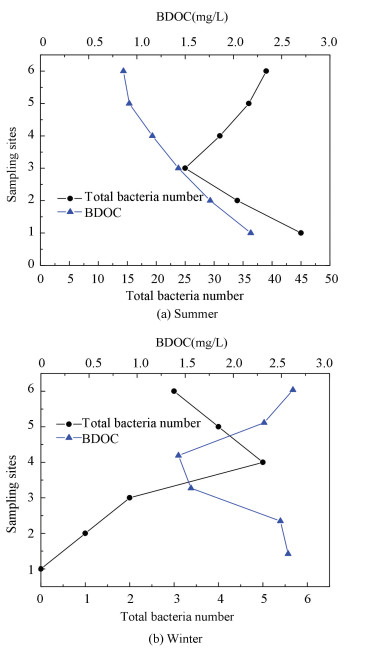
3.5 Correlation Between BDOC and Total Bacteria NumberFrom Fig. 6, it can be seen that total bacteria number has a positive correlation with BDOC concentration in summer and winter, illustrating that BDOC is a direct nutrient source for the bacteria. BDOC concentration decreases significantly due to bacteria consumption at site 2. In Fig. 6(a), total bacteria number increase obviously because of residual chlorine decaying in the water distribution system from site 3 to site 6. In Fig. 6(b), the bacteria number of six sampling sites is all very few, especially at site 1, at which the bacteria number is zero. The reason for that is site 1 is near to inlet where residual chlorine is high, and the temperature is also lower in winter. Moreover, BDOC concentration decreased gradually, and then it increased little by little during the course from site 1 to site 6 in winter. The main reason is that the rate of chlorine oxidization increasing BDOC is faster than bacteria consumption decreasing BDOC. BDOC concentration change is a double interaction of chlorination and bacteria consuming.
|
Figure 6 Change of bacteria number and BDOC in different seasons |
3.6 Correlation Between BDOC and MAP
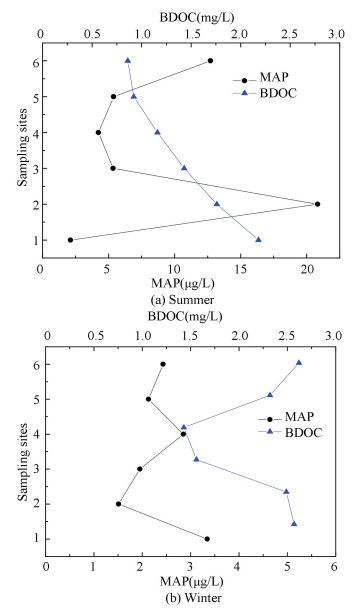
MAP changes of different sampling sites with hydraulic retention time were shown in Fig. 7. MAP contents in summer and winter were respectively2.12-20.83, 1.51-3.34 μg/L in the network. MAP concentration increased significantly at site 2 because there was a ground water supply near it, and the higher MAP content in ground water lead to the rising of network water. This phenomenon can be explained from Fig. 7(b), when the ground supply was shut down in winter, the MAP content did not go up consequently. MAP content didn't change clearly at six sampling sites in winter as shown in Fig. 7(b), indicating that MAP can only use by the bacteria in drinking water, and there was no other metabolic pathway. Bacteria activity just caused trace changes in network water, therefore MAP content changed very little. It can be seen that BDOC concentration was 0.82-2.16 mg/L in summer, and 1.56-2.57 mg/L in winter, whereas MAP content was in a low level. This result was in line with other literatures that MAP concentration would be in a lower level when BDOC content was high in the water distribution system[25].
|
Figure 7 Change of MAP and BDOC in different seasons |
4 Conclusions
1) The biological stability research on northern living strict shows that average BDOC content are 1.39 and 2.17 mg/L, respectively, in summer and winter. Network water belongs to slightly unstable biological water.
2) BDOC and residual chlorine content all decrease remarkably along with the pipeline in summer. The reason is that bacteria activities strengthen for the warm environmental condition, they consume a great deal of BDOC and residual chlorine, especially at network peripheral. The restriction of residual chlorine on bacteria growth weakens. In winter BDOC concentration along with the pipeline first declines, then increases. BDOC content change is double interaction of chlorination and bacteria consuming.
3) BDOC content and turbidity in summer and winter have a stronger positive correlation. Turbidity changes in the water pipe network can be described by two processes: on the one hand, the water flow has a flush effect to the pipe wall. The flow water make the corrosion products which is attached to the pipe wall loosen and fall into the water, resulting in turbidity increase; on the other hand, the suspended matter to wall attachment or precipitation when the flow velocity was slow, resulting in turbidity decrease. Pipe material is another important factor affecting turbidity change.
4) In order to guarantee drinking water quality, the water company must strengthen the daily management of pipe network and pipeline flushing regularly, reforming the serious corroded pipes. When selecting pipeline, the water company should try to use the non-metal pipeline, to reduce water turbidity and improve water quality.
| [1] |
Li W Y, Wang F, Zhang J P, et al. Community shift of biofilms developed in a full-scale drinking water distribution system switching from different water sources. Science of the Total Environment, 2016, 544: 499-506. DOI:10.1016/j.scitotenv.2015.11.121 ( 0) 0)
|
| [2] |
Bain R E S, Wright J A, Christenson E, et al. Rural: Urban inequalities in post 2015 targets and indicators for drinking-water. Science of the Total Environment, 2014, 490: 509-513. DOI:10.1016/j.scitotenv.2014.05.007 ( 0) 0)
|
| [3] |
Lehtola M J, Nissinen T K, Miettinen I T, et al. Removal of soft deposits from the distribution system improves the drinking water quality. Water Research, 2004, 38: 601-610. DOI:10.1016/j.watres.2003.10.054 ( 0) 0)
|
| [4] |
Lu P P, Zhang X J, Zhang C Q. Biostability in distribution systems in one city in southern China:Characteristics, modeling and control strategy. Journal of Environmental Sciences, 2014, 26: 323-331. DOI:10.1016/S1001-0742(13)60422-2 ( 0) 0)
|
| [5] |
Srinivasan S, Harrington G W. Biostability analysis for drinking water distribution systems. Water Research, 2007, 41: 2127-2138. DOI:10.1016/j.watres.2007.02.014 ( 0) 0)
|
| [6] |
Hu J Y, Wang Z S, Ng W J, et al. The effect of water treatment processes on the biological stability of potable water. Water Research, 1999, 33(11): 2587-2592. DOI:10.1016/S0043-1354(98)00482-5 ( 0) 0)
|
| [7] |
Rittmann B E, Snoeyink V L. Achieving biologically stable drinking water. Journal of American Water Works Association, 1984, 76(10): 106-114. DOI:10.1002/(ISSN)1551-8833 ( 0) 0)
|
| [8] |
Escobar I C, Randall A, Taylor J. Bacterial growth in distribution systems: Effect of assimilable organic carbon and biodegradable dissolved organic carbon. Environment Science Technology, 2001, 35(17): 3442-3447. DOI:10.1021/es0106669 ( 0) 0)
|
| [9] |
Matilainen A, Sillanpaa M. Removal of natural organic matter from drinking water by advanced oxidation processes. Chemosphere, 2010, 80: 351-365. DOI:10.1016/j.chemosphere.2010.04.067 ( 0) 0)
|
| [10] |
Fabris R, Chow C W K, Drikas M, et al. Comparison of NOM character in selected Australian and Norwegian drinking waters. Water Research, 2008, 42: 4188-4196. DOI:10.1016/j.watres.2008.06.023 ( 0) 0)
|
| [11] |
Worrall F, Burt T P. Changes in DOC treatability: Indications of compositional changes in DOC trends. Journal of Hydrology, 2009, 366: 18. ( 0) 0)
|
| [12] |
Wen T L, Meng J C, Tessora Y. Application of UV absorbance and fluorescence indicators to assess the formation of biodegradable dissolved organic carbon and bromate during ozonation. Water Research, 2017, 111: 154-162. DOI:10.1016/j.watres.2017.01.009 ( 0) 0)
|
| [13] |
Liu W, Wu H, Wang Z, et al. Investigation of assimilable organic carbon (AOC) and bacterial regrowth in drinking water distribution system. Water Research, 2002, 36(4): 891-898. DOI:10.1016/S0043-1354(01)00296-2 ( 0) 0)
|
| [14] |
Zhang M, Semmens M J, Schuler D, et al. Biostability and microbiological quality in a chloraminated distribution system. Journal of American Water Works Association, 2002, 94(9): 112-122. DOI:10.1002/(ISSN)1551-8833 ( 0) 0)
|
| [15] |
Lehtola M J, Miettinen I T, Nartiainen T, et al. Microbially available organic carbon, phosphorus, and microbial growth in ozonated drinking water. Water Research, 2001, 35(7): 1635-1640. DOI:10.1016/S0043-1354(00)00449-8 ( 0) 0)
|
| [16] |
Sathasivan A, Ohgaki S. Application of new bacterial regrowth potential method for water distribution system:A clear evidence of phosphorus limitation. Water Research, 1999, 33: 137-144. DOI:10.1016/S0043-1354(98)00158-4 ( 0) 0)
|
| [17] |
Jiang D L, Chen Y, Ni G W. Effects of total phosphorus (TP) and microbially available phosphorus (MAP) on bacterial regrowth in drinking water distribution system. Journal of Hebei United University, 2011, 1: 124-129. ( 0) 0)
|
| [18] |
Servais P, Billen G, Hascoet M C. Determination of the biodegradable fraction of dissolved organic matters in waters. Water Research, 1987, 21: 445-450. DOI:10.1016/0043-1354(87)90192-8 ( 0) 0)
|
| [19] |
Escobar I C, Randall A A. Assimilable organic carbon (AOC) and biodegradable dissolved organic carbon (BDOC): Complementary measurements. Water Research, 2000, 34(10): 4444-4454. ( 0) 0)
|
| [20] |
Nishijima W, Fahmi M T. DOC removal by multi-stage ozonation-biological treatment. Water Research, 2003, 37: 150-154. DOI:10.1016/S0043-1354(02)00257-9 ( 0) 0)
|
| [21] |
Teng F, Guan Y T, Zhu W P. Effect of biofilm on cast iron pipe corrosion in drinking water distribution system: Corrosion scales characterization and microbial community structure investigation. Corrosion Science, 2008, 50: 2816-2823. DOI:10.1016/j.corsci.2008.07.008 ( 0) 0)
|
| [22] |
Lin J P, Ellaway M, Adrien R. Study of corrosion material accumulated on the inner wall of steel water pipe. Corrosion Science, 2001, 43: 2065-2081. DOI:10.1016/S0010-938X(01)00016-6 ( 0) 0)
|
| [23] |
Tietjen T, Vahatalo A V, Wetzel R G. Effects of clay mineral turbidity on dissolved organic carbon and bacterial production. Aquatic Sciences, 2005, 67: 5160. ( 0) 0)
|
| [24] |
Zhang T C, Huang Y H. Profiling iron corrosion coating on iron grains in a zerovalent iron system under the influence of dissolved oxygen. Water Research, 2006, 40: 2311-2320. DOI:10.1016/j.watres.2006.04.026 ( 0) 0)
|
| [25] |
Lehtola M J, Miettinen I T, Vartiainen T, et al. Microbially available organic carbon, phosphorus and microbial growth in ozonated drinking water. Water Research, 2001, 35: 1635-1640. DOI:10.1016/S0043-1354(00)00449-8 ( 0) 0)
|
 2018, Vol. 25


