Recently, as the development of science and military, the maritime surveillance gradually shows its importance both in national security and in people's livelihood[1]. The traditional optical image could be contaminated by many conditions, such as the weather and the cloud. The synthetic aperture radar (SAR) system gradually gains its popularity because it has high spatial resolution without the influence of weather, clouds and other conditions. Besides, comparing with the surrounding sea surface, the metal surface and sharp angle of ship target express high reflection in the SAR image[2]. Spontaneously, using SAR image is a wonderful way to detect the ship target. SAR image has been widely used in the maritime surveillance domains.
The constant false alarm rate (CFAR) is one of the most commonly used algorithms in the ship target detection. The ship targets show high gray-values while the interferences such as the sea clutter often shows a lower gray-value in the SAR images. Hence, we can separate them by using a predetermined threshold. The selection of threshold is the topic we are concerned. The CFAR is a kind of method which can determine the appropriate threshold. The accuracy of the statistical modeling for the interference has a great influence on the precision of detection. In general, traditional CFAR algorithm usually use Gauss-model, K-model and so on. A great number of facts and experiments show that K-distributions model perform well at most of the time[3-6].
However, the traditional CFAR algorithm does not consider the land in the SAR image, and we also need to acquire the length and width of the ship target before the selection of the window size for the CFAR algorithm. Furthermore, when the two ships are too close, the CFAR method cannot separate them efficiently by the threshold. For the precise implementation of ship target detection in the SAR image, this paper presents comprehensive algorithms including the Otsu, CFAR and opening operation to improve the detection accuracy.
The structure of this paper is as below. Section 2 introduces the whole procedure for the process of detection, our comprehensive algorithms including Otsu, CFAR and opening operation are introduced consequently. The experimental results are shown in Section 3. Section 4 is the conclusion of the paper.
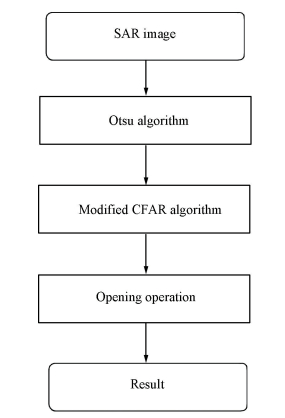
2 Ship Target Detection ProcessThe algorithm in this paper consists of three parts: 1) Otsu algorithm; 2) Modified CFAR algorithm; 3) Opening operation.
The flowchart is shown in Fig. 1.The detailed implementation of the detection can be illustrated as follows. First, Otsu algorithm is used to acquire the prior information such as the size of the ship, and the size of the sliding window should be decided simultaneously. The next step is the modified CFAR algorithm using K-model for the ship target detection. Finally, we adopt opening operation in order that the accuracy of the CFAR detection results can be improved.

|
Figure 1 The whole process of ship target detection in SAR image |
2.1 Otsu Algorithm
The Otsu algorithm is a kind of binary segmentation approach. It segments a whole grayscale image by a threshold. The pixels with higher grayscale value than the threshold are regarded as the foreground pixels or target pixels and the pixels with lower grayscale than the threshold are regarded as the background pixels or interference pixels. The threshold can be determined as follows[7]:
| $ g = {w_0}{\left( {{\mu _0} - \mu } \right)^2} + {w_1}{\left( {{\mu _1} - \mu } \right)^2} $ | (1) |
where w0 is the proportion of foreground pixels, μ0 is the mean grayscale value of foreground pixels, μ is the mean grayscale value of all pixels, w1 is the proportion of background pixels, μ1 is the mean grayscale value of background pixels. The higher g is, the more difference between background pixels and foreground pixels there is, then the better the threshold is decided.
The threshold T* can be obtained by the maximum value of g.
| $ {T^ * } = \mathop {\max }\limits_{0 \le T < H} \left[ {{w_0}{{\left( {{\mu _0} - \mu } \right)}^2} + {w_1}{{\left( {{\mu _1} - \mu } \right)}^2}} \right] $ | (2) |
where H means the total number of the gray levels of the image, and in our image H is 255. The Otsu algorithm can segment the image with high efficiency, and we can acquire some prior information such as the size of the ship target.
After the Otsu algorithm, the ship target and some interference can be obtained. Then, we will measure these targets to decide the size of background window. In this paper, we measure lengths and widths of all these targets, and sort these length and width values in the ascending order. Find the length value which is just more than 95% of these length values, denote this value by lL. Similarly, the width value which is just more than 60% of these width values is denoted by lw.
2.2 Modified CFAR AlgorithmThough efficient, Otsu algorithm cannot reach expected accuracy. CFAR algorithm is one of the most precise and common algorithm in ship detection. Different with the conventional two-parameter CFAR algorithm, our CFAR sliding window is according to the size of the ship targets. At the same time, we adjust and simplify the procedure for the computation of the threshold, which can improve the detection efficiency greatly.
CFAR algorithm is designed to calculate a threshold to separate the ship targets and the sea clutter. We can suppose a certain model of sea clutter, and then use the grayscale of these pixels to estimate the unknown parameters of the probability density function (pdf), and the way to acquire threshold T is as follows:
| $ \int_{ - \infty }^T {P\left( x \right){\rm{d}}x} = {P_{fa}} $ | (3) |
where P(x) is the pdf of the model, Pfa is the probability of false alarm. To improve the precision, a suitable model of sea clutter is very important. The comparison among the K-distribution, Gauss-distribution, Rayleigh-distribution, Lognormal-distribution, and Weibull distribution shows that the K-distribution is the best model for the sea clutter[8]. The pdf of the K-distribution is as follows[9]:
| $ \begin{array}{l} P\left( x \right) = \frac{2}{{x\mathit{\Gamma }\left( v \right)\mathit{\Gamma }\left( L \right)}}{\left( {\frac{{Lvx}}{\mu }} \right)^{\frac{{L + v}}{2}}}{K_{L - v}}\left( {2\sqrt {\frac{{Lvx}}{\mu }} } \right),\\ \;\;\;\;\;\;\;\;\;\;\;x > 0 \end{array} $ | (4) |
where μ is the mean value of the test pixels grayscale, v is the shape parameter[10], L is the number of statistically independent looks[10], Γ(*) is the Gamma function[10], and KL-v(*) is the modified second kind of Bessel function[10].
The way to estimate these parameters can base on logarithmic mean and mean[11].
| $ \begin{array}{l} \ln \left( {\hat \mu } \right) - \phi \left( {\hat v} \right) = \ln \left( {\left[ x \right]} \right) - \left[ {\ln \left( x \right)} \right] + \phi \left( L \right) - \\ \;\;\;\;\;\;\;\;\ln \left( L \right) \end{array} $ | (5) |
where [x] means the mean of x, ϕ(*) means the diagamma function.
The pdf of K-distribution is complicated, and the computation of threshold T based on Eq.(4) will not be easy. Consider that the grayscale of a pixel in a gray image is usually 8 bits, which means that the grayscale is an integer between 0 and 255. As a result, we may adjust Eq.(3) according to the definition of integration as follows:
| $ \frac{{\sum\limits_{x = 0}^T {P\left( x \right)} }}{{\sum\limits_{x = 0}^{255} {P\left( x \right)} }} \ge 1 - {P_{fa}} $ | (6a) |
| $ \frac{{\sum\limits_{x = 0}^{T - 1} {P\left( x \right)} }}{{\sum\limits_{x = 0}^{255} {P\left( x \right)} }} < 1 - {P_{fa}} $ | (6b) |
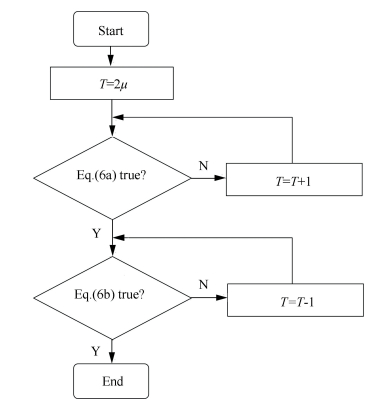
We iterate T until it meets the condition of Eq.(6). A number of results indicate that T is always around the double of the mean value for the testing pixels grayscale. We can initialize T to 2μ and iterate T as the procedure in Fig. 2 to improve the efficiency.

|
Figure 2 The estimate of T |
Some basic concepts and equations have been illustrated above. Then, we will introduce the process of CFAR algorithm to the image.
Step 1 Set a compound sliding window, which includes three concentric rectangles, the inside rectangle is named as the target window, the middle rectangle is named as the protection window and the outside rectangle is named as the background window.
Step 2 Let the compound sliding window slide on the image. We consider the pixels which are outside of the protection window and inside the background window as the sea clutter, and suppose the grayscale of these pixels meets the K-distribution.
Step 3 Estimate the parameters of sea clutter proposed in Step 2, and the threshold T can be obtained by Eq.(6) and Fig. 2. Then, we set Pfa as a very small value.
Step 4 In the target window, we preserve the pixels whose grayscale are higher than the threshold T and mark the pixels whose grayscale are not higher than the threshold as black (grayscale equals to zero).
Step 5 Repeat Step 2 to Step 4 until all the pixels of the image have been detected.
Here, we have to say that the size of the compound sliding window should be decided appropriately according to the ship target's size.
2.3 Opening OperationIt is assumed that the assemble A and assemble B belong to the two dimensional integral space Z2, we can define B dilates A as[12]:
| $ A \oplus B = \left\{ {z\left| {\left( {\hat B} \right) \cap A \ne \emptyset } \right.} \right\} $ | (7) |
Then, B eroding A can be defined as[11]:
| $ A\Theta B = \left\{ {z\left| {\left( {\hat B} \right) \subseteq A} \right.} \right\} $ | (8) |
The opening operation is the synthesis of erosion and dilation operation, this can be defined as[11]:
| $ A \circ B = \left( {A\Theta B} \right) \oplus B $ | (9) |
The purpose of opening operation is to break some tiny connective pixels between two big targets. As a result, after opening operation, two or more different targets that are merged can be separated with each other. Then we can obtain a more accurate segmentation image.
However, as the opening operation is irreversible, once it is conducted, the shape of target will be damaged even though the adjacent targets are separated if assemble B is set inappropriately. As a result, the assemble needs to be chosen neither too large nor too small.
In this letter, we set assemble A to be the whole image acquired last step and assemble B to be a straight line. Consider that if the length of B is higher than the width of the target, the target may be damaged. As a result, the length of B should be not longer than lw, we set the length of B to be lw in this letter.
3 Experimental ResultsThe airborne SAR images for the raw data is used in this experiment, the radar works in C band. Here, the Pfa is selected as 10-2 for the modified CFAR algorithm. We use the square window in this experiment, and the length of the square background window's side is defined as lb, the length of the square protection window's side is defined as lp and the length of the square target window's side is defined as lt. lb is set to be more than 95% of the lengths for the ship targets, lL defined in Section 2.1. lp is set as 0.7lb, and lt is set as 0.2lb.
The way to calculate the correct detection ratio is shown below[10]:
| $ {P_d} = \frac{{{N_d}}}{{{N_{{\rm{total}}}}}} \times 100\% $ | (10) |
where Nd means the amount of ship targets detected correctly, Ntotal means the real amount of ship targets in SAR image. Similarly, we define the false detection probability as follows[10].
| $ {P_f} = \frac{{{N_f}}}{{{N_{{\rm{total}}}}}} \times 100\% $ | (11) |
where Nf is the amount of ship targets detected incorrectly.
To illustrate the advantage of our modified CFAR algorithm, two images are detected here, and the detection results (after further feature recognition) and the comparison with conventional two-parameter CFAR algorithm, Otsu algorithm is listed below. The real number of ship targets in Table 1 is 76. The real number of ship targets in Table 2 is 30.
| Table 1 The comparison of three methods for image 1 (After further feature recognition) |
| Table 2 The comparison of three methods for image 2 (After further feature recognition) |
We can see from Table 1 and Table 2 that the conventional two-parameter CFAR algorithm has a high missing detection probability for the lack of prior information. In this experiment, we set the background window as 200×200 pixels, the protection window as 150×150 pixels and the target window as 20×20 pixels. The Otsu algorithm uses one threshold to process the whole image. When the brightness of the image is inhomogeneous, some ship targets which have high local contrast and low brightness will be removed. As a result, the modified CFAR algorithm is superior to the conventional CFAR and Otsu algorithm.
However, after the modified CFAR algorithm, there still exists a high missing detection probability. The results before and after the opening operation are shown in Table 3 and Table 4.
We can see that after the procedure of opening operation, in Table 3, Pf decreases from 14.47% to 5.26%, while Pd increases from 85.53% to 97.37%. Nf drops to 2. In Table 4, Pf decreases from 10% to 6.67%, while Pd increases from 93.33% to 100%. Nf drops to 2. Although there may exist some false alarm and missing alarm, both of them are very low, which means that our comprehensive algorithm is effective.
| Table 3 The comparison of the result before and after opening operation for image 1 (After further feature recognition) |
| Table 4 The comparison of the result before and after opening operation for image 2 (After further feature recognition) |
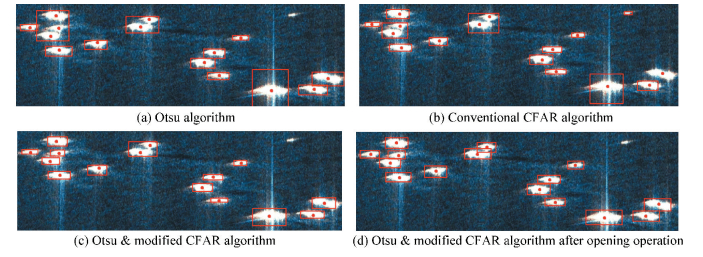
Fig. 3 and Fig. 4 show the results for the part of detection image 1 and image 2(after further feature recognition). In the SAR images, the red point means the real ship target and the red rectangle means the detected target.

|
Figure 3 Part of detection image 1 using four kinds of algorithm |

|
Figure 4 Part of detection image 2 using four kinds of algorithm |
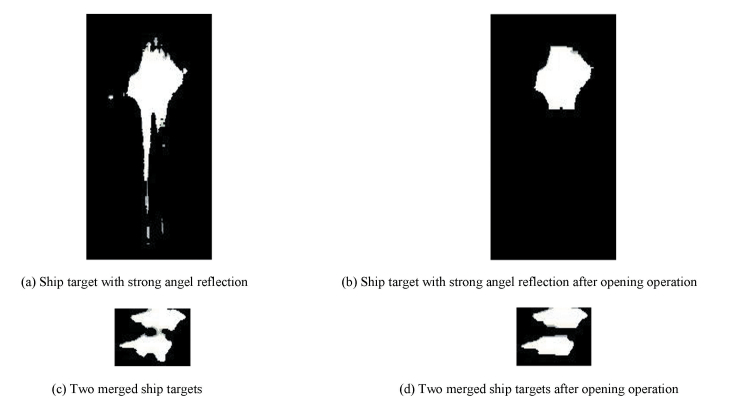
Fig. 5 shows the effect of opening operation, Fig. 5(a) and Fig. 5(c) are the ship targets before opening operation, Fig. 5(b) and Fig. 5(d) are the ship targets after opening operation. We can see that the high angel reflection is decreased, and two merged ship targets are separated correctly. We can see the superiority of the comprehensive algorithm including the Otsu, CFAR and opening operation from Fig. 3, Fig. 4 and Fig. 5.

|
Figure 5 The effect of opening operation |
4 Conclusions
This paper presents a new and comprehensive ship target detection method for the high resolution SAR image based on the Otsu, modified CFAR and opening operation. The experimental results illustrate our comprehensive method can improve the ship target detection accuracy.
| [1] |
Mazzaarella F, Vespe M, Santamaria C. SAR ship detection and self-reporting data fusion based on traffic knowledge. IEEE Geoscience and Remote Sensing Letters, 2015, 12(8): 1685-1689. DOI:10.1109/LGRS.2015.2419371 ( 0) 0)
|
| [2] |
Wang C, Jiang S F, Zhang H, et al. Ship detection for high-resolution SAR images based on feature analysis. IEEE Geoscience and Remote Sensing Letters, 2014, 11(1): 119-123. DOI:10.1109/LGRS.2013.2248118 ( 0) 0)
|
| [3] |
Leng X G, Ji K F, Yang K, et al. A bilateral CFAR algorithm for ship detection in SAR images. IEEE Geoscience and Remote Sensing Letters, 2015, 12(7): 1536-1540. DOI:10.1109/LGRS.2015.2412174 ( 0) 0)
|
| [4] |
Wang C L, Bi F K, Zhang W P, et al. An intensity-space domain CFAR method for ship detection in HR SAR images. IEEE Geoscience and Remote Sensing Letters, 2017, 14(4): 529-533. DOI:10.1109/LGRS.2017.2654450 ( 0) 0)
|
| [5] |
Gao G, Liu L, Zhao L J, et al. An adaptive and fast CFAR algorithm based on automatic censoring for target detection in high-resolution SAR images. IEEE Trans. on Geoscience and Remote Sensing, 2009, 47(6): 1685-1697. DOI:10.1109/TGRS.2008.2006504 ( 0) 0)
|
| [6] |
Hwang S I, Ouchi K. On a novel approach using MLCC and CFAR for the improvement of ship detection by synthetic aperture radar. IEEE Geoscience and Remote Sensing Letters, 2010, 7(2): 391-395. DOI:10.1109/LGRS.2009.2037341 ( 0) 0)
|
| [7] |
Ostu N. A threshold selection method from gray-level histograms. IEEE Trans. on Systems, Man and Cybernetics, 1979, 9(1): 62-66. DOI:10.1109/TSMC.1979.4310076 ( 0) 0)
|
| [8] |
Paes R L, Lorenzzetti J A, Gherardi D F M. Ship detection using TerraSAR-X images in the Campos Basin (Brazil). IEEE Geoscience and Remote Sensing Letters, 2010, 7(3): 545-548. DOI:10.1109/LGRS.2010.2041322 ( 0) 0)
|
| [9] |
Jiang S F, Wang C, Zhang B, et al. Ship detection based on feature confidence for high resolution sar images. 2012 IEEE International Geoscience and Remote Sensing Symposium. Piscataway: IEEE, 2012. 6844-6847. DOI: 10.1109/IGARSS.2012.6352591.
http://ieeexplore.ieee.org/xpls/abs_all.jsp?arnumber=6352591
( 0) 0)
|
| [10] |
Zhang C J. Digital Image Processing and the Application. Beijing: Tsinghua University, 2013.
( 0) 0)
|
| [11] |
Jiang S F, Wu F, Wang C, et al. Improved ship detection for high resolution SAR images based on Kernel density estimation. 2012 2nd International Conference on Remote Sensing and Transportation Engineering(RSETE). Piscataway: IEEE, 2012. 1-4. DOI: 10.1109/RSETE.2012.6260596.
http://ieeexplore.ieee.org/xpls/icp.jsp?arnumber=6260596
( 0) 0)
|
| [12] |
Trunk G V. Modification of "Radar properties of non-Rayleigh sea clutter". IEEE Trans. on Aerospace and Electronic Systems, 1973, AES-9(1): 110. DOI:10.1109/TAES.1973.309709 ( 0) 0)
|
 2018, Vol. 25


