2. School of Earth Sciences and Engineering, Hohai University, Nanjing 210098, China
Soil water, as a dissolved nutrient and reservoir for plants, plays an important role in the hydrologic cycle.Soil water can be naturally recharged by several sources, such as local precipitation, surface water, and groundwater.Soil water is a link between local precipitation and groundwater.Thus, water movement in the unsaturated zone, which is strongly related to hydrological conditions, must be elucidated[1-2].
Migration of soil water is very important in water sciences research.In the past, the research was mainly concentrated in the aspects of soil moisture content and water utilization[3-5], migration of soil water and salt[6-9], soil water hydrodynamics and numerical simulation model (The soil water movement model was established using hydraulic parameter, such as Kostiakov model, Philip model, Green-Ampt model, Hydrus-1D, Hydrus-2D model, FEFLOW model, SUTRA model etc.)[10-15]et al., which are studies of physics characteristics of soil water.However, in some arid and semi-arid areas, due to the low soil moisture content, the study of traditional hydrological method is inapplicable.With the continuous development of isotope hydrology, isotope tracer method has been widely used in eco-hydrology.Hydrogen and oxygen isotopes are as natural tracers to study the infiltration, evaporation and transpiration of soil water.According to the date of hydrogen and oxygen isotopes in soil water, the information of soil water movement can be obtained, and the mechanism of soil hydrological process is revealed.Due to the weak diffusion of chemical solutes in the unsaturated zone, it helps to preserve the geochemical information associated with the supply source of soil water[16].Especially because of the high solubility and stability of chloride ions, it is an ideal natural tracer.At present, hydrogen-oxygen isotope tracer technique[17-22]and chlorine ion tracing method[23-24] are widely used in the research of soil water migration at home and abroad.
Soil water is related to phreatic water.Water in the phreatic zone migrates into soil pores by capillary force, thereby recharging soil water.In arid and semi-arid regions, phreatic water is the main source of water consumed by natural vegetation.Phreatic evaporation is a process that water migrates from the phreatic zone to the unsaturated zone and then to air through soil evaporation and crop transpiration.Numerous studies have explored the characteristics and mechanism of phreatic evaporation.Cheng Xianjun studied phreatic evaporation with and without the effect of crop growth[25].Anne et al.[26] demonstrated the weak influence of soil characteristics on phreatic evaporation flux in arid regions.Hu Shunjun et al.[27] established models for calculating the amount of phreatic evaporation on Tamarix-vegetated land.Sun et al.[28-30] studied the effects of soil texture and groundwater burial depth on phreatic evaporation.Li et al.[31-32] conducted a condensation experiment in a coved canopy; they revealed the continued phreatic evaporation in the Dunhuang Mogao Grottoes with a depth of groundwater table more than 200 m and proposed the evaporation mechanism of soil water.Hydrogen-oxygen isotope tracer technique was also used in the research of phreatic evaporation.Yu et al.[33] studied the recharge sources of soil water by D and 18O stable isotopes, it was concluded that soil water below 130 cm was recharged by evaporation of phreatic water in middle reaches of Heihe river.Li et al.[34-35] proposed that phreatic water was the main source of soil water in extremely arid deserts through the analysis of hydrogen and oxygen isotopes.
Phreatic evaporation considerably affects water in the unsaturated zone.Nevertheless, numerous studies have investigated the distribution and migration law of soil water.In the present study, a phreatic evaporation experiment is designed, with phreatic water as the only recharge source for soil water.The movement law of soil water is studied through the distribution of chloride concentration, as well as δD and δ18O values of soil water in different profiles.This study provides a basis for research on soil water movement mechanisms in arid and semi-arid areas with minimal precipitation.
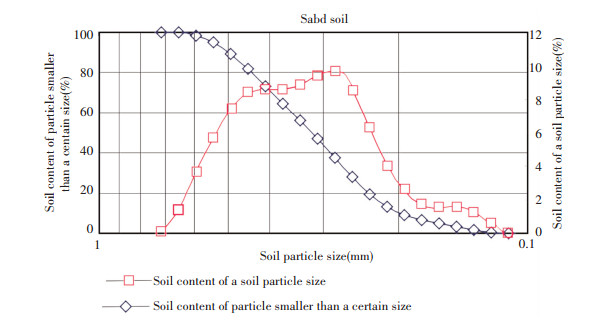
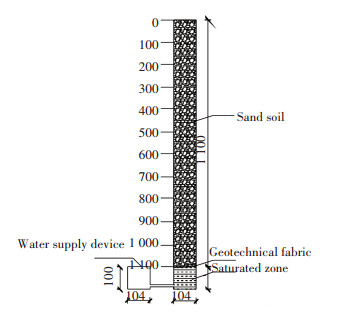
2 Experiment 2.1 Materials and MethodsThese experiments were carried out in Hohai University.All columns were performed with sand, and its grading curve is shown in Fig. 1.Six polyvinyl chloride columns of Φ104 mm×1 200 mm were assigned as column a, b, c, d, e, and f according to the sequence of the sampling.The six soil columns are parallel.There is a difference in the time of the experience of evaporation.The base (100 mm height) of the column was packed with gravel to simulate the saturated zone.Above the gravel layer, it was packed with homogeneous air-dried sand soil.The two parts were separated by geotechnical fabric.
|
Figure 1 Distribution of sand particle |
Prior to filling, sand soil was air dried for 48 h, sifted using an iron screen (2 mm aperture), and then well-mixed.One plastic bottle of initially dried sand was sealed up to determine the initial chloride content.The average dry density of the sand column was 1.57 g/cm3.The phreatic water level was maintained by a water supply device of about 100 mm depth connected to a soil column.A vegetable oil layer of about 3 mm thick was placed on the water surface in the water supply device to avoid evaporation.The schematic of the experimental setup is shown in Fig. 2.Tap water with -59.4‰ of δD and -8.42‰ of δ18O was stored and sealed.
|
Figure 2 Scheme of the experimental setup |
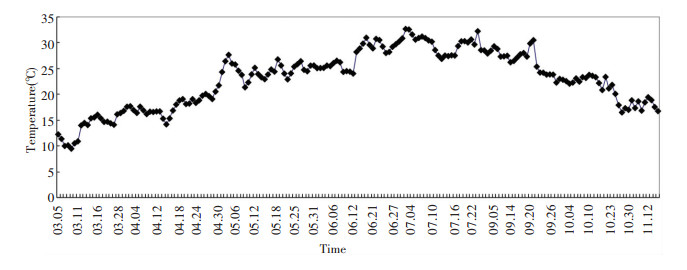
During the experiment, soil water in the six columns did not rise to the soil surface.The first sample of each column was obtained at the maximum height reached by soil water.A dry sand layer of 39-65 cm thickness was placed on top of the moist sand.For columns a, b and c, the sampling interval is 10 cm basically.In upper parts of columns d, e and f, the sampling interval is 5 cm, but 10 cm in lower parts.In this experiment, phreatic water was the only recharge source for soil water, and the effect of rainfall was neglected.Table 1 shows the basic information regarding the six columns with regard to sampling time, sampling number, duration, and cumulative volume of water added.Temperature and relative humidity indoors were determined by a thermohygrograph.The experiment began on December 21, and the end time was November 25 of the next year, which lasted 339 d.
| Table 1 Basic information on the six profiles |
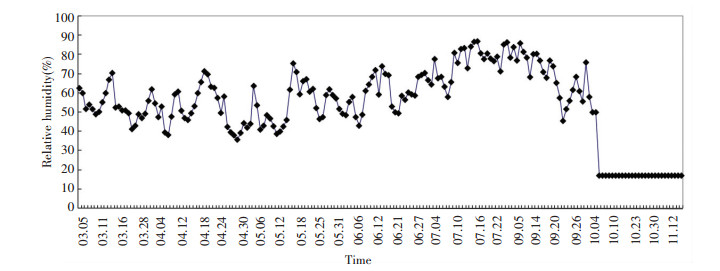
As shown in Table 1, the increase in additional water is only 20 mL from March 5 to June 21, which shows a very low evaporation rate.The evaporation rate of phreatic water is related to relative humidity.Thus, the values for relative humidity on the surface of columns d, e, and f are decreased by silica gel from October by about 17%.During the whole experiment, temperature and relative humidity were recorded and the results are shown in Figs. 3 and 4, respectively.
|
Figure 3 Daily mean temperature during the experiment |
|
Figure 4 Daily mean relative humidity at the surface of columns during the experiment |
2.2 Measurements of Chloride and Isotopic Compositions
Moisture content was analyzed by oven-drying method with an analytical precision higher than 1%. The soil sample was oven dried for 8 h at 105 ℃ to analyze the chloride content of soil water.Afterward, 100 g of the dried sample was mixed with 100 mL of deionized water.The mixture was allowed to equilibrate for 48 h under periodical stirring to completely dissolve soluble salts on the particle surface.After equilibration, the leachate was filtered through a 0.45 μ m membrane. Leachate samples were analyzed by ion chromatography (ICS-2000) with a detection precision of 0.000 1 mg/L at the State Key Laboratory of Hydrology, Water Resources and Hydraulic Engineering, Hohai University.The original chloride concentration of soil water can be calculated through the concentration of the leachate and the moisture content.Based on the mass conservation of chloride ion:
| $ {\rho _{{\rm{sw}}}}({\rm{Cl}}) \times {m_{\rm{s}}} \times \theta = {m_{\rm{d}}} \times {\rho _{\rm{f}}}({\rm{Cl}}) $ | (1) |
where ρsw(Cl) refers to the original chloride concentration in soil water (mg/L), ms refers to the mass of dry sand (g), θ is the moisture content by weight, md is the mass of the added deionized water (g), and ρf(Cl) refers to the chloride concentration of the leachate (mg/L).
In the experiment, dry sand and deionized water each weighed 100 g.Hence, ρsw(Cl) can be calculated by Eq.(2) as follows:
| $ {\rho _{{\rm{sw}}}}({\rm{Cl}}) = \frac{{{m_{\rm{d}}} \times {\rho _{\rm{f}}}({\rm{Cl}})/{m_{\rm{s}}}}}{\theta } = \frac{{{\rho _{\rm{f}}}({\rm{Cl}})}}{\theta } $ | (2) |
Before calculating the ρsw(Cl) value, the chloride content of the initial sand must first be excluded.For the initial sand, the chloride content of the leachate ρfl(Cl) is 0.516 3 mg/L.Consequently, Eq.(2) becomes:
| $ {\rho _{{\rm{sw}}}}({\rm{Cl}}) = \frac{{{\rho _{\rm{f}}}({\rm{Cl}})-{\rho _{{\rm{f1}}}}({\rm{Cl}})}}{\theta } $ | (3) |
Stable isotope analysis was conducted at the State Key Laboratory of Hydrology, Water Resources and Hydraulic Engineering, Hohai University.Soil water was extracted by vacuum distillation at 100 ℃ for 120 min.The hydrogen and oxygen isotopes were reported in delta (δ) notation as permil (‰) differences relative to the V-SMOW (Vienna standard mean ocean water) international standard.
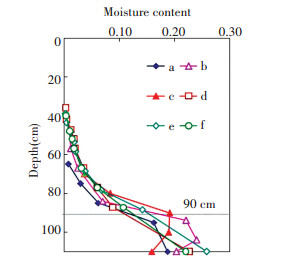
3 Results and Discussion 3.1 Vertical Moisture Content ProfilesPrevious study showed that moisture content gradually decreases upward from the groundwater table.Within the same depth, moisture content increases with prolonged experiment time, but the increasing rate is decreasing.Data on moisture content from the six columns are shown as a function of depth (Fig. 5).High moisture content was observed below 90 cm, there was gravity water outflow in the process of stratified sampling.Errors in the moisture content by drying method of the samples are expected below 90 cm, for example, column b and c.Hence, moisture content below 90 cm is not discussed in our analysis.Fig. 5 also shows that the rising height of capillary water and the moisture content at the same depth evidently increase from column a to columns b and c.The moisture content at each depth in columns d, e, and f exhibits small differences and exceeds that of column b.This finding shows that moisture content is in a steady state in the later experiment.Soil pores are various kinds of holes in the soil with different sizes and different shapes.Capillary water rapidly rises in large pores and slowly rises in small ones[36].The increase in moisture content within the same depth reflects the gradual filling of water of the smaller pores until they are occupied.
|
Figure 5 Vertical moisture content profiles |
3.2 Vertical Chloride Content Profiles
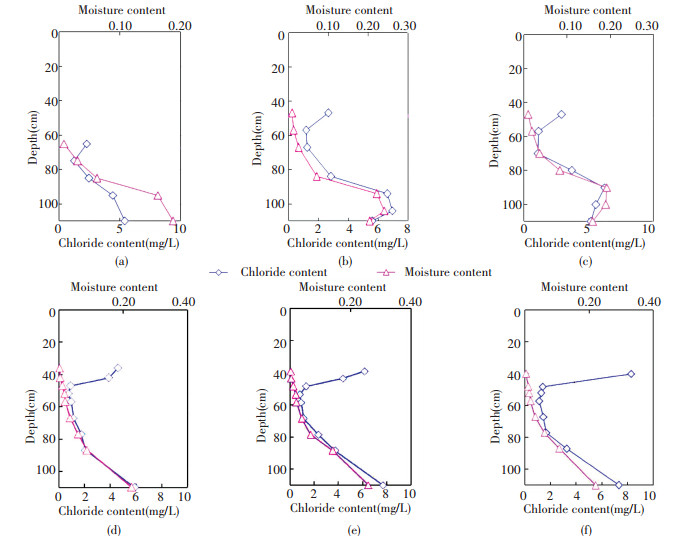
Rod[37] considered that the moisture content above the groundwater table gradually decreases upwards, the soil section with a gradient of moisture content from saturated to minimum water holding capacity is referred as the active layer of capillary water.In this layer, soil water is designated as the capillary supporting water and holds water pressure contact with groundwater.The minimum water holding capacity of sand soil is 3%-5%.Uniform loose sand was used in the experiment, and the minimum water holding capacity was set as 0.03.From the distribution of moisture content in columns d, e, and f, the active layer thickness of capillary water is about 45 cm.The moisture content and chloride concentration of the leachates ρf(Cl) in every column are shown as a function of depth in Fig. 6.Moisture content and ρf(Cl) show the same variation at moisture contents higher than 0.03.This moisture content corresponds to the hanging water and film water layers above the active layer of capillary water, which has no water pressure contact with the capillary water[37].Generally, the hanging water and film water are maintained by sorptive ability.In Fig. 6, near the maximum height of sampling, moisture contents are lower than 0.03, which is the minimum water holding capacity.Opposite variations in moisture content and ρf(Cl) in the hanging water and film water layers are observed at moisture contents lower than 0.03.Above the active layer of capillary water, the moisture content decreases upwards, but ρf(Cl) gradually increases.
|
Figure 6 Distribution of moisture content and ρf(Cl) value in each column |
ρf(Cl) reflects cumulative chloride content in a specific quality of soil.The cumulative chloride is induced by the evaporation of soil water.In soil water evaporation, water is lost and chloride is preserved.The high ρf(Cl) value shows that much water is present toward the upper layers, particularly in the hanging water and film water layers, thereby reflecting the influence of evaporation on soil water combined with the lower water content.
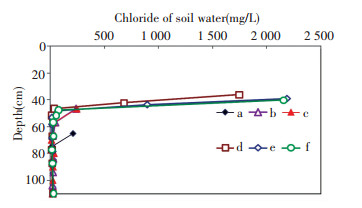
ρsw(Cl) values of samples at different depths can be calculated by Eq.(3).Data on ρsw(Cl) from the six columns are shown in Fig. 7.
|
Figure 7 Chloride concentration of soil water in six columns |
The ρsw(Cl) values in the active layer of the capillary water are lower and almost stable (15-38 mg/L), with a mean value at 25 mg/L, which is close to the chloride concentration of phreatic water (26 mg/L).With prolonged experimental duration, the ρsw(Cl) values of the samples above the active layer continuously increase.In particular, the chloride concentration of the first samples ρswm(Cl) in the six columns lies ranges from 212 mg/L to 2 189 mg/L, which exceeds that of phreatic water.As columns d, e, and f are not completely parallel, the ρswm(Cl) values from the three columns differ, as shown in Fig. 7.Nevertheless, soil water above the active layer of capillary water is apparently influenced by evaporation.Soil water at about 39 cm exhibits the strongest evaporation, although a dry sand layer of about 39 cm thickness is present above the moist sand.During evaporation, water vapor is lost and chloride accumulates in soil water.From the study of water and salt transport rule in tight sand soil, soil water does not rise to the soil surface but the soil water above active layer of capillary water remains affected by evaporation.From Table 1, the phreatic water recharge amount of column b is 20 mL higher than that of column a, whereas the height of soil water rise is 18 cm higher.Between columns d and b, the increase in amount of phreatic water recharge is 200 mL, but the increase in the height of soil water is only about 9 cm.These findings reveal the presence of evaporation in sand soil profiles.Part of the consumption of phreatic water is used to increase the height of soil water rise, and the other part is lost to soil water evaporation.In this study, the total duration of experimentation is 339 d, and the moist sand layer appears at a depth of 36-39 cm.Soil water may continue to rise if the duration of experimentation is extended.
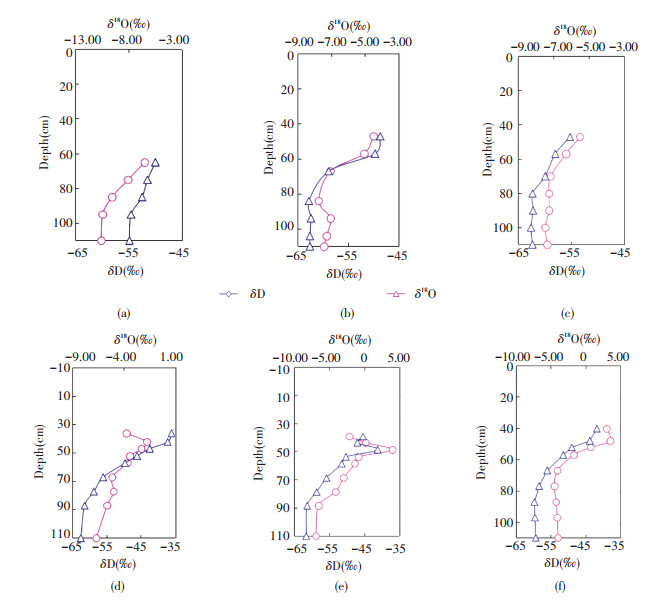
3.3 Vertical δD and δ18O ProfilesData on δD and δ18O values of soil water from the six columns are shown as a function of depth in Fig. 8.The plots show a similar trend between δD and δ18O. All columns display the lowest isotopic values at the bottom, particularly at depths of 80-110 cm, where isotopic values minimally differ.At depths higher than 80 cm, soil water is constantly enriched in heavy isotopes.Soil water is affected by evaporation from the distribution of δD and δ18O values, which coincides with the analysis of chloride content.Near the top of moist sand layers in columns d, e, and f, δD and δ18O values exhibit different changes.In column d, the δD value varies to the negative direction, whereas δ18O varies to the positive direction near the top of moisture sand layers.The top layer of column d is under low relative humidity; therefore, soil water in this position is strongly influenced by evaporation.Craig[38] found that isotope fractionation existed in the process of water evaporation, and the dynamic effect had an effect on the evaporation and fractionation, and its influence depended mainly on the relative humidity of the surrounding environment[39].The top layer of column d is under low relative humidity; therefore, soil water at this position is strongly influenced by evaporation and kinetic fractionation plays a significant role in isotopic fractionation.The δD and δ18O values of soil water exhibit inconsistent changes near the top of the moist sand layers in column d because hydrogen and oxygen isotopes exhibit different degrees of responsiveness to kinetic fractionation.The δD and δ18O values show the same pattern in column e but decrease toward the surface above the maximum isotope value.This observation is due to diffusion of water vapor at the top of the column[40].According Barnes and Allison[41], as a significant evaporation occurs in the zone, the soil profile can be divided into two parts:an upper profile, in which water movement is through vapor diffusion, and the lower profile, in which liquid transport is significant[41].The isotopic value variations in column f are similar to those in column d.
|
Figure 8 Distribution of δD and δ18O values of soil water in each column |
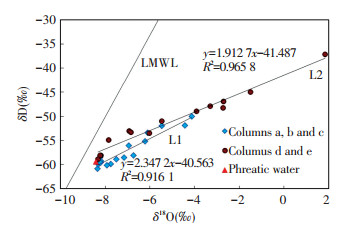
If the variations of temperature and relative humidity against time are ignored, soil water in columns a, b, and c show the same evaporation conditions.The evaporation trend line (L1) for soil water in columns a, b, and c is shown in Fig. 9 (the trend line is based on δ18O and δD values), which has an equation of δD=2.347 2×δ18O-40.563 and a high correlation coefficient (R2=0.916 1).L1 has smaller slope (2.347 2), which indicates that the relative humidity in these columns is low.Soil water at depths of 80-110 cm in column f is more enriched in heavy isotopes than the soil water at the same depth in the other columns.This phenomenon shows that phreatic water may be influenced by evaporation before recharging soil water.In columns d and e, the kinetic fractionation factor plays a great role in determining the relationship between δ18O and δD values of soil water above 45 cm.Thus, the evaporation trend line L2 is based on δ18O and δD values from soil water in columns d and e, with a lower slope (1.912 7) and high correlation coefficient (R2=0.965 8).The slope of L2 is lower than that of L1, which is consistent with the relative humidity.From Fig. 9, the isotopic data of phreatic water is on line L1, but not on line L2.As the evaporation front moves further into the soil profile, the relative importance of the kinetic effect increases because of the development of a superficial dry layer where diffusive transport of water vapor dominates, leading to a reduction in the slope of the δD and δ18O relationship[41-42].From Fig. 8, liquid transport is significant in columns a, b, and c; thus, the isotopic data of phreatic water is on line L1.In columns d and e, the δ18O and δD values of soil water above 45 cm are determined by water vapor; hence, the isotopic data of phreatic water is not on line L2.
|
Figure 9 Plot of δ18O vs. δD for soil water |
Generally, the capillary water is maintained by the capillary force in soil pores.In this experiment, the distributions of water and salt in the hanging and film water layers differ from those in the active layer of capillary water.After being influenced by evaporation, the film water is also enriched in heavy isotopes.
4 Conclusions1) In the active layer of the capillary water, the chloride concentration of the leachate ρf(Cl) directly varied with moisture content.However, in the hanging water and film water layers, the ρf(Cl) value varied inversely with moisture content.A loss of evaporation from soil water and the presence of salt accumulation in the dry sand layer of about 39 cm above the moist sand layer were both observed.
2) δD and δ18O profiles showed that soil water enrichment with heavy isotopes constantly increased as the depths increased up to 80 cm.Soil water was also demonstrated to be influenced by evaporation.
3) In the experiment, part of the consumption of phreatic water was used to increase the height of soil water rise, whereas another part was lost to evaporation from the sand profile.Above the active layer of capillary water, soil water moved upward in the form of liquid water.Soil water could continuously rise with prolonged experiment duration.
In addition, there are the following deficiencies of the experiment in this paper, ①In the process of evaporation, soil surface moisture was reduced, but the evaporation process of actual environment was not simulated; ②The change of capillary water rise height and soil moisture content in soil column was not monitored in real time, the soil column structure was destroyed in the collection of soil water and there was gravity water outflow in lower part of the soil column.
| [1] |
De Vries J J, Simmers I. Groundwater recharge:An overview of processes and challenges. Hydrogeol J, 2002, 10: 5-17. DOI:10.1007/s10040-001-0171-7 ( 0) 0)
|
| [2] |
Mazor E. Chemical and Isotopic Groundwater Hydrology:The Applied Approach. 3rd ed. New York: Marcel Dekker Inc, 1997, 413.
( 0) 0)
|
| [3] |
Gardner C M K, Dean T J, Cooper J D. Soil water content measurement with a high-frequency capacitance sensor. Journal of Agricultural Engineering Research, 1998, 71(4): 395-403. DOI:10.1006/jaer.1998.0338 ( 0) 0)
|
| [4] |
Seyfriend M S, Murdock M D. Measurement of soil water content with a 50-MHz soil dielectric sensor. Soil Science Society of America Journal, 2004, 68(2): 394-403. DOI:10.2136/sssaj2004.3940 ( 0) 0)
|
| [5] |
Ishizuka M, Mikami M. Measurement of soil water content in a hyper-arid environment using time-domain reflectometry sensors. Hydrological Processes, 2005, 19(19): 3911-3920. DOI:10.1002/(ISSN)1099-1085 ( 0) 0)
|
| [6] |
Wu L, Skaggs T H, Shouse P J, et al. State space analysis of soil water and salinity regimes in a loam soil underlain by shallow groundwater. Soil Science Society of America Journal, 2001, 65(4): 1065-1074. DOI:10.2136/sssaj2001.6541065x ( 0) 0)
|
| [7] |
Zhang N, Fan G, Lee K H, et al. Simultaneous measurement of soil water content and salinity using a frequency-response method. Soil Science Society of America Journal, 2004, 68(5): 1515-1525. DOI:10.2136/sssaj2004.1515 ( 0) 0)
|
| [8] |
Wittler J M, Cardon G E, Gates T K, et al. Calibration of electromagnetic induction for regional assessment of soil water salinity in an irrigated valley. Journal of Irrigation and Drainage Engineering-Asce, 2006, 132(5): 436-444. DOI:10.1061/(ASCE)0733-9437(2006)132:5(436) ( 0) 0)
|
| [9] |
Ahmed B A O, Yamamoto T, Rasiah V, et al. The impact of saline water irrigation management options in a dune sand on available soil water and its salinity. Agricultural Water Management, 2007, 88(1/3): 63-72. ( 0) 0)
|
| [10] |
Kennedy G W, Price J S. Simulating soil water dynamics in a cutover bog. Water Resources Research, 2004, 40(12): 13. ( 0) 0)
|
| [11] |
Laczova E, Stekauerova V. Soil water dynamics of the hillside. Cereal Research Communications, 2007, 35(2): 705-708. DOI:10.1556/CRC.35.2007.2.135 ( 0) 0)
|
| [12] |
Shao Xiaomei, Yan Changrong, Xu Zhenjian. Process in monitoring and simulation of soil moisture. Progress in Geography, 2004, 23(3): 58-66. ( 0) 0)
|
| [13] |
Šimůnek J, Šejna M, Saito H, et al. The hydrus-1D software package for simulating the movement of water, heat, and multiple solutes in variably saturated media, version 4.16, HYDRUS software series 3. Riverside: University of California Riverside, 2013.
( 0) 0)
|
| [14] |
Trefry M G, Muffels C. FEFLOW:A finite-element ground water flow and transport modeling tool. Ground Water, 2007, 45(5): 525-528. DOI:10.1111/gwat.2007.45.issue-5 ( 0) 0)
|
| [15] |
Voss C I, Provost A M. A Model for Saturated-Unsaturated Variable-Density Ground-Water Flow with Solute or Energy Transport. Reston:US Geological Survey, 2002. ( 0) 0)
|
| [16] |
Chen Zongyu, Bi Erping, Nie Zhenlong, et al. A tentative discussion on paleohydrological and paleoclimatical information from unsaturated zone profile. Acta Geoscientia Sinica, 2001, 22(4): 335-339. ( 0) 0)
|
| [17] |
Lee K S, Kim J M, Lee D R, et al. Analysis of water movement through an unsaturated soil zone in Jeju Island, Korea using stable oxygen and hydrogen isotopes. Journal of Hydrology, 2007, 345: 199-211. DOI:10.1016/j.jhydrol.2007.08.006 ( 0) 0)
|
| [18] |
Yang Y G, Xiao H L, Zou S B, et al. Hydrogen and oxygen isotopic records in monthly scales variations of hydrological characteristics in the different landscape zones. Journal of Hydrology, 2013, 499: 124-131. DOI:10.1016/j.jhydrol.2013.06.025 ( 0) 0)
|
| [19] |
Cheng Liping, Liu Wenzhao. Characteristics of stable isotopes in soil water under several typical land use patterns on Loess Tableland. Chinese Journal of Applied Ecology, 2012, 23(3): 651-658. ( 0) 0)
|
| [20] |
Cheng Liping. The Characteristics of Soil Water in Deep Loess Profile and the Process of Groundwater Recharge on the Loess Tableland. Institute of Soil and Water Conservation, 2013. ( 0) 0)
|
| [21] |
Jin Yurong, Lu Kexin, Li Peng, et al. Research on soil water movement based on stable isotopes. Acta Pedologica Sinica, 2015, 52(4): 792-801. ( 0) 0)
|
| [22] |
Yang Yonggang, Li Guoqin, Jiao Wentao, et al. Migration process of soil water in the unsaturated zone of the Loess Plateau. Advances in Water Science, 2016, 27(4): 529-534. ( 0) 0)
|
| [23] |
Liu Beiling, Fred P, Susan H, et al. Water movement in desert soil traced by hydrogen and oxygen isotopes, chloride, and chlorine-36, southern Arizona. Journal of Hydrology, 1995, 168: 91-110. DOI:10.1016/0022-1694(94)02646-S ( 0) 0)
|
| [24] |
Newman B D, Campbell A R, Wilcox B P. Tracer-based studies of soil water movement in semi-arid forests of New Mexico. Journal of Hydrology, 1997, 196: 251-270. DOI:10.1016/S0022-1694(96)03320-3 ( 0) 0)
|
| [25] |
Cheng X J. The study on relationship of phreatic evaporation under no crop growth and crops conditions. Journal of Hydraulic Engineering, 1993, 6: 37-42. ( 0) 0)
|
| [26] |
Anne C R, Bruno P, Amal T, et al. Is the evaporation from phreatic aquifers in arid zones independent of the soil characteristics. Comptes Rendus de l'Académie des Sciences -Series IIA -Earth and Planetary Science, 1998, 326(3): 159-165. ( 0) 0)
|
| [27] |
Hu Shunjun, Tian Changyan, Song Yudong, et al. Models for calculating phreatic water evaporation on bare and Tamarix-vegetated lands. Chinese Science Bulletin, 2006, 51(s1): 43-50. DOI:10.1007/s11434-006-8206-z ( 0) 0)
|
| [28] |
Sun Xiaoxu, Wang Kaicai, Ding Keqiang. Experimental study on the feature of phreatic evaporation. Yellow River, 2015, 37(3): 62-65. ( 0) 0)
|
| [29] |
Feng Gongtang, You Xiyao, Li Dakang, et al. Analysis on the relationships of phreatic water evaporation with the underground water level and soil quality in arid area. Arid Zone Research, 1995, 12(3): 78-84. ( 0) 0)
|
| [30] |
Lai Jianbin, Wang Yongping, Jiang Qinghua, et al. Study on phreatic evaporation under different soil textures. Journal of Northwest Sci-Tech University of Agriculture and Forestry, 2003, 31(6): 153-157. ( 0) 0)
|
| [31] |
Li Hongshou, Wang Wangfu, Zhang Guobin, et al. Moisture interaction between soil and atmosphere in extreme dry area. Journal of Earth Sciences and Environment, 2010, 32(2): 183-188. ( 0) 0)
|
| [32] |
Li Hongshou, Wang Wangfu, Zhang Guobin, et al. Qualitative analysis on moisture source in extreme arid dune with coved canopy method. Journal of Desert Research, 2010, 30(1): 97-103. ( 0) 0)
|
| [33] |
Yu Shaowen, Sun Ziyong, Zhou Aiguo, et al. Determination of water sources of Gobi plant by D and 18O stable isotopes in middle reaches of Heihe river. Journal of Desert Research, 2012, 32(3): 717-723. ( 0) 0)
|
| [34] |
Li Hongshou, Wang Wangfu, Zhan Hongtao, et al. The use of stable hydrogen and oxygen isotopes to determine the source of evaporation water in extremely arid area. Acta Ecologica Sinica, 2016, 36(22): 7436-7445. ( 0) 0)
|
| [35] |
Li Hongshou, Wang Wangfu, Liu Benli. The daily evaporation characteristics of deeply buried phreatic water in an extremely arid region. Journal of Hydrology, 2014, 514: 172-179. DOI:10.1016/j.jhydrol.2014.04.025 ( 0) 0)
|
| [36] |
Loo Huanyen, Jan Aifen, Shien Chuhwa. Experimental investigation of upward movement of soil water in layered systems. Acta Pedologica Sinica, 1965, 13(3): 312-324. ( 0) 0)
|
| [37] |
Rod A A. Soil and Soil Moisture Properties. Yuan Jianfang, translate.Beijing: Science Press, 1958, 41-42.
( 0) 0)
|
| [38] |
Craig H, Gordon L J, Honbe Y. Isotopic exchange effects in the evaporation of water. J Geo Res, 1963, 68: 5079-5087. DOI:10.1029/JZ068i017p05079 ( 0) 0)
|
| [39] |
Carey G, Feng X. A stable isotope study of soil water:Evidence for mixing and preferential flow paths. GEODERMA, 2004, 119: 97-111. DOI:10.1016/S0016-7061(03)00243-X ( 0) 0)
|
| [40] |
Barnes C J, Allison G B. Tracing of water movement in the unsaturated zone using stable isotopes of hydrogen and oxygen. J Hydrol, 1988, 100: 143-176. ( 0) 0)
|
| [41] |
Barnes C J, Allison G B. The distribution of deuterium and oxygen-18 in dry soils:1 theory. J Hydrol, 1983, 60: 141-156. DOI:10.1016/0022-1694(83)90018-5 ( 0) 0)
|
| [42] |
Lee K S, Kim J M, Lee D R, et al. Analysis of water movement through an unsaturated soil zone in Jeju Island, Korea using stable oxygen and hydrogen isotopes. Journal of Hydrology, 2007, 345: 199-211. DOI:10.1016/j.jhydrol.2007.08.006 ( 0) 0)
|
 2018, Vol. 25


