Shannon-Nyquist sampling theory is a crucial criterion of signal digitization, which concerns transforming signals from analog to digital[1]. In recent years, traditional Shannon-Nyquist sampling theory has faced the problem of super-high sampling frequency and mass data collection, which heavily restricts signal transmission, storage, and processing. Consequently, researchers have begun to explore high efficiency sparse sampling methods. In 2002, Vetterli[2] proposed a sampling framework based on the finite rate of innovation (FRI). The theory indicated that, by using a specially designed sampling kernel to smooth the signal, an FRI signal can be uniformly sampled at the rate of innovation (ROI), and then be uniquely and accurately reconstructed from the sparse sampled data. Therefore, FRI sampling can substantially reduce the sampling speed and reduce the sampling data. However, this sampling method is unsuitable for all signal types except for streams of Diracs, nonuniform splines, derivatives of Diracs and piecewise polynomials[2]. Scholars have expanded the applications of this sampling theory to the fields of wireless communication, radar detection, ultrasonic medicine, and industrial ultrasonic testing. Blu et al.[3] introduced FRI sampling theory to wireless communication and solved the problems of GHz signal sampling in 2008. In 2009, Gurbuz et al.[4] applied the FRI sampling method to ground penetrating radar and implemented the low speed sampling of radar signals. In 2010, Eldar et al.[5] applied FRI sparse sampling to medical ultrasonic testing, and reconstructed B-scan images at extra-low sampling rates. The next year, the Eldar[6] research group proposed a multichannel FRI sampling framework, which had the property of strong noise resistance and easy hardware implementation. In 2015, Peng[7] introduced FRI sparse sampling theory to pipeline flaw ultrasonic testing, and solved the problem of mass sampling data from ultrasonic transducer arrays, reconstructing the signal from sparse sampling data. Nowadays, the range of FRI signals has been expanded to signals possessing the property of FRI signals after processing.
Similar to the Shannon-Nyquist sampling method, the FRI sampling procedure involves sampling and reconstruction. The first signal reconstruction method used with FRI sparse sampling data is the annihilating filter (AF) method[2]. The AF method demonstrates that for an FRI signal, if the sampling rate is not lower than its ROI, it can be reconstructed undistorted. In 2008, Blu et al.[3] examined the influence of noise on FRI sampling and proposed a method to denoise the sparse data by using a Cadow algorithm before signal reconstruction. Subsequently, some scholars have proposed subspace theory-based signal reconstruction methods such as the estimation of signal parameters via rotational invariance techniques method[8] and multiple signal classification method[9]. These methods entail less operands and necessitate a larger sampling rate than the FRI’s ROI if the signal is to be accurately reconstructed. In recent years, statistical methods such as genetic algorithms[10] and the Gibbs method[11] have also been introduced to reconstruct the signals from FRI sampling data. But these methods are unsuitable for high freedom signals owing to greater computation.
Reconstructing an FRI pulse stream signal with a Gaussian envelope from sparse sampling data necessitates the pulse number being known accurately beforehand. The methods for obtaining the pulse number include the pre-given and heuristic methods, both of which have the shortcoming of blindness, and reduce the accuracy of the evaluating signal parameters obtained from sparse sampling data, as well as the efficiency of the signal reconstruction algorithm. In actual ultrasonic pulse stream signals, the pulse number has an explicit physical meaning, which indicates a flawed echo number. The pulse acts as a characteristic parameter of flaws and must be evaluated from the sampling data. Because the sampling interval is considerably larger than the Nyquist sampling interval, the pulse number cannot be obtained from the sparse sampling data directly. Some scholars proposed the short-time matrix pencil method[12-13] based on matrix space spectral analysis to solve this problem. Although using this method to reconstruct the signal does not require preliminary knowledge of the pulse number, and has a higher signal reconstruction resolution compared with the annihilating filter method, it can only be applied for the Dirac pulse stream. Hence, the short-time matrix pencil method is unsuitable for the ultrasonic pulse stream signal.
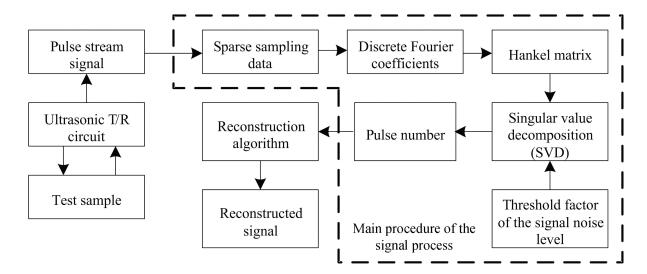
To solve the preceding problem, we propose a pulse number obtaining method based on singular value decomposition (SVD)[14-15]. This method can obtain the pulse number from sparse sampling data without any prior knowledge of the pulse stream signal. When sparse sampling data are obtained from the ultrasonic pulse stream signal using the FRI sampling method, they are transformed to discrete Fourier coefficients and a Hankel matrix is constructed that is then decomposed to a subspace using an SVD to obtain the coefficients of decomposition in the subspace. If the threshold factor of the signal noise level is determined, and the noise is removed according to the threshold factor, the remaining number of the singular value in the subspace is the pulse number. The flow chart of main procedure for the proposed signal processing method is shown in Fig. 1.
|
Figure 1 Flow chart of main procedure for the signal process |
2 Principle of FRI Sparse Sampling and Reconstruction for Ultrasonic Signals 2.1 Sparse Sampling
The core concepts of FRI sampling theory are the filtering of the FRI signal using a specially designed filter (sampling kernel) and the sampling of the signal at uniform intervals. The sampled sparse data are then converted to discrete Fourier coefficients, the parameters of the FRI signal are estimated using a spectrum analysis algorithm, and the FRI signal is reconstructed using the estimated parameters. A representation of FRI sampling theory is shown in Fig. 2.

|
Figure 2 Representation of FRI sampling theory |
In Fig. 2, x(t) is the FRI signal. For ultrasonic testing, x(t) denotes the ultrasonic pulse stream signal obtained from the real ultrasonic signal after processing, s*(-t) is the specially designed filter (sampling kernel), c[n] is the sparse sampling data, n is the positive integer, T is the sampling interval, and
The sparse sampling data c[n] can be expressed through its Fourier transform coefficients as follows:
| $ \begin{gathered} c\left[n \right] = \int_{ - \infty }^\infty {x\left( t \right){s^*}\left( {t - nT} \right){\text{d}}t} = \hfill \\ \;\;\;\;\;\;\;\;\;\left\langle {x\left( t \right), {s^*}\left( {t - nT} \right)} \right\rangle = \hfill \\ \;\;\;\;\;\;\;\;\;\sum\limits_k {X\left[k \right]\left\langle {{{\text{e}}^{\frac{{{\text{j}}2\pi kt}}{\tau }}}, {s^*}\left( {t - nT} \right)} \right\rangle = } \hfill \\ \;\;\;\;\;\;\;\;\;\sum\limits_k {X\left[k \right]{S^*}\left( {\frac{{2\pi k}}{\tau }} \right){{\text{e}}^{{\text{j}}\left( {\frac{{2\pi knT}}{\tau }} \right)}}} \hfill \\ \end{gathered} $ | (1) |
where k∈Z, X[k] represents the discrete Fourier transform coefficients of c[n], τ is the time duration of the FRI signal, and S(w) is the continuous Fourier transform of s(t). If the spectrum of the sampling kernel satisfies the condition
| $ S\left( w \right) = \left\{ \begin{gathered} 0, \;\;\;\;\;\omega = \frac{{2\pi k}}{\tau }k \notin \kappa \hfill \\ {\text{nonzero, }}\omega {\text{ = }}\frac{{2\pi k}}{\tau }k \in \kappa \hfill \\ {\text{arbitrary}}, {\text{otherwise}} \hfill \\ \end{gathered} \right. $ | (2) |
where k∈κ, κ is the continuous integer taking value interval with length K,
Suppose S is a K×K diagonal matrix, the diagonal element is
| $ \mathit{\boldsymbol{X}} = {\mathit{\boldsymbol{S}}^{-1}}DFT\left\{ \mathit{\boldsymbol{c}} \right\} $ | (3) |
The ultrasonic pulse stream signal, which is obtained from the actual ultrasonic signal by extracting its envelope, can be treated as an FRI signal and can be periodically extended as
| $ x\left( t \right) = \sum\limits_{m \in Z} {\sum\limits_{l = 1}^L {{a_l}h\left( {t-{t_l}-m\tau } \right)} } $ | (4) |
where
If
| $ X\left[k \right] = \frac{1}{\tau }H\left( {\frac{{2\pi k}}{\tau }} \right)\sum\limits_{l = 1}^L {{a_l}{e^{ -\frac{{{\text{j2}}\pi k{t_l}}}{\tau }}}} $ | (5) |
where H(w) is the Fourier transform of h(t),
| $ \mathit{\boldsymbol{X}} = \mathit{\boldsymbol{HV}}\left( \mathit{\boldsymbol{t}} \right)\mathit{\boldsymbol{a}} $ | (6) |
Because the matrix H is reversible, assuming Y=H-1X, then
| $ \mathit{\boldsymbol{Y}} = {\mathit{\boldsymbol{H}}^{-1}}\mathit{\boldsymbol{X}} = \mathit{\boldsymbol{V}}\left( \mathit{\boldsymbol{t}} \right)\mathit{\boldsymbol{a}} $ | (7) |
Because matrix V(t) is a Fant mond matrix, if K≥L is satisfied and the time of arrivals
| $ Y\left[k \right] = \sum\limits_{l = 1}^L {{a_l}{{\text{e}}^{ -\frac{{{\text{j}}2\pi k{t_l}}}{\tau }}}} $ | (8) |
In conclusion, when the discrete Fourier vector X is obtained from the sparse sampling data c, the vector Y can be obtained from Y=H-1X; the parameters
According to FRI sparse sampling theory, when estimating
Suppose each pulse in an ultrasonic FRI pulse stream signal has a Gaussian envelope h(t), and its discrete Fourier transform is
| $ H\left( {\frac{{2\pi k}}{\tau }} \right) = \sigma $ | (9) |
Accordingly, we can obtain
| $ \mathit{\boldsymbol{Y}} = {\mathit{\boldsymbol{H}}^{-1}}\mathit{\boldsymbol{X}} = \frac{1}{\sigma }\mathit{\boldsymbol{X}} = \frac{1}{\sigma }{\mathit{\boldsymbol{S}}^{-1}}DFT\left\{ \mathit{\boldsymbol{c}} \right\} $ | (10) |
When calculating the discrete Fourier vector X from N sampling data c, we can obtain vector Y directly from
| $ \mathit{\boldsymbol{P}}\left[{k + \left[{\frac{K}{2}} \right]} \right] = \mathit{\boldsymbol{X}}\left[k \right] $ | (11) |
The matrix R can then be expressed as:
| $ \mathit{\boldsymbol{R}} = \left[{\begin{array}{*{20}{c}} {\frac{1}{\sigma }P\left[0 \right]}& \cdots &{\frac{1}{\sigma }P\left[{M-1} \right]} \\ \vdots&\vdots&\vdots \\ {\frac{1}{\sigma }P\left[{F-1} \right]}& \cdots &{\frac{1}{\sigma }P\left[{F + M-2} \right]} \end{array}} \right] $ | (12) |
SVD is then performed on matrix R. Let R=UBV*, where U is a unitary matrix, and V* (the conjugate transpose of V) is a unitary matrix. B is a diagonal matrix with nonnegative real numbers on the diagonal, which can be written as
| $ \mathit{\boldsymbol{B}} = {\text{diag}}\left( {{d_0}, {d_1}, {d_2} \cdots {d_{I-1}}} \right) $ | (13) |
where d0, d1, d2…dI-1 are diagonal entries of diagonal matrix B, corresponding to the singular value, which indicates the spectrum value. If a threshold factor has a signal noise level δ, with the component reserved according to di/dmax≥δ and the small values removed, then the number of the remaining singular values is the pulse number L.
If the value of pulse width σ is changed, the singular value changes proportionally according to
1) Calculate the discrete Fourier coefficients X[k] from the FRI sparse sampling data c.
2) Let matrix P satisfy
3) Construct matrix R as
| $ \mathit{\boldsymbol{R}} = \left[{\begin{array}{*{20}{c}} {P\left[0 \right]}& \cdots &{P\left[{M-1} \right]} \\ \vdots&\vdots&\vdots \\ {P\left[{F-1} \right]}& \cdots &{P\left[{F + M-2} \right]} \end{array}} \right] $ |
4) Perform SVD on matrix R:R=UBV*.
5) Calculate the singular value of the diagonal matrix B, as well as the ratios with maximum singular value, and count the number with di/dmax≥δ in diagonal matrix B to obtain the pulse number L.
4 Determination of the Noise Level Threshold FactorBecause the sparse sampling interval is considerably larger than the Nyquist sampling interval, the time domain waveform plotted by sparse sampling data differs vastly from the actual waveform. Hence, we are unable to use the threshold method to count the pulse number from sparse sampling data directly. Therefore, the SVD method is introduced to obtain the decomposition coefficient from the discrete spectrum coefficients. The decomposition coefficients reserve the pulse peak information; hence, the pulse peak value can be distinguished from noise by using the noise level threshold factor δ.
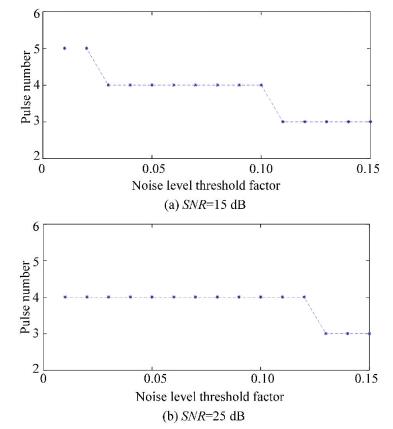
To evaluate the influence of δ on the pulse number L, we implemented simulation experiments with different pulse numbers and different signal-to-noise ratios (SNRs) on simulated ultrasonic signals. An ultrasonic simulation signal with the pulse number L=4 provides an example. Its parameters were set as follows: the time of arrival vector was tl4=[0.2, 0.4, 0.6, 0.8], amplitude vector was al4=[0.1, 0.3, 0.5, 0.7], pulse width was σ=1×10⁻³s, and its time duration was normalized as τ=1. Gaussian white noise was added to the simulation signal. The sampling kernel was selected as the sum of sincs (SoS), and the sampling number N=K=2L×oversampling rate+1=2×4×2+1=17. The sparse sampling data c was obtained; the discrete Fourier coefficient vector X was then calculated, the Hankel matrix R was constructed, and SVD was performed. We then selected δ, changing from 0.01 to 0.15 with a step of 0.01. Statistical results averaged by 100 times are shown in Fig. 3.
|
Figure 3 Estimated pulse number versus noise level threshold factor with different SNRs |
Fig. 3(a) and (b) show the estimates for a pulse number with SNR=15 dB and 25 dB, respectively. The simulation results indicate that a suitable range of δ can obtain an accurate pulse number. If δ is too small or too large than its proper value may lead to incorrect estimates. This is because a smaller δ treats the noise as a useful signal, which leads to a larger estimated pulse number; a larger δ treats a useful signal as noise, which leads to a smaller estimated pulse number. Analyzing the simulation results with various SNRs, we found that by choosing a δ near to 1/SNR, an accurate pulse number can be obtained.
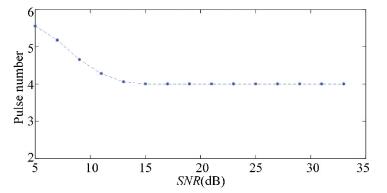
Fig. 4 shows the pulse number estimating results averaged 100 times under different SNRs with δ=0.06. Gaussian white noise from 5 dB to 33 dB, and a step of 2 dB was added to the ultrasonic simulation signal. Fig. 3 shows that when SNR≥13 dB, an accurate pulse number can be obtained.
|
Figure 4 Estimation results of pulse number versus SNRs (δ=0.06) |
The simulation results indicate that selecting a proper δ according to the actual signal SNR can facilitate obtaining an accurate pulse number.
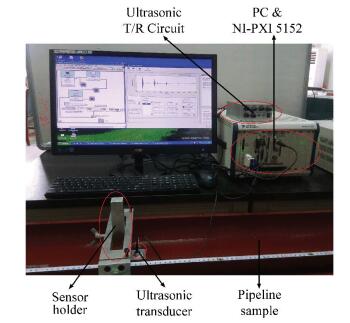
5 Application to Pipeline Ultrasonic Testing and Result AnalysisTo verify the effectiveness of the proposed method in the actual testing, we performed ultrasonic flaw testing on a pipeline sample. The established experimental platform is shown in Fig. 5. The testing system includes a pipeline sample, ultrasonic transducer, ultrasonic T/R circuit, NI-PXI5152, Labview software, and PC. The pipeline sample is a seamless steel tube with an outer diameter of 219 mm and a wall thickness of 14 mm. An artificial defect was created in the sample. The FRI sparse sampling data were obtained by software from the traditional Nyquist sampling data.
|
Figure 5 Pipeline ultrasonic testing system |
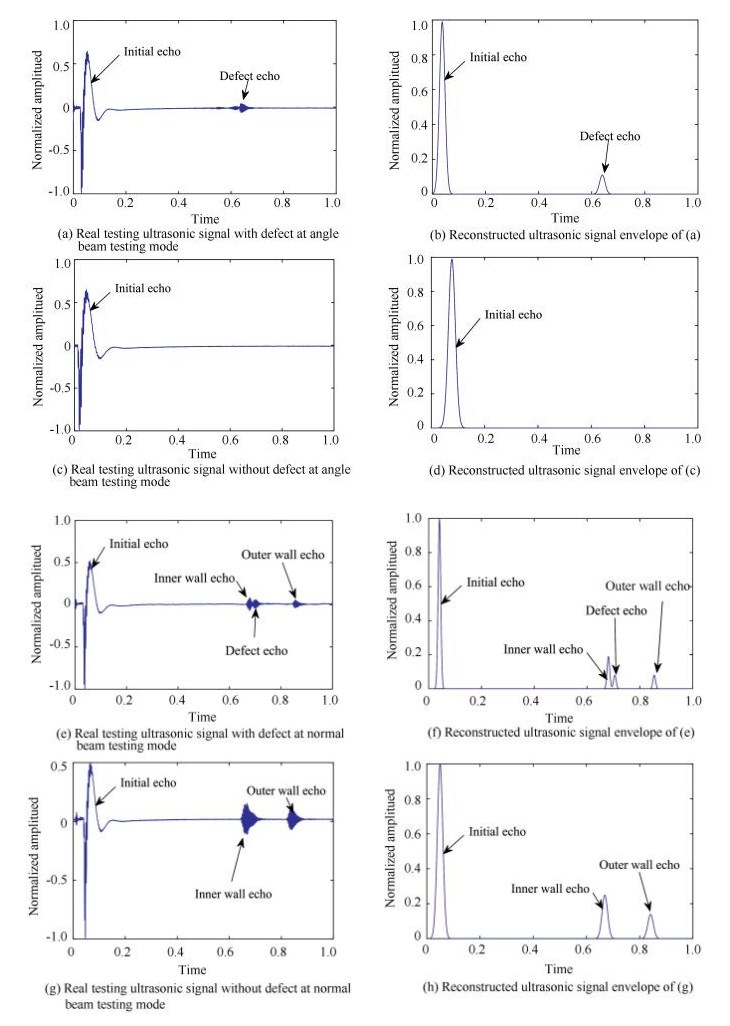
The real testing ultrasonic signals with and without defect at angle beam testing mode are shown in Fig. 6(a) and (c), respectively, and the real testing ultrasonic signals with and without defect at normal beam testing mode are shown in Fig. 6(e) and (g), respectively. We transformed the real testing signals to an FRI pulse stream signals using a quadrature demodulation algorithm. FRI sparse sampling was then implemented by using an SoSsampling kernel. Seventeen samples were performed. The noise level threshold factors were all selected as 0.06 according to the actual SNR. The estimated pulse numbers were 2, 1, 4 and 3, respectively, identical to the real pulse numbers. The reconstructed ultrasonic FRI pulse stream signals are shown in Fig. 6(b), (d), (f) and (h) respectively, corresponding to the real testing signals of (a), (c), (e) and (g).We also performed experiments on different pulse number situations on the pipeline sample. All the pulse numbers were accurately estimated.
|
Figure 6 Real testing signals and reconstructed signals |
6 Conclusions
A pulse number estimation method that uses ultrasonic FRI sparse sampling data is proposed. The method can solve the problem of prior knowledge of the pulse number when reconstructing the FRI signal by using sparse sampling data. Moreover, it avoids using a pre-establishing pulse width in the signal parameter estimation process. This method first transforms the sparse sampling data to discrete Fourier coefficients, then constructs a Hankel matrix on which it performs SVD. Finally, the pulse number can be obtained with the help of the noise level threshold factor. Results from simulation and experimental testing indicate that an accurate pulse number can be estimated. The technique provides an automated and convenient method for obtaining prior information for ultrasonic signal reconstruction from sparse sampling data.
| [1] |
Unser. Sampling-50 years after Shannon. Proceedings of the IEEE, 2000, 88(4): 569-587. DOI:10.1109/5.843002 (  0) 0) |
| [2] |
Vetterli M, Marziliano P, Blu T. Sampling signals with finite rate of innovation. IEEE Transactions on Signal Processing, 2002, 50(6): 1417-1428. DOI:10.1109/TSP.2002.1003065 (  0) 0) |
| [3] |
Blu T, Dragotti P L, Vetterli M, et al. Sparse sampling of signal innovations. IEEE Signal Processing Magazine, 2008, 25(2): 31-40. DOI:10.1109/MSP.2007.914998 (  0) 0) |
| [4] |
Gurbuz A C, Mcclellan J H, Scott W R. A compressive sensing data acquisition and imaging method for stepped frequency GPRs. IEEE Transactions on Signal Processing, 2009, 57(7): 2640-2650. DOI:10.1109/TSP.2009.2016270 (  0) 0) |
| [5] |
Tur R, Eldar Y C, Friedman Z. Innovation rate sampling of pulse streams with application to ultrasound imaging. IEEE Trans. on Signal Process, 2011, 59(4): 1827-1842. DOI:10.1109/TSP.2011.2105480 (  0) 0) |
| [6] |
Gedalyahu K, Tur R, Eldar Y C. Multichannel sampling of pulse streams at the rate of innovation. IEEE Transactions on Signal Processing, 2011, 59(4): 1491-1504. DOI:10.1109/TSP.2011.2105481 (  0) 0) |
| [7] |
Peng Chengqing. Research on Pipeline Ultrasonic Testing Signal Sampling Method and Application Based on Finite Rate of Innovation. Zhenjiang: Jiangsu University, 2015.
(  0) 0) |
| [8] |
Roy R, Kailath T. ESPRIT-estimation of signal parameters via rotational invariance techniques. IEEE Transactions on Acoustics Speech & Signal Processing, 1989, 37(7): 984-995. DOI:10.1109/29.32276 (  0) 0) |
| [9] |
Fidan M S. Multiple Signal Classification Method in Direction of Arrival Estimation. Turkey: Hacettepe University, 2007.
(  0) 0) |
| [10] |
Erdozain A, Crespo P M. A new stochastic algorithm inspired on genetic algorithms to estimate signals with finite rate of innovation from noisy samples. Signal Processing, 2010, 90(1): 134-144. DOI:10.1016/j.sigpro.2009.05.022 (  0) 0) |
| [11] |
Tan V Y F, Goyal V K. Estimating signals with finite rate of innovation from noisy samples: A stochastic algorithm. IEEE Transactions on Signal Processing, 2008, 56(10): 5135-5146. DOI:10.1109/TSP.2008.928510 (  0) 0) |
| [12] |
Rezaiesarlak R, Manteghi M. On the application of short-time matrix pencil method for wideband scattering from resonant structures. IEEE Transactions on Antennas & Propagation, 2015, 63(1): 328-335. DOI:10.1109/TAP.2014.2365823 (  0) 0) |
| [13] |
Kheawprae F, Boonpoonga A, Sangchai W. Measurement for radar target identification using short-time matrix pencil method. 2015 IEEE Conference on Antenna Measurements & Applications(CAMA), 2015, 1-4. DOI:10.1109/CAMA.2015.7428184 (  0) 0) |
| [14] |
Aharon M, Elad M, Bruckstein A. SVD: An algorithm for designing over-complete dictionaries for sparse representation. IEEE Transactions on Signal Processing, 2006, 54(11): 4311-4322. DOI:10.1109/TSP.2006.881199 (  0) 0) |
| [15] |
Shi Guangming, Chen Chongyu, Lin Jie, et al. Narrowband ultrasonic detection with high range resolution: Separating echoes via compressed sensing and singular value decomposition. IEEE Transactions on Ultrasonics, Ferroelectrics, and Frequency Control, 2012, 59(10): 2237-2253. DOI:10.1109/TUFFC.2012.2449 (  0) 0) |
 2018, Vol. 25


