Thermosetting materials, whose viscosity are highly related to the temperature and duration time, are widely used in many industrial applications such as electronic packaging, building industry[1-7], etc. For instance, silicone produced by Dow Corning (OE-6550A/B) is one of the most widely-used thermosetting material in the electronic packaging industry such as the light-emitting diode (LED) packaging[4]. In the LED packaging, the silicone is used as the encapsulation as well as the matrix to disperse the phosphor particle in the phosphor coating process[8-9]. The encapsulation is very important for the mechanical protection and light extraction, and the phosphor coating is very important for the light conversion as well as the light extraction[10-11]. Therefore, the spreading and curing behaviors of the silicone is of great importance to the LED packaging. In some proposed technologies, the silicone droplets are dispensed onto a heated surface to control its spreading behaviors by utilizing its thermosetting properties[4, 12-13]. However, most of the works are based on experiments, which fails to explore the fluid flow mechanism behind the spreading and curing process such as the viscosity-temperature, time dependence and temperature, and viscosity distributions. To solve these issues, numerical method is urgently needed. There are some numerical models based on the volume of fluid (VOF) method[14-17], overall energy balance (OEB) method[18], and lattice Boltzmann method (LBM)[19-20] for exploring the fluid behaviors on the solid surface. Among these methods, the VOF method is more widely applied to reveal the spreading behaviors of millimeter size droplet due to its simplicity.
However, to establish the numerical model for the thermosetting droplet, it is necessary to build a viscosity prediction model for the thermosetting material by considering the temperature and duration time. Kiuna et al. proposed a model for resin viscosity during curing process[21]. However, to combine the viscosity model with the proposed fluid flow models, more issues should be solved. In some previous studies, researchers applied the User Defined Function (UDF) method to characterize the material with variable physical properties[22-23], which provides an optional solution for combining the viscosity model with the fluid flow models.
In this study, we experimentally and numerically investigated the spreading and curing behaviors of the silicone (OE-6550A/B) droplet on a heated surface with temperature ranging from 25 ℃ to 250 ℃. The thermosetting property of silicone was characterized and a viscosity model was built to predict the viscosity of silicone under various temperatures and duration time. Then, a numerical model was established by combining the VOF and UDF methods to explore the fluid flow mechanism behind the spreading and curing process.
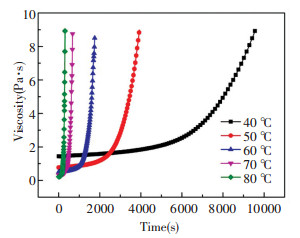
2 Viscosity ModelOE-6550A/B silicone is widely used as the encapsulation and matrix to disperse the phosphor powders in the LED packaging. As a thermosetting material, its viscosity changes with temperature and duration time, which would affect its wetting and spreading behaviors significantly. Therefore, it is very important to obtain the viscosity evolution of silicone under various temperatures and duration time. In the LED packaging, it always heats the silicone to over 100 ℃ to cure it quickly. However, it is impossible to measure the viscosity evolution of silicone under temperature higher than 100 ℃ with the rheometer since it takes more than 90 s to heat the silicone to over 100 ℃, during which the viscosity of silicone changes significantly and causes immeasurable test error. Therefore, it is highly necessary to establish a viscosity model for predicting the viscosity evolution of silicone under temperature higher than 100 ℃. For this goal, we measured the viscosity evolution of silicone by the rheometer (MCR302) under temperature ranging from 40 ℃ to 80 ℃ and the results are displayed in Fig. 1. The tested silicone sample was made by mixing the A/B components with mass ratio of 1:1. It can be seen the viscosity of silicone increased greatly under a fixed temperature as the time went by, and the viscosity increasing rate increased with the temperature significantly.
|
Fig.1 Time evolution of silicone viscosity under various temperatures |
Based on the experimental data, we established a viscosity model for the silicone based on the Kiuna's model[21] and it is expressed as
| $ \begin{aligned} \eta(T, t)=& 2.16276 \times 10^{-8} \times \exp (5666.96612 / T-\\ &\left.0.37898 f(T, t)+1.18644(f(T, t))^{2}\right) \end{aligned} $ | (1) |
where
| $ \begin{aligned} f(T, t)=& 2.50038 \times 10^{10} \times \\ & \exp (-10236.17615 / T) \times t \end{aligned} $ | (2) |
where T is temperature, and t is duration time.
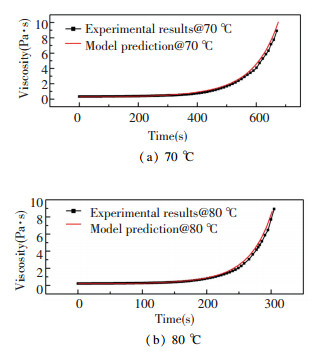
Fig. 2 shows the comparison of the viscosity evolution under temperature of 70 ℃ and 80 ℃ obtained from the experiments and the model prediction, which shows that the model can predict the viscosity well.
|
Fig.2 Time evolution of viscosity at different substrate temperatures |
3 Numerical Methodology 3.1 Governing Equations
VOF is widely used in modeling the free-surface flows, in which the interface between the immiscible fluids is modeled as the discontinuity in characteristic function (such as volume fraction). The mass and momentum conservation equations for each phases are given by
| $ \nabla \cdot \overrightarrow{\boldsymbol{v}}=0 $ | (3) |
| $ \begin{array}{l} \frac{\partial }{{\partial t}}(\rho \mathit{\boldsymbol{\vec v}}) + \nabla \cdot (\rho \mathit{\boldsymbol{\vec v\vec v}}) = - \nabla p + \nabla \cdot [\mu (\nabla \mathit{\boldsymbol{\vec v}} + \\ \;\;\;\;\;\;\;\;\;\;\;\;\;\;\;\;\;\;\;\;\;\;\;\;\;\;\;\;\;\;\;\;\;\;\;\nabla {{\mathit{\boldsymbol{\vec v}}}^{\rm{T}}})] + \rho \mathit{\boldsymbol{\vec g}} + {{\mathit{\boldsymbol{\vec F}}}_{{\rm{SF}}}} \end{array} $ | (4) |
where
The density and viscosity of each computational cell are calculated as
| $ \rho = \mathit{\Sigma }{\alpha _k}{\rho _k} $ | (5) |
| $ \mu=\Sigma \alpha_{k} \mu_{k} $ | (6) |
where αk is the volume fraction of the kth fluid. For a particular computational cell:αk=0 means the cell has no kth fluid; αk=1 means the cell is full of kth fluid; 0 < αk < 1 means the cell contains kth fluid and other fluids.
For the air and liquid system, the surface tension can be calculated as[24]
| $ {\overrightarrow {\mathit{\boldsymbol{F}}} _{{\rm{SF}}}} = {\gamma _{lv}}\kappa \overrightarrow {\mathit{\boldsymbol{n}}} \left[ {\frac{{2\left( {{\rho _l}{\alpha _l} + {\rho _v}{\alpha _v}} \right)}}{{\left( {{\rho _l} + {\rho _v}} \right)}}} \right] $ | (7) |
where γlv represents the surface tension of the liquid, ρl and ρv represent the density of the liquid and air, κ is the interface curvature and
The interface between each fluids was tracked by solving the continuity equation of the volume fraction:
| $ \frac{{\partial {\alpha _k}}}{{\partial t}} + \nabla {\alpha _k}{\mathit{\boldsymbol{\vec v}}_k} = 0 $ | (8) |
The spreading of the silicone droplet on a heated surface is very complex. It involves spreading behaviors of viscous fluid, the heating process of the silicone, and the viscosity evolution of the silicone. However, the heating process and the silicone viscosity evolution are hard to observe and analyze from experiments. Therefore, to further investigate the spreading behaviors of silicone droplet on heated substrate, numerical simulation based on the combination of VOF model and UDF method was applied. The VOF model was used to simulate the geometry evolution of the silicone droplet, and the UDF was used to define the silicone viscosity evolution.
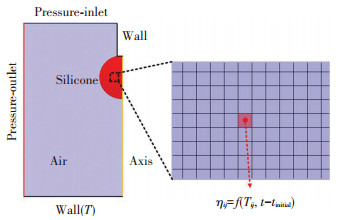
Fig. 3 shows the simplified two-dimensional numerical model. The two-dimensional model was validated to be adequate to capture the geometry evolution of the three-dimensional spreading process[25-27]. It consists of air, silicone, wall, pressure inlet, and pressure outlet. The pressures of the outlet and inlet were set as the atmosphere pressure. The heated wall was set as constant wall temperatures boundary condition. The diameters of the needle was set as 0.7 mm and the height from the needle apex to the substrate was set as 10 mm. The silicone droplet was set as a sphere with a diameter of 2.24 mm that hung on the needle initially, then it separated from the needle driven by the gravity and the diameter of the separated part was about 2.2 mm which was consistent with the experiments. The air and silicone were considered as incompressible, laminar, and Newtonian fluids, and their initial temperatures were set as 25 ℃. To simplify the numerical model, the thermal and fluid properties of the silicone were set as constant and listed in Table 1[28-29].
|
Fig.3 Numerical model |
| Table 1 Thermal and fluid properties of silicone |
To define the time and temperature evolution of viscosity, the UDF method was used. As shown in Fig. 3, the UDF monitored the cell temperature Tij and the time t after each calculation step, then the viscosity of the cell was calculated with our proposed viscosity model, finally the calculated viscosity was returned to the cell for the next calculation step. To ensure the convergence of the model, the maximum of the silicone was confined to be 100 Pa·s.
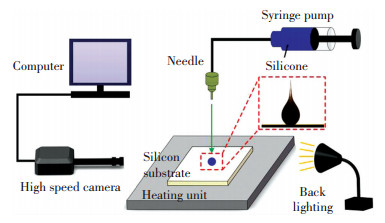
4 ExperimentsExperiments were conducted to verify the accuracy of the numerical model. Fig. 4 schematically shows the experimental setup. It consists of high-speed camera, syringe pump, heating unit, computer, and back-lighting. A well-polished flat silicon substrate with average roughness of ≈ 5 nm was used and the contact angle of silicone on the substrate was measured as 15°± 1° at 25 ℃. The silicone used in the experiments was OE-6550A/B with A/B components mass ratio of 1:1 and its surface tension was measured as 0.031 N/m at 25 ℃. Before experiments, the substrate was carefully cleaned. Firstly, it was ultrasonically cleaned in acetone solution for 15 min, then it was washed in ethanol solution for 3 times, finally it was washed by deionized water for 3 times and dried in a 50 ℃ oven for 30 minutes. A heating unit with temperature control precision of ±1 ℃ was applied to heat the silicon substrate. Silicone droplets with diameter of 2.2 mm ± 5% were generated by pushing the silicone from the syringe pump at a small rate (≈ 1 μL/s) into a capillary needle (inner diameter of 0.46 mm, external diameter of 0.7 mm) at a height of 10 mm. The high-speed camera (SA3 120K) with resolution of 1024 ×1024 was used to record the side-view of the droplets.
|
Fig.4 Schematic of experimental setup |
In the experiments, the silicon substrate was heated to a pre-defined temperature, then the silicone droplet was dropped onto the heated substrate. Once the silicone contacted the surface, we turned on the high-speed camera and recorded the spreading process at a frame rate of 4000 fps. The recorded images were sent to a computer to further analyze the time evolution of the dynamic contact radius and spreading velocity.
5 Results and DiscussionFig. 5(a) shows the time evolution of contact radius R(t) and spreading velocity dR(t)/dt of the silicone droplet at 25 ℃. It indicates that the spreading at the initial spreading stage was very fast and then become extreme after 10 s. A log-log plot of the R(t)~t curve is shown in Fig. 5(b). The power exponents of R(t)~tα for the gravitational regime and capillary regime were calculated as ~0.22 and ~0.106, respectively. The power exponent of the gravitational regime was much different from the reported articles due to the difference of impact conditions and droplet properties[30]. For the spreading behavior characterization, the final contact radius Rf and total spreading time tf are very important. In our experiments, we defined the contact radius and spreading time at spreading velocity smaller than 1×10⁻⁴ mm/s as the Rf and tf. It can be seen that the Rf and tf were ~2.95 mm and ~511 s, respectively.

|
Fig.5 Spreading process of the silicone droplet at 25 ℃ |
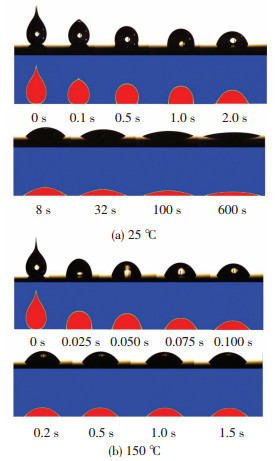
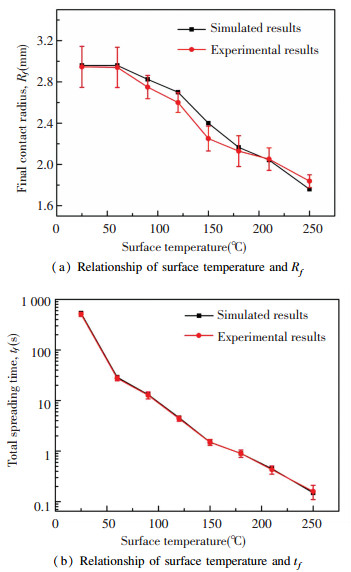
Fig. 6 shows comparison of the experimental and numerical results of silicone droplet spreading process at 25 ℃ and 150 ℃. It shows that the numerical model can well predict the droplet morphology evolution. Besides, it can be seen that the spreading at 150 ℃ was faster than that of 25 ℃ and the final contact radius of 150 ℃ was smaller than that of 25 ℃, which was caused by the viscosity evolution under high surface temperature. To quantitatively analyze the effect of the surface temperature on the spreading and curing behaviors of silicone droplets, we measured the Rf and tf with surface temperature ranging from 25 ℃ to 250 ℃ by both experiments and simulations and the results are shown in Fig. 7.
|
Fig.6 Comparison of the experimental and numerical results of silicone droplet spreading process at different surface temperatures |
|
Fig.7 Comparison of the experimental and numerical results |
It shows that the surface temperature significantly decreased the Rf and tf. For surface temperature varied from 25 ℃ to 250 ℃, the Rf changed from ~2.95 mm to ~1.78 mm and the tf changed from ~511 s to ~0.15 s. Moreover, the maximum deviation of Rf was found to be 6.7% and the maximum deviation of tf was found to be 5.1%.
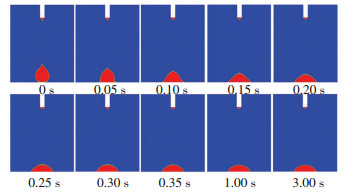
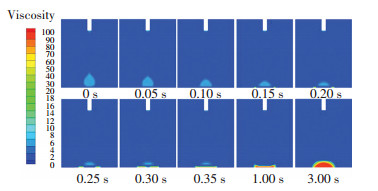
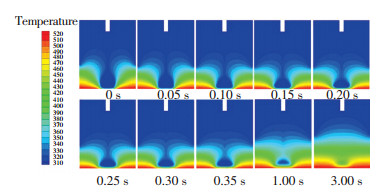
To further explore the mechanism behind the dependence of surface temperature and Rf and tf, we analyzed the spreading process, viscosity distribution, and temperature distribution of the silicone droplet under surface temperature of 250 ℃ and the results are displayed in Figs. 8-10. Fig. 8 shows the spreading process of the silicone droplet. Fig. 9 shows the viscosity distribution of silicone droplet at different times. It shows that once the surface droplet contacted the surface, the viscosity of silicone adjacent to the surface changed greatly as time went by. Moreover, the viscosity of the precursor film increased significantly after 0.1 s and reached 100 Pa·s after 0.15 s, which prevented the silicone from wetting the surface and contributed to the reduction of Rf. Fig. 10 shows the temperature distribution of silicone droplet at different times. It indicates that due to the low thermal conductivity of silicone (0.16 W/(m·K)), the silicone adjacent to the surface was heated to a high temperature while the silicone away from the surface was not. As a result, the viscosity of the silicone adjacent to the surface changed significantly while the viscosity of silicone away from the surface changed slightly as shown Fig. 9.
|
Fig.8 Spreading process of the silicone droplet under surface temperature of 250 ℃ |
|
Fig.9 Viscosity distribution of the silicone droplet at different times under surface temperature of 250 ℃ |
|
Fig.10 Temperature distribution of the silicone droplet at different times under surface temperature of 250 ℃ |
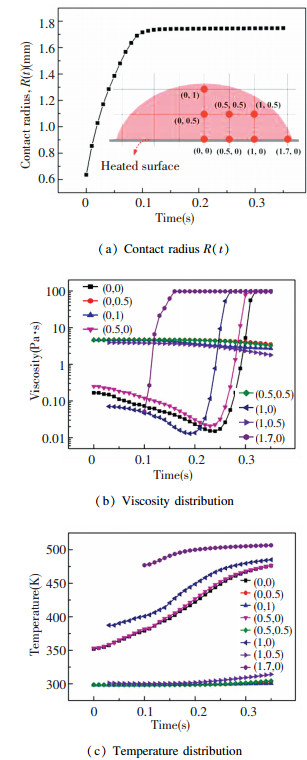
To quantitatively characterize the effect of the surface temperature on the spreading process, viscosity distribution, and temperature distribution of silicone droplets, we measured the time evolution of contact radius as well as the viscosity and temperature of 8 points and the results are shown in Fig. 11. The detailed positions of the 8 points are shown in the inset figure of Fig. 11(a). The results are consistent with Figs. 8-10. Fig. 11(b) shows the time evolution of viscosity for each points. It indicates that the viscosity of the four points adjacent to the surface changed significantly as time went by, while the viscosity of the four points away from the surface changed slightly. Besides, the viscosity of point close to the precursor film was higher than that away from the precursor film. Fig. 11(c) shows the time evolution of temperature for each points. It shows that the temperature of the four points adjacent to the surface increased significantly as time increased, while the temperature of the four points away from the surface increased slightly, which is consistent with the viscosity evolution shown in Fig. 11(b).
|
Fig.11 Spreading and curing behavior of silicone droplet at surface temperature of 250 ℃ |
6 Conclusions
In this study, we experimentally and numerically investigated the spreading and curing behaviors of thermosetting droplets-silicone OE-6550A/B on a heated silicon surface with temperature ranging from 25 ℃ to 250 ℃. A viscosity model was built to predict the silicone viscosity evolution under different temperatures and duration time. A numerical model based on the combination of VOF method and UDF method was built to explore the spreading process, viscosity, and temperature distribution of silicone droplet under various surface temperatures. The results show that due to the low thermal conductivity of silicone, the temperature of silicone adjacent to the surface increased sharply while the temperature of the silicone away from the surface increased slightly as time went by. As a result, the viscosity of silicone adjacent to the surface decreased initially and increased significantly as time further went by, while the viscosity of silicone away from the surface changed slightly, which contributed to the reduction of the final contact radius and total spreading time.
| [1] |
Bobade S K, Paluvai N R, Mohanty S, et al. Bio-based thermosetting resins for future generation: A review. Polymer-Plastic Technology and Engineering, 2016, 55(17): 1863-1896. DOI:10.1080/03602559.2016.1185624 (  0) 0) |
| [2] |
Raquez J M, Deléglise M, Lacrampe M F, et al. Thermosetting (bio) materials derived from renewable resources: A critical review. Progress Polymer Science, 2010, 35(4): 487-509. DOI:10.1016/j.progpolymsci.2010.01.001 (  0) 0) |
| [3] |
Shang B F, Ma Y P, Hu R, et al. Passive thermal management system for downhole electronics in harsh thermal environments. Applied Thermal Engineering, 2017, 118: 593-599. DOI:10.1016/j.applthermaleng.2017.01.118 (  0) 0) |
| [4] |
Luo X B, Hu R, Liu S, et al. Heat and fluid flow in high-power LED packaging and applications. Progress in Energy Combustion Science, 2016, 56: 1-32. DOI:10.1016/j.pecs.2016.05.003 (  0) 0) |
| [5] |
Yang H, Lee L J. Effects of resin chemistry on redox polymerization of unsaturated polyester resins. Journal of Applied Polymer Science, 2002, 84(1): 211-227. DOI:10.1002/app.10317 (  0) 0) |
| [6] |
Zhang Y H, Rhee K Y, Park S J. Nanodiamond nanocluster-decorated graphene oxide/epoxy nanocomposites with enhanced mechanical behavior and thermal stability. Composites Part B: Engineering, 2017, 114: 111-120. DOI:10.1016/j.compositesb.2017.01.051 (  0) 0) |
| [7] |
Zhang Y H, Choi J R, Park S J. Thermal conductivity and thermo-physical properties of nanodiamond-attached exfoliated hexagonal boron nitride/epoxy nanocomposites for microelectronics. Composites Part A: Applied Science and Manufacturing, 2017, 101: 227-236. DOI:10.1016/j.compositesa.2017.06.019 (  0) 0) |
| [8] |
Yu X J, Shu W C, Hu R, et al. Dynamic phosphor sedimentation effect on the optical performance of white LEDs. IEEE Photonics Technology Letters, 2017, 29(14): 1195-1198. DOI:10.1109/LPT.2017.2712280 (  0) 0) |
| [9] |
Cheng T, Yu X J, Ma Y P, et al. Angular color uniformity enhancement of white LEDs by lens wetting phosphor coating. IEEE Photonics Technology Letters, 2016, 28(14): 1589-1592. DOI:10.1109/LPT.2016.2554631 (  0) 0) |
| [10] |
Yu X J, Xie B, Shang B, et al. A facile approach to fabricate patterned surfaces for enhancing light efficiency of COB-LEDs. IEEE Transactions Electron Devices, 2017, 64(10): 4149-4155. DOI:10.1109/TED.2017.2734105 (  0) 0) |
| [11] |
Ma Y P, Lan W, Xie B, et al. An optical-thermal model for laser-excited remote phosphor with thermal quenching. Internaltional Journal of Heat and Mass Transfer, 2018, 116: 694-702. DOI:10.1016/j.ijheatmasstransfer.2017.09.066 (  0) 0) |
| [12] |
Yu X J, Xie B, Shang B F, et al. A cylindrical tuber encapsulant geometry for enhancing optical performance of chip-on-board packaging light-emitting diodes. IEEE Photonics Journal, 2016, 8(3): 1-9. DOI:10.1109/JPHOT.2016.2555619 (  0) 0) |
| [13] |
Yu X J, Xie B, Chen Q, et al. Thermal remote phosphor coating for phosphor-converted white-light-emitting diodes. IEEE Transactions on Components, Packaging and Manufacturing Technology, 2015, 5(9): 1253-1257. DOI:10.1109/TCPMT.2015.2453397 (  0) 0) |
| [14] |
Hirt C W, Nichols B D. Volume of fluid (VOF) method for the dynamics of free boundaries. Journal of Computional Physics, 1981, 39(1): 201-225. DOI:10.1016/0021-9991(81)90145-5 (  0) 0) |
| [15] |
Gunjal P R, Ranade V V, Chaudhari R V. Dynamics of drop impact on solid surface: Experiments and VOF simulations. AIChE Journal, 2005, 51(1): 59-78. DOI:10.1002/aic.10300 (  0) 0) |
| [16] |
Zhang X G. Dynamics of drop formation in viscous flows. Chemical Engineering Science, 1999, 54(12): 1759-1774. DOI:10.1016/S0009-2509(99)00027-5 (  0) 0) |
| [17] |
Strotos G, Gavaises M, Theodorakakos A, et al. Numerical investigation of the cooling effectiveness of a droplet impinging on a heated surface. International Journal of Heat and Mass Transfer, 2008, 51(19-20): 4728-4742. DOI:10.1016/j.ijheatmasstransfer.2008.02.036 (  0) 0) |
| [18] |
Gu Y A, Li D Q. A model for a liquid drop spreading on a solid surface. Colloids Surfaces A: Physicochemical and Engineering Aspects, 1998, 142(2-3): 243-256. DOI:10.1016/S0927-7757(98)00358-6 (  0) 0) |
| [19] |
Li Q, Kang Q J, Francois M M, et al. Lattice Boltzmann modeling of self-propelled Leidenfrost droplets on ratchet surfaces. Soft Matter, 2016, 12(1): 302-312. DOI:10.1039/C5SM01353D (  0) 0) |
| [20] |
Shen S Q, Bi F F, Guo Y L. Simulation of droplets impact on curved surfaces with lattice Boltzmann method. International Journal of Heat and Mass Transfer, 2012, 55(23-24): 6938-6943. DOI:10.1016/j.ijheatmasstransfer.2012.07.007 (  0) 0) |
| [21] |
Kiuna N, Lawrence C J, Fontana Q P V, et al. A model for resin viscosity during cure in the resin transfer moulding process. Composites Part A: Applied Science Manufacturing, 2002, 33(11): 1497-1503. DOI:10.1016/S1359-835X(02)00177-X (  0) 0) |
| [22] |
Li S X, Hou Y Z, Li L C. Dynamic characteristics of swing check valve based on dynamic mesh and UDF. Applied Mechanics and Materials, 2013, 321. DOI:10.4028/www.scientific.net/AMM.321-324.86 (  0) 0) |
| [23] |
Maleki N, Haghighi B, Safavi A. Evaluation of formation constants, molar absorptivities of metal complexes, and protonation constants of acids by nonlinear curve fitting using Microsoft Excel Solver and user-defined function. Microchemical Journal, 1999, 62(2): 229-236. DOI:10.1006/mchj.1998.1665 (  0) 0) |
| [24] |
Wang X, Sun D L, Wang X D, et al. Dynamics of droplets impacting hydrophilic surfaces decorated with a hydrophobic strip. International Journal of Heat and Mass Transfer, 2019, 135: 235-246. DOI:10.1016/j.ijheatmasstransfer.2019.01.135 (  0) 0) |
| [25] |
Gopala V R, van Wachem B G M. Volume of fluid methods for immiscible-fluid and free-surface flows. Chemical Engineering Journal, 2008, 141(1-3): 204-221. DOI:10.1016/j.cej.2007.12.035 (  0) 0) |
| [26] |
Shang B F, Yu X J, Zheng H, et al. Numerical and experimental study on the transferred volume in phosphor dip-transfer coating process of light-emitting diodes packaging. Journal of Electronic Packaging, 2016, 138(2): 021003. DOI:10.1115/1.4033165 (  0) 0) |
| [27] |
Yu X J, Shang B F, Xie B, et al. Spreading behaviors of silicone droplet impact on flat solid surface: Experiments and VOF simulations. 2015 16th International Conference on Electronic Packaging Technology (ICEPT), Piscatway: IEEE, 2015. 1058-1061. DOI: 10.1109/ICEPT.2015.7236762.
(  0) 0) |
| [28] |
Yuan C, Luo X B. A unit cell approach to compute thermal conductivity of uncured silicone/phosphor composites. International Journal of Heat and Mass Transfer, 2013, 56(1-2): 206-211. DOI:10.1016/j.ijheatmasstransfer.2012.09.053 (  0) 0) |
| [29] |
Wang Y M, Zheng H, Hu R, et al. Modeling on phosphor sedimentation phenomenon during curing process of high power LED packaging. Journal of Solid State Lighting, 2014, 1(2): 1-9. DOI:10.1186/2196-1107-1-2 (  0) 0) |
| [30] |
Lu G, Wang X D, Duan Y Y. A critical review of dynamic wetting by complex fluids: From Newtonian fluids to non-Newtonian fluids and nano fluids. Advances in Colloid Interface Science, 2016, 236: 43-62. DOI:10.1016/j.cis.2016.07.004 (  0) 0) |
 2019, Vol. 26


