2. R & D Center, AVIC Xi'an Aircraft Industry (Group) Company Ltd. (China), Xi'an 710089, China
The Diamond Joined-Wing configuration UAV has the front wing and the after wing. The after wing wingtip is connected with the tip of the front wing. From the elevation view and the top view, the wing of this configuration is arranged to get a diamond shape, so it is named Diamond Joined-Wing configuration. In this configuration, if the front wing and the after wing are parallel, the configuration is called the flat layout, and if the front wing with anhedral angle and the after wing are with dihedral angle, the configuration is called the positive staggered layout, otherwise known as negative staggered layout. Compared with the traditional configuration, the Diamond Joined-Wing configuration has many advantages such as light weight, small induced drag, high trim lift coefficient, small wet area, with direct lift and direct lateral force control ability, good stability, maneuverability, etc. Specially, it has omnidirectional detection capability when installing radar antenna, which makes this configuration one of the most promising candidates for the future HALE reconnaissance UAV.
In the 1970s, Wolkovitch [1] put forward the concept of the Diamond Joined-Wing configuration and carried out aerodynamic and structural analysis. A large number of wind tunnel tests and theoretical research have been conducted [2-7]. Particularly when the Sensorcraft program was proposed in USA, the study of this configuration came to a new climax[8-13]. For example, Bond and Canfield [3] did the wind tunnel test for this configuration Sensorcraft. The scope and the depth of the Diamond Joined-Wing configuration have also been continuously improved domestically [14-18]. Liu et al.[17] studied the aerodynamic characteristics of a Diamond Joined-Wing Configuration aircraft. By comparing the aerodynamic performance of the front wing and the after wing, the influence of the after wing on the aerodynamic performance of the aircraft was studied. Wang et al.[19] conducted numerical simulation of the pitching moment nonlinear characteristics of this configuration aircraft. Li et al.[20] studied this configuration aircraft's low-speed aerodynamic characteristics by wind tunnel test. These studies provide the basis for the study of the paper.
The UAV studied in this paper is a pre-research based on the Sensorcraft program. In response to the needs of future wars, the Air Force Research Laboratory (AFRL) plans to use the Sensorcraft to replace the existing multiple models of AWACS and reconnaissance aircraft. The Sensorcraft focuses on solving the problems of airborne radar power and radar omnidirectional detection. It is required to fly 30-50 h at altitudes above 20 000 m. Since this configuration UAV has the front wing and the after wing, if the radar antennas are installed in the wings, it can meet the requirements of the radar omnidirectional detection on the basis of the lower aerodynamic cost. Besides, because the wing area can be allocated to the after wing, the wingspan is smaller when provided with the same lift. Since the front wing and after wing are cleverly connected to form a structural support frame similar to the torsion box, which greatly increases the stiffness and reduces the structure weight of the wing, it not only effectively reduces the difficulty of controlling the elastic deformation problem, but also reduces the technical difficulties of manufacturing processes and materials. Due to the large sweep angle of the wings, the shock resistance of high subsonic speed is reduced, and the flight speed can be greatly improved compared to the traditional configuration such as Global Hawk UAV. At the same time, the unique aerodynamic characteristics of this configuration also reduce the possible stall in large angle of attack. Therefore, this configuration is one of the more favored configurations in this program.
The aerodynamic characteristics was analyzed by numerical simulation, and the flow characteristics of the front wing and the after wing and the variation of the layout parameters on aerodynamic characteristics was studied, which provides theoretical basis for the engineering design of the HALE Diamond Joined-Wing configuration UAV.
2 Numerical Simulation Method and Verification ExampleThe Diamond Joined-Wing configuration UAV was numerically simulated by solving the Reynolds averaged Navior-Stokes (RANS) equations based on the k-ω-sst transition model.
The transport equations for the k-ω-sst transition model are as follows:
| $ \left\{\begin{array}{l} {\frac{\partial \rho k}{\partial t}+\frac{\partial}{\partial x_{j}}\left(\rho u_{j} k\right)=\frac{\partial}{\partial x_{j}}\left(\varGamma_{k} \frac{\partial k}{\partial x_{j}}\right)+\tilde{G}_{k}-Y_{k}+S_{k}} \\ {\frac{\partial \rho \omega}{\partial t}+\frac{\partial}{\partial x_{j}}\left(\rho u_{j} \omega\right)=\frac{\partial}{\partial x_{j}}\left(\varGamma_{\omega} \frac{\partial \omega}{\partial x_{j}}\right)+G_{\omega}-Y_{\omega}+} \\ ~~~~~{D_{\omega}+S_{\omega}} \end{array}\right. $ |
The transport equation for the intermittency γ is defined as below:
| $ \frac{\partial(\rho \gamma)}{\partial t}+\frac{\partial\left(\rho U_{j} \gamma\right)}{\partial x_{j}} =P_{\gamma 1}-E_{\gamma 1}+P_{\gamma 2}-E_{\gamma 2}+\\ ~~~~~\frac{\partial}{\partial x_{j}}\left[\left(\mu+\frac{\mu_{t}}{\sigma_{\gamma}}\right) \frac{\partial \gamma}{\partial x_{j}}\right] $ |
The transport equation for the transition momentum thickness Reynolds number
| $ \begin{aligned} \frac{\partial\left(\rho \tilde{R} e_{\theta t}\right)}{\partial t}+\frac{\partial\left(\rho U_{j} \tilde{R} e_{\theta t}\right)}{\partial x_{j}}=P_{\theta t}+ \\ \frac{\partial}{\partial x_{j}}\left[\sigma_{\theta t}\left(\mu+\mu_{t}\right) \frac{\partial \tilde{R} e_{\theta t}}{\partial x_{j}}\right] \end{aligned} $ |
The relevant variables and their meanings in these formulas are defined in Ref. [21].
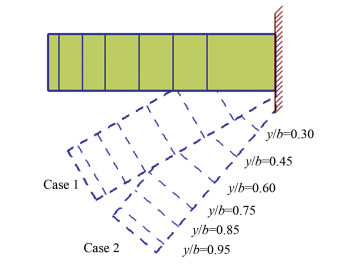
In order to verify the effectiveness of the numerical simulation method, the variable swept AFV-D wing was chosen as the verification example[22]. Two cases were selected (as shown in Fig. 1) as the verification example of the numerical simulation method, where y is the distance between the section and the symmetry plane and b is the span.
|
Fig.1 Schematic of spanwise sectional position of AFV-D wing at different backswept |
The two cases are as follows:
1) Case 1: Λ=30°, Ma=0.7, Re=2.5×10⁶, α=4°;
2) Case 2: Λ=50°, Ma=0.7, Re=2.5×10⁶, α=6°.
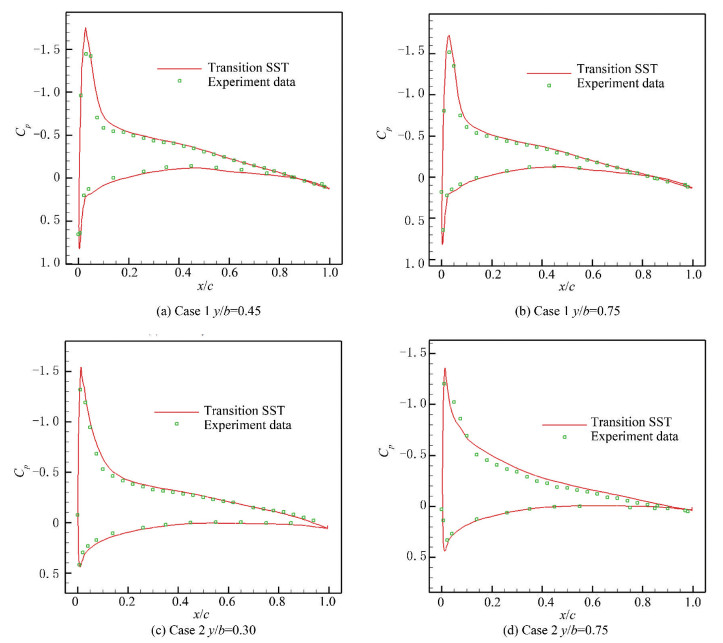
The comparison between the experimental data and the numerical simulation of the section surface pressure distribution at different section of the above cases is shown in Fig. 2.
|
Fig.2 Surface pressure distribution at different section compared with the experimental data |
As shown in Fig. 2 that numerical simulation results are in good agreement with the experimental data. The simulation method can be used in the numerical simulation of the UAV.
3 Configuration and Numerical Simulation GridAccording to the design indexes proposed by pre-research, a variety of typical long endurance UAVs were selected to fit the data, and the takeoff weight and the wing area of the UAV were obtained. On this basis, the initial configuration was designed, which is named Model 1.
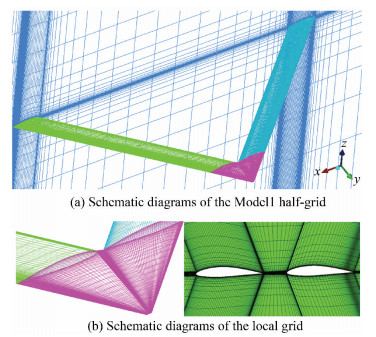
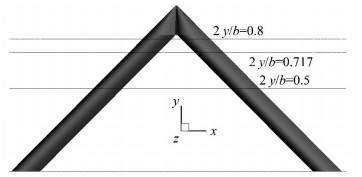
The back-sweep angle of the front wing of Model 1 and the forward-swept angle of the after wing were both 45°. Model 1 used the flat layout with no installation angle; the span was 36.21 m and the chord was 3.168 m. The wings used the NACA64A615 laminar airfoil. Multi-block-structured grid of the initial configuration was generated, and grid number was about 3.24 million. In order to ensure the distance of the first layer grid from wall, let y+≈1; The far field was 60 times larger than the wing chord. The front wing and the after wing of the UAV were divided into structural grids. The topological structures of the Model 1 were H-grid and O-grid. In order to ensure the efficiency and accuracy of numerical simulation, O-grid was generated on the surface of the wing. The Semi-model structure grid diagram is shown in Fig. 3. In the numerical simulation, the Reynolds-averaged Navier-Stokes (RANS) equations were discretized by using the finite volume method. We used time-dependent algorithm, implicit LU-SGS time stepping scheme, and Roe format for spatial discretization. In order to study the aerodynamic characteristics of the UAV, the numerical simulation was performed with the cruising state of flight altitude of 20 000 m and cruise Mach number of 0.6. The Reynolds number was 3.5×10⁶. Some sections were selected to analyze the flow field of the wings. The position of the section was located at 2y/b=0.5, 0.717, 0.8. The spanwise sectional position are shown in Fig. 4.
|
Fig.3 Schematic diagrams of the Model 1 grid |
|
Fig.4 Schematic of spanwise sectional position |
4 Aerodynamic Characteristics Analysis 4.1 Numerical Analysis of Longitudinal Aerodynamic Characteristics 4.1.1 Numerical analysis of the lift characteristics
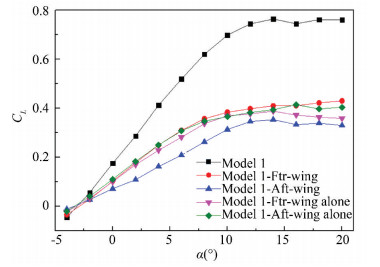
Fig. 5 shows the lift characteristics of the UAV, where the ′Frt-wing′ refers to the front wing and the ′Aft-wing′ refers to the after wing; the ′Frt-wing alone′ refers to the alone front wing, and the ′Aft-wing alone′ refers to the alone after wing. The lift characteristic curve of Model 1 from α=-4° to α=10° is linear, which reaches the maximum at α=14°, and then a platform with larger lift coefficient appears, which has excellent stall characteristics. The lift characteristic curve in Fig. 5 shows that both the front wing and the after wing have good stall performance. The front wing and the after wing have a large sweep angle, which has good stall characteristics, and ultimately leads to improvement of the stall characteristics of this configuration.
|
Fig.5 Lift coefficient |
Difference of the front wing of this configuration and the alone front wing can be seen when the angle of attack is small. The lift characteristics of the front wing and the alone front wing are basically the same, but with the increase of the angle of attack, the lift characteristics of the front wing are significantly greater than that of the alone front wing, which reaches 0.04 at α=8° and increases with the increase of angle of attack. The lift characteristics of the after wing are much smaller than that of the alone after wing, and the difference is about 0.11 at α=8°, which is far greater than that between the front wing and the alone front wing.
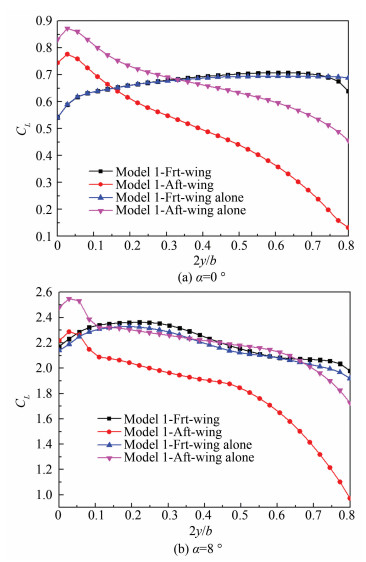
Fig. 6 shows the spanwise lift distribution of the wings at α=0° and α=8°. Fig. 6(a) shows that the lift distribution of the majority spanwise area of the front wing is the same for the alone front wing at α=0°, and the local lift characteristic of the front wing is larger than that of the alone front wing when it is near the front wing and the after wing joint section. Only when it is very close to the front wing and the after wing joint section, the local lift characteristics of the front wing is smaller than that of the alone front wing. Fig. 6(b) shows that the lift distribution of the majority spanwise area of front wing is larger than that of alone front wing at α=8°. There are two main reasons for this phenomenon.
|
Fig.6 Spanwise life distribution (α=0° and α=8°) |
On the one hand, near the front wing and the after wing joint section, the front wing is affected by the retardation of the after wing. The flow velocity of the front wing decreases, and the pressure coefficient of the front wing upper and lower surfaces is increased, which reduces the local lift.
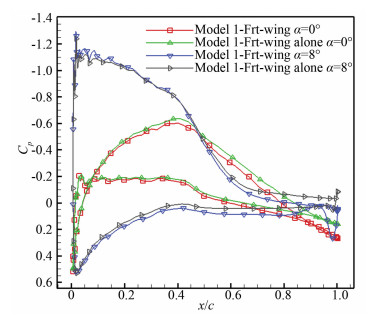
Fig. 7 shows the pressure distribution of the front wing at 2y/b=0.8(Z=14.5 m). From comparison of the pressure distribution of the front wing and alone front wing at α=0°, it can be seen that the pressure coefficient at the trailing of the wing is significantly increased and the area affected by the retardation of the after wing occupies almost 80% of the chordwise area of the front wing. As the angle of attack increases, the influence of the after wing retardation on the upper surface of front wing is reduced, and the influence area is shifted from the area of x/c=0.2 to x/c=0.5. The retardation of the after wing still affects almost all the chordwise area of the front wing's lower surface. On the whole, as the angle of attack increases, the retardation of the after wing on the front wing lift characteristics is decreased.
|
Fig.7 Surface pressure distributions of the front wing (2y/b=0.8) |
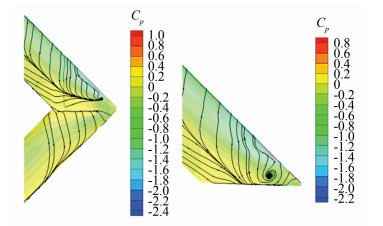
On the other hand, since the front wing is swept wing, as the angle of attack increases, it is first separated in the wing tip. The after wing is forward-swept wing, which has the ability to transmit the front wing's boundary layer to the after wing root so that the after wing can inhibit the front wing flow separation. As shown in Fig. 8, by comparing the flow separation near the front wing wingtip and the alone front wing wingtip, the flow separation of the wingtip and the front wing trailing edge are suppressed, which improves the lift characteristics of the front wing.
|
Fig.8 Wingtip separation of front wing and alone front wing (α=8°) |
When the attack angle is small, as the retardation of the after wing is relatively strong and the front wing flow separation phenomenon is not obvious, inhibition of the after wing to the front wing flow separation has little effect on the lift characteristics of the front wing, so the reduced local lift caused by the retardation and the increased local lift caused by the after wing inhibited by the flow separation of the front wing is offset. So when the angle of attack is small, the change of the front wing lift characteristics is smaller. However, with the increase of the angle of attack, the effect of the retardation is weakened and the ability of the after wing to suppress the separation of the front wing is enhanced, and the front wing lift characteristics are increased.
As shown in Fig. 6, since the after wing is forward-swept, its local lift at the wing root is large and the lift distribution in the direction of the spanwise decreases. Due to the influence of the wake and downwash of the front wing, the after wing lift distribution in the direction of the spanwise is smaller than that of the alone front wing. Under the influence of the configuration characteristics, the farther the distance between the front wing and the after wing, the less the effect of the downwash and wake.
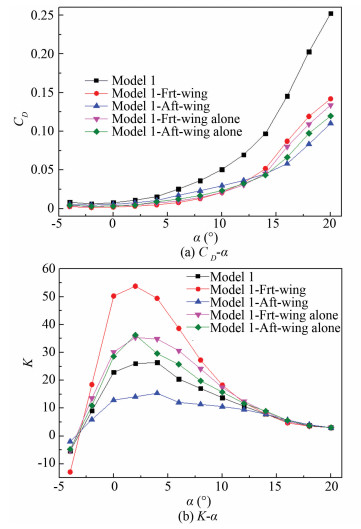
4.1.2 Numerical analysis of the drag characteristics and lift-drag ratio characteristicsFig. 9(a) shows that when the angle of attack is small, the drag coefficient is small and its growth is relatively slow. But when the wings stall, the drag coefficient increases rapidly. Compared with the drag characteristics, the front wing is obviously smaller than that of the after wing, which is obviously smaller than that of the alone front wing, too. The drag characteristics of the after wing are the opposite. The main reason for this phenomenon is that the after wing has an inhibitory effect on the wing tip vortex of the front wing and reduces the induced drag, so that the drag characteristics of the front wing are better than that of the alone front wing.
|
Fig.9 Drag characteristics and lift-drag ratio characteristics |
For the after wing, the flow field structure tends to be complicated due to the interference of the front wing wake and the effect of downwash, so that the after wing drag coefficient is obviously increased. It should be noted that when the angle of attack increases, due to the front wing downwash, the after wing effective angle of attack is significantly smaller than that of the alone after wing, which delays its stall angle of attack. The after wing drag characteristics at high angle of attack conditions is obviously better than that of the alone after wing and the front wing of this configuration.
It can be seen from Fig. 9(b) that the difference between the alone front wing and the alone after wing maximum lift-drag ratio is not large. But for this configuration, the front wing lift coefficient is increased and the drag coefficient is significantly reduced, while the after wing is just the opposite, eventually making the front wing maximum lift-drag ratio much larger than that of the after wing, which shows that the front wing aerodynamic efficiency in this configuration is much better than that of the after wing.
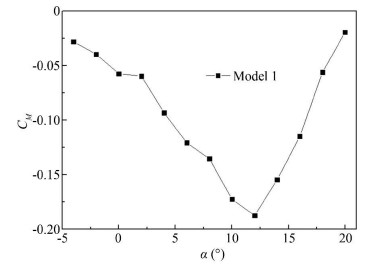
4.1.3 Numerical analysis of the pitching moment characteristicsIt can be seen from Fig. 10 that the characteristic curve of pitching moment of Model 1 has obvious non-linear characteristics. From the numerical simulation results, the UAV has the longitudinal static stability when α is smaller than 12°, but there are pitching moment ′rise′ phenomena near α=2° and α=8°. When the angle of attack α is larger than 12°, ′pitchup′ phenomenon occurs in the characteristic curve of pitching moment. The characteristic curve of pitching moment exhibits strong non-linear characteristics with the change of the angle of attack. In order to facilitate the distinction, the phenomenon of the first rise and fall after the rise in the characteristic curve of pitching moment is called ′rise′ phenomenon, and the swept wing is referred to as ′pitchup′ for the phenomenon that no more descent after rise occurs in the characteristic curve of pitching moment.
|
Fig.10 Pitching moment characteristic curve of Model 1 |
In order to analyze the flow characteristics of the 'rise' phenomenon, the flow fields near α=2° and α=8° were studied, and the reason of the pitching moment 'pitchup' phenomenon was analyzed.
(1) Analysis of the 'rise' phenomenon of the characteristic curve of pitching moment near α=2°.
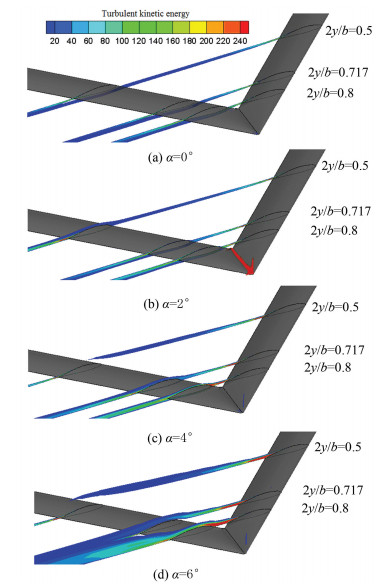
Fig. 11 shows the front wing's wake influence range and intensity by the schematic diagrams of the turbulent kinetic energy. The sectional position is shown in Fig. 4.
|
Fig.11 Turbulent kinetic energy (α=2°-6°) |
The flow through the front wing produces a wake area with large turbulent kinetic energy. The front wing wake flows from the after wing lower surface at α=0°, and the intensity of the trailing vortex is not very large. The influence of the front wing on the after wing is mainly the deflection of the front wing to the airflow, which decreases the after wing effective angle of attack. With the increase of angle of attack, the front wing's circulation increases, the intensity of the front wing wake increases, and the strongest region of the front wing wake moves upward. Eventually, the front wing wake flows directly through the after wing surface near α=2°. The front wing wake and the after wing boundary layer blend and destroy the after wing flow field structure. The change range of the flow field structure affects more than 30% spanwise region of the after wing, which makes its lift characteristics decrease sharply. When α continues to increase to 4°, although the front wing wake's intensity increases, the strongest region continues to move up and the effect on the after wing surface layer structure is already small at 2y/b=0.717. Although the turbulence generated by the front wing at 2y/b=0.8 is still covered with the after wing, the influence of the spanwise region is significantly reduced, and its lift characteristics is restored. When α=6°, the wake of the front wing basically passes from above the after wing, and no longer affects the after wing flow field structure.
The front wing and the after wing flow separation near α=2° is negligible, which is not a major factor and does not affect the pitching moment characteristics. Therefore, the main factor that leads to the ′rise′ phenomenon of the characteristic curve of pitching moment at α=2° is the front wing wake's direct sweep which changes the after wing flow field structure.
(2) Analysis of the ′rise′ phenomenon of the characteristic curve of pitching moment near α=8°.
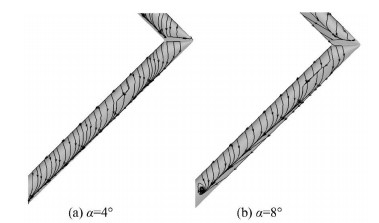
Fig. 12 shows the limit streamline distribution of the UAV (α=4° and α=8°). Comparison of the limit streamline distribution of the after wing at α=4° and α=8° shows that as the angle of attack increases, the trailing edge separation lines move to the direction of the wing tip and leading edge. The after wing spanwise flow direction and accumulation to the root form the separated vortex region. This separated vortex extends to almost the entire after wing root upper surface. As the after wing root is far from the focus of the UAV, the decrease of the after wing root lift caused by the flow separation is the main reason of the 'rise' phenomenon of the characteristic curve of pitching moment near α=8°.
|
Fig.12 Limit streamline distribution (α=4° & α=8°) |
The front wing trailing edge also has the flow separation, and the aerodynamic efficiency of the front wing is reduced. At this time, the position of the front wing separation region is located after the focus, and the flow separation causes the nose-up pitching moment a slight increase. In addition, as shown in Fig. 8, the after wing inhibitory effect on the separation of the front wing wingtip also leads to a small increase of the nose-up pitching moment, but its contribution to the 'rise' phenomenon of the characteristic curve of pitching moment is small.
(3) Analysis of the ′pitchup′ phenomenon of the characteristic curve of pitching moment near α=12°.
When α is greater 12°, the pitching moment ′pitchup′ phenomenon similar to the swept wing configuration occurs in the characteristic curve of pitching moment. The ′pitchup′ phenomenon does not occur in the UAV immediately after α=8°. The main reason is that with the increase of the angle of attack, the flow separation phenomenon occurs in both the front wing and the after wing, and the range of the flow separation region is expanded. When the angle of attack continues to increase, the front wing flow separation range expands and crosses the position of reference point, so that the front wing stall provides nose-down pitching moment by providing a small amount of nose-up pitching moment. Under the influence of the front wing downwash, the flow separation area of the after wing is smaller than that of the front wing, and the front wing is ahead of the after wing stall, which leads to an increase in the nose-down pitching moment. Because of the higher aerodynamic efficiency of the front wing, the nose-down pitching moment contribution by the front wing stall still ensures that UAV's pitching moment characteristic curve restores the longitudinal static stability again after ′rise′ slightly at α=8°, and may even increase the longitudinal stability margin of the UAV. When α=12°, the after wing is almost completely stalled. It can provide a sharp reduction of the nose-down pitching moment, the ′pitchup′ phenomenon occurs in the characteristic curve of pitching moment.
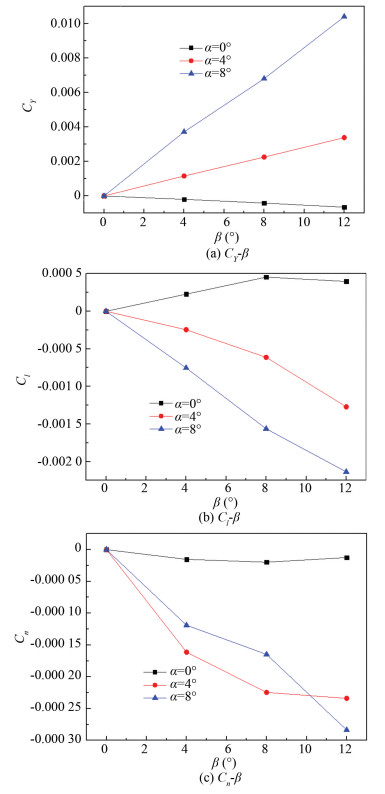
4.2 Numerical Analysis of Lateral-Directional Aerodynamic CharacteristicsTo study the lateral-directional characteristics of the UAV, numerical calculations on Model 1 were performed. The calculated states are α=0°, 4°, 8° and β=0°, 4°, 8°, 12°.
Fig. 13(a) shows the lateral force coefficients curve with the increase of sideslip angle. It can be seen that lateral force coefficient changes linearly as the sideslip angle increases. When the angle of attack is small, the derivative of the lateral force coefficient is negative. With the increase of the angle of attack, the lateral force coefficient derivative changes from negative to positive, but its value is relatively small, and its magnitude is even smaller than the drag coefficient at small angle of attack, which is mainly because the vertical tail and the fuselage are the main components that produce lateral forces. The wing provides very little lateral force under the condition of sideslip.
|
Fig.13 Lateral-directional aerodynamic performance |
Fig. 13(b) shows the rolling moment coefficients variation curve. It can be seen from the figure that the lateral static stability derivative (Clβ) is relatively small at all angles of attack. The rolling moment is mainly provided by the wings. For Model 1, the front wing with back-swept angle provides lateral static stability and the role of the after wing is the opposite. In theory, the rolling moment provided by the front wing and the after wing offset each other, and the aircraft presents lateral neutral stability.
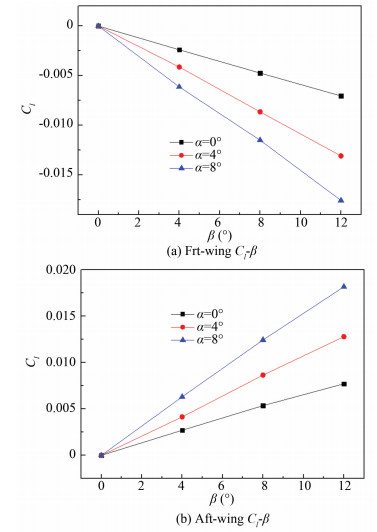
However, for the special configuration, the aerodynamic efficiency and the separation characteristics of the after wing change obviously under the influence of the downwash of the front wing. Fig. 14 shows that when the angle of attack is small, the negative rolling moment coefficient provided by front wing and the positive rolling moment coefficient provided by the after wing almost offset each other, resulting in the aircraft's nearly lateral neutral stability at α=0°. With the increase of the angle of attack, the front wing lift increases, the front wing effect on the after wing is enhanced, the after wing aerodynamic efficiency is reduced, and the ability to offset the negative rolling moment coefficient provided by the front wing is reduced. The UAV has lateral static stability.
|
Fig.14 Rolling moment coefficient (front wing & after wing) |
Fig. 14 shows that the reduction of the lateral static stability derivative of the front wing from α=4° to α=8° is less than that from α=0° to α=4°. The main reason for the situation is that the front wing begins to have flow separation phenomenon, and the strength and range of the after wing flow separation are much smaller than that of the front wing because of the effect of the downwash at α=8°, which affects the increase of the lateral static stability derivative of the aircraft.
Fig. 13(c) shows the variation curve of the yawing moment coefficients with the increase of sideslip angle. It can be seen from the figure that the directional static stability derivative absolute value is very small, which is only 10-5 of the magnitude. The yawing moment coefficient of the UAV is mainly provided by the vertical tail and fuselage. For the flat layout, the yawing movement coefficient is very small under the condition of sideslip. It can be considered that the flat layout Diamond Joined-Wing configuration presents the directional neutral stability.
5 Influences of Configuration Parameters on Aerodynamic CharacteristicsAs this configuration has two wings, the configuration parameters can be flexibly adjusted so that the aerodynamic performance can meet the needs of engineering practice. Studying the effect of the change of the configuration parameters of the front wing and the after wing on the aerodynamic characteristics can provide theoretical basis for engineering application.
In order to make the study comparable, when the configuration parameters were changed, the span and the chord in the direction of the flow of this configuration were kept constant. We adjusted the back-swept angle of the front wing and forward-swept angle of the after wing on the basis of Model 1 to change the longitudinal distance between the wings, and adjusted the dihedral angle of the front wing and the anhedral angle of the after wing on the basis of the Model 1 to change the angle between the front wing and the after wing. We also studied the influence of aerodynamic characteristics by changing these parameters.
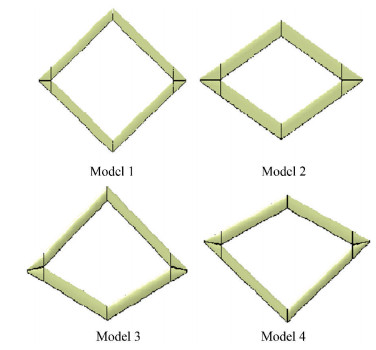
5.1 Influence of Changing the Longitudinal Distance between Wings on Aerodynamic PerformanceFig. 15 is the schematic diagram obtained by adjusting the longitudinal distance between the wings. The back-swept angle of the front wing and the after wing forward-swept angle were changed to 30° to obtain Model 2. To keep the front wing forward-swept angle unchanged, the forward-swept angle of the after wing was changed to 30° to obtain Model 3, and to keep the after wing back-swept angle unchanged, the front wing forward-swept angle was changed to 30° to obtain Model 4.
|
Fig.15 Configuration with changing longitudinal distance between the wings |
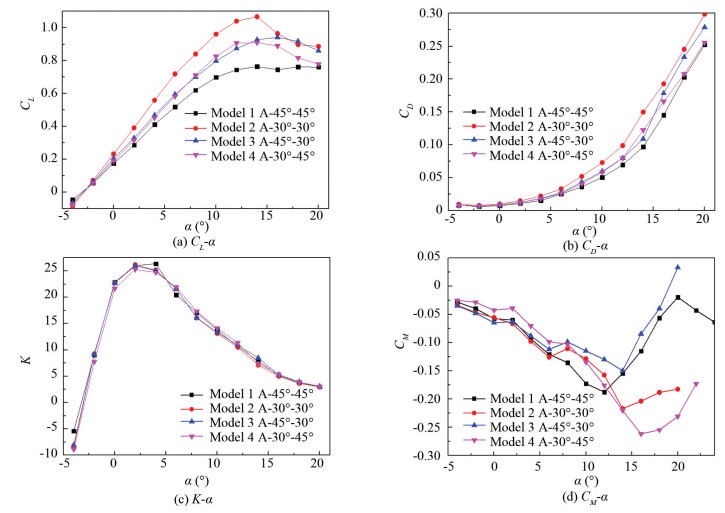
Fig. 16(a) is the lift characteristic curve, where ′Λ-XX°-XX°′ represents the front wing back-swept angle and the after wing forward-swept angle of the models. From the lift characteristics shown in Fig. 16(a), it can be seen that Model 1 is the worst and Model 2 is the best. This phenomenon is caused by the relatively large front wing back-swept angle and the after wing forward-swept angle. In subsonic flight, the larger the sweep angle, the worse the aerodynamic efficiency. The aerodynamic characteristics of Model 3 in the small angle of attack are slightly better than that of Model 4. The main reason is that the aerodynamic performance of the front wing of Model 3 is better, and the front wing downwash effect on the after wing is more intense, which causes the after wing aerodynamic performance of Model 4 to be worse than Model 3.
|
Fig.16 Longitudinal aerodynamic performance of different models |
From Fig. 16 (b) Model 1 drag characteristics of the best and Model 4 drag characteristics of the worst can be seen. This is mainly because when the longitudinal distance between the wings is reduced, the intensity of the front wing wake covers larger region of the after wing, which directly affects the after wing surface flow field structure, resulting in a significant increase in the after wing drag.
From Fig. 16 (c) we can see that due to the effect of two aspects, in a certain range, the change of the longitudinal distance between the wings decrease will not lead a larger change in the aerodynamic efficiency. However, when the wing swept angle is large, the lift characteristics of the wing are poor, the true length of the swept wings is longer, the string length of the stiffness axis perpendicular to the front edge of the wing is shorter, and the strength and stiffness of the wing are poor. Therefore, the longitudinal distance between the wings should be properly reduced when the design requirements and the aerodynamic efficiency are not significantly different.
Fig. 16(d) shows the characteristic curve of pitching moment in the case of changing the longitudinal distance between the wings. Comparison of the pitching moment characteristic curve shows that the ′rise′ phenomenon all occur in those models near α=2°, indicating that the ′rise′ phenomenon caused by the after wing lift characteristics reduction brought about by the direct sweep of the front wing wake cannot be eliminated by changing the longitudinal distance between the wings. Compared with Model 1, the longitudinal distance between the other three models is reduced, and the coupled aerodynamic disturbance is more serious, so the ′rise′ phenomenon near α=8° is also more serious than that of Model 1. The ′rise′ phenomenon of Model 2 and Model 3 is significantly higher than that of Model 1 and Model 4 near α=8°. As the forward-swept angle of Model 2 and Model 3 after wing are smaller than those of Model 1 and Model 4, and the aerodynamic efficiency of the after wing is higher, the lift reduction caused by the root stall is greater, which leads to more serious ′rise′ phenomenon of Model 2 and Model 3. Comparison of Model 1 and Model 4 shows that the ′pitchup′ phenomenon of the angle of attack of Model 4 is greater than that of Model 1, which is mainly because the pitching moment is provided by the front wing and the after wing. The front wing back-swept angle decreases, its aerodynamic efficiency increases, and the front wing downwash effect on the after wing is also enhanced, making Model 4 after wing stall region less than that of Model 1, so the angle of attack of Model 4 where the 'pitchup' phenomenon occurring increases.
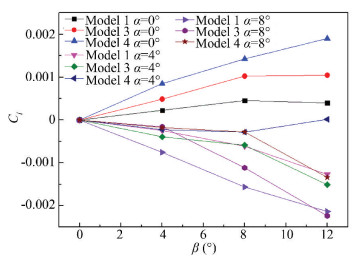
By changing the longitudinal distance between the wings, the lateral static stability is affected, but the directional static stability is less affected. Fig. 17 shows the variation curve of the rolling moment coefficients when the longitudinal distance between the wings is changed.
|
Fig.17 Rolling moment coefficient |
From the comparison of the rolling moment coefficients characteristic curve shown in Fig. 17, it can be found that with the decrease of the longitudinal distance between the wings, the aircraft rolling moment coefficient increases. But on the whole, the aircraft lateral static stability varies little with the change of the longitudinal distance between the wings.
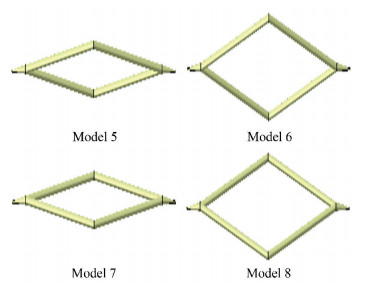
5.2 Influence of Changing the Angle between Wings on Aerodynamic PerformanceThe influence of the change of the angle between the front wing and the after wing was also studied. On the basis of Model 1, the front wing with 5° anhedral angle and the after wing with 5° dihedral angle obtain a positive staggered layout Model 5 with the angle between the wings of 10°, and the front wing with 10° anhedral angle and the after wing with 10° dihedral angle obtain a positive staggered layout Model 6 with the angle between the wings of 20°. The front wing with 5° dihedral angle and the after wing with 5° anhedral angle obtain a negative staggered layout Model 7 with the angle between the wings of 10°. The front wing with 10° dihedral angle and the after wing with 10° anhedral angle obtain a negative staggered layout Model 8 with the angle between the wings of 20°. Finally, the layout diagram is obtained, as shown in Fig. 18.
|
Fig.18 Layout changed by changing the angle between the wings |
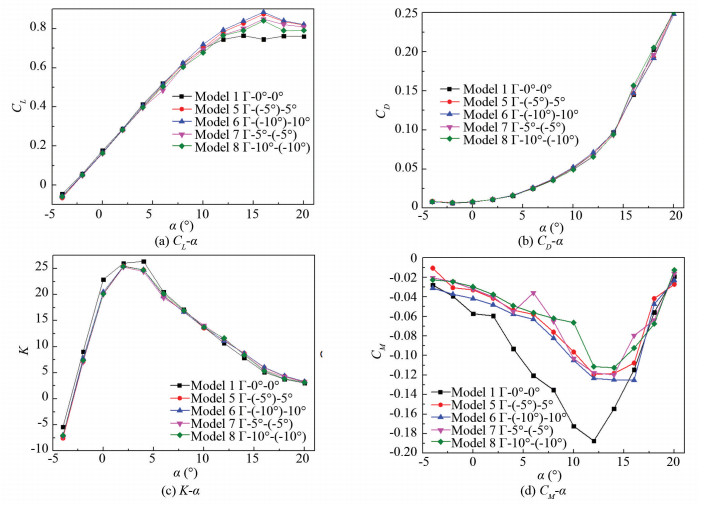
Fig. 19 shows the aerodynamic coefficient characteristic curve, where ′Λ-XX°-XX°′ represents the dihedral angle of the front wing and the after wing of the models. The anhedral angle is negative. As shown in Fig. 19(a) and Fig. 19(b), the change of the angle between the front wing and the after wing has little influence on the lift characteristics and drag characteristics, whether it is a positive staggered layout or negative staggered layout.
|
Fig.19 Longitudinal aerodynamic performance of different models |
Fig. 19(d) shows the characteristic curve of pitching moment in the case of changing the angle between the wings. It can be seen from the figure that for the positive staggered layout such as Model 5 and Model 6, the front wing angle of attack that directly sweeps the after wing is negative. The after wing can avoid the front wing wake's influence at level flight. With the increase of the angle of attack, the front wing wake effect becomes smaller. Therefore, before the ′pitchup′ phenomenon, the aircraft has only one pitching moment non-linear region in the characteristic curve of pitching moment of the positive staggered layout. By increasing the angle between the wings of the positive staggered layout, the angle of attack of the ′rise′ phenomenon caused by the front wing wake direct sweep on the after wing can be moved to the negative angle of attack which is seldom used. For the negative staggered layout such as Model 7 and Model 8, the ′rise′ phenomenon caused by the front wing wake direct sweep on the after wing can be moved backward which can be coupled with the ′rise′ phenomenon caused by the after wing root separation so that the characteristic curve of pitching moment non-linear region can be reduced to one, which reduces the difficulty of control.
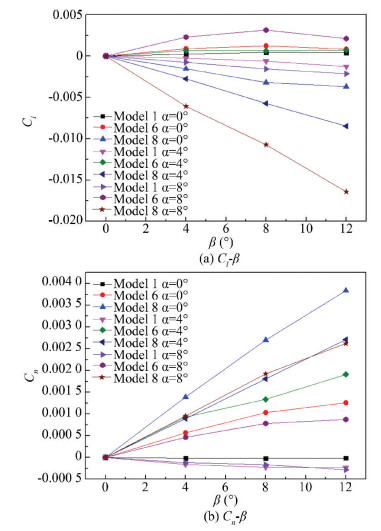
Fig. 20 shows the variation curve of the rolling moment coefficient and yawing moment coefficients when the angle of the front wing and the after wing is changed. Model 8 of the negative staggered layout has lateral static stability, and its lateral static stability derivative is much larger than that of the flat layout, while Model 6 of the positive staggered layout has the lateral static instability.
|
Fig.20 Rolling moment coefficient and yawing moment coefficient |
The main reason for the situation is that when the aircraft is using the negative staggered layout, the dihedral angle and sweep angle of front wing serves to provide the lateral static stability and the anhedral angle and forward sweep angle of after wing serves to provide lateral static instability. As the angle of attack increases, the front wing downwash influence on the after wing increases, the positive rolling moment coefficients provided by the after wing decreases, and the aircraft lateral static stability derivative increases. But for the positive staggered layout and for the front wing, the sweep angle provides the lateral static stability and the anhedral angle provides the lateral static instability. It is generally believed that the 10° back sweep angle can provide about 1° of effective dihedral angle, so that the rolling moment coefficient provided by the front wing back sweep angle and dihedral angle counteracts each other, thus the lateral static stability derivative it can provide is smaller. The after wing characteristics are similar to that. At present, when there is an angle between the wings, the interference between the front wing and after wing is relatively small.
As the angle of attack increases, the after wing gradually moves away from the wake of the front wing. The front wing downwash influence on the after wing decreases, the rolling moment coefficients provided by the front wing and the after wing will be further offset, and the aircraft presents lateral static instability or neutral stability.
Fig. 20(b) shows that the front wing and after wing with dihedral angle and anhedral angle play the role of vertical stabilizer, which greatly increases the vertical projection area, and the directional static stability derivative increases from 10-5 to 10-4. The directional static stability of the aircraft increases.
6 Conclusions(1) The front wing and the after wing aerodynamic characteristics of Diamond Joined-Wing configuration were greatly different from that of the alone front wing and the after wing. For the front wing, the after wing had the ability to transport the front wing's boundary layer to the after wing root. There was an inhibitory effect on the front wing flow separation. Although the front wing was affected by the after wing retardation which resulted in a decrease in aerodynamic performance, the front wing aerodynamic performance was better than that of the alone front wing in most cases. The after wing was affected by the front wing wake and the downwash, and its aerodynamic performance was greatly decreased compared to the front wing or the alone after wing. The characteristic curve of pitching moment had nonlinear characteristics. The reason for the non-linear ′rise′ phenomenon of the characteristic curve of pitching moment near α=2° was due to the after wing flow structure change and the decrease of aerodynamic efficiency caused by the front wing wake directly sweep, and there were many reasons for the ′rise′ phenomenon of the characteristic curve of pitching moment near α=8°, but the separation of the after wing root played a major role. The reason for the ′pitchup′ phenomenon of the characteristic curve of pitching moment near α=12° was the front wing and the after wing flow separation caused by coupling.
The lateral-directional static stability of the flat layout was weak. From the perspective of ensuring the lateral-directional static stability, the flat layout Diamond Joined-Wing such as Model 1 is not desirable.
(2) The effect of changing the longitudinal distance between the wings on the aerodynamic performance had a dual effect. On the one hand, reducing the longitudinal distance between the wings could be used to reduce the sweep angle of wings, which can increase the aerodynamic performance. On the other hand, the decrease of the longitudinal distance between the wings would lead to the strengthening of the effect on aerodynamic interference between the front wing and the after wing, which can reduce the aerodynamic performance. In a certain range, the change of the longitudinal distance between the wings decrease would not lead to a larger change in the aerodynamic efficiency. However, when the wing sweep angle was large, the lift characteristics of the wing was poor, and the true length of the swept wings was longer, the string length of the stiffness axis perpendicular to the wing front edge was shorter, and the strength and stiffness of the wing was poor. Therefore, the longitudinal distance between the wings should be properly reduced when the design requirements and the aerodynamic efficiency were not significantly different. The ′rise′ phenomenon caused by the reduction of the after wing lift characteristics could not be eliminated by changing the longitudinal distance between the wings. However, choosing the proper longitudinal distance between the wings could weaken the front wing wake's intensity and reduce the ′rise′ phenomenon strength. Changing the longitudinal distance between the wings could effectively improve the non-linearity of the characteristic curve of pitching moment due to the separation of the after wing root, postpone the angle of attack of the pitching moment ′pitchup′ phenomenon, and improve the high angle of attack characteristics of the UAV. The aircraft lateral-directional static stability varied little with the change of the longitudinal distance between the front wing and the after wing.
(3) Changing the angle of the front wing and the after wing had little effect on the lift characteristics and drag characteristics of this configuration, but could control the angle of attack of the pitching moment ′rise′ phenomenon occurrence caused by the front wing wake direct sweep to avoid using design points. The negative staggered layout could improve the lateral static stability. However, both the positive staggered layout and the negative staggered layout could improve the directional static stability of the Diamond Joined-Wing configuration UAV.
| [1] |
Wolkovitch J. The joined wing: An overview. Journal of Aircraft, 1986, 23(3): 161-178. DOI:10.2514/3.45285 (  0) 0) |
| [2] |
Craft R L. Drag Estimates for the Joined-Wing Sensor Craft, 05J02. Ohio: Air Force Institute of Technology. AFIT, 2005.
(  0) 0) |
| [3] |
Bond V, Canfield R A, Matos M, et al. Wind tunnel testing of a twisted wing for longitudinal control in a Joined-Wing aircraft. Proceedings of 48th AIAA/ASME/ASCE/AHS/ASC Structures, Structural Dynamics, and Materials Conference, Structures, Structural Dynamics, and Materials and Co-located Conferences. Honolulu: AIAA. 2007.1772.1-7.DOI: 10.2514/6.2007-1772.
(  0) 0) |
| [4] |
Livne E. Aeroelasticity of Joined-Wing airplane configurations: Past work and future challenges-A survey. 19th AIAA Applied Aerodynamics Conference, Fluid Dynamics and Co-located Conferences, 2001, 1370: 16-19.DOI: 10.2514/6.2001-1370.
(  0) 0) |
| [5] |
Pérez-álvarez J, Cuerno-Rejado C, Meseguer J. Aerodynamic parametric analysis of an unconventional Joined-Wing aircraft configuration. Proceedings of the Institution of Mechanical Engineers, Part G: Journal of Aerospace Engineering, 2016, 230(10): 1917-1933. DOI:10.1177/0954410015620444 (  0) 0) |
| [6] |
Kroo I, Smith S, Gallman J. Aerodynamic and structural studies of joined-wing aircraft. Journal of Aircraft, 1991, 28(1): 74-81. DOI:10.2514/3.45994 (  0) 0) |
| [7] |
Andrews S A, Perez R E. Stability and control effects on the design optimization of a box-wing aircraft. 14th AIAA Aviation Technology Integration and Operations Conference. Atlanta: AIAA, 2014, 2592: 1-22.DOI: 10.2514/6.2014-2592.
(  0) 0) |
| [8] |
Rasmussen C C, Canfield R A, Blair M. Joined-wing sensor-craft configuration design. Journal of Aircraft, 2006, 43(5): 1470-1478. DOI:10.2514/1.21951 (  0) 0) |
| [9] |
Martinez J, Flick P, Perdzock J, et al. An overview of sensorcraft capabilities and key enabling technologies. Proceedings of 26th AIAA Applied Aerodynamics Conference. Honolulu, Hawaii: AIAA. 2008: AIAA 2008-7185.DOI: 10.2514/6.2008-7185.
(  0) 0) |
| [10] |
Stearman, R. Influence of joint fixity on the aeroelastic characteristics of a joined wing structure. Proceedings of the 31st AIAA/ASME/ASCE/AHS/ASC Structures, Structural Dynamics and Materials Conference, AIAA. 1990. 1442-1454.DOI: 10.2514/6.1990-980.
(  0) 0) |
| [11] |
Reichenbach E, Castelluccio M, Sexton B. Joined wing sensorcraft aeroservoelastic wind tunnel test program.Proceedings of 52nd AIAA/ASME/ASCE/AHS/ASC Structures, Structural Dynamics and Materials Conference. Denver: AIAA, 2011: AIAA 2011-1956.DOI: 10.2514/6.2011-1956.
(  0) 0) |
| [12] |
Nangia R, Palmer M, Tilmann C. Unconventional high aspect ratio joined-wing aircraft with aft-& forward-swept wing-tips. Proceedings of the 41st AIAA Aerospace Sciences Meeting and Exhibit. Reno, NV: AIAA, 2003: AIAA 2003-0506.DOI: 10.2514/6.2003-605.
(  0) 0) |
| [13] |
LeDoux S, Vassberg J, Fatta G, et al. Aerodynamic cruise design of a joined wing sensor craft. 26th AIAA Applied Aerodynamics Conference. Honolulu, Hawaii: AIAA, 2008, AIAA 2008-7190.DOI: 10.2514/6.2008-7190.
(  0) 0) |
| [14] |
Ji X F. Research on the Overall Design of the Sensorcraft. Xi'an: Northwestern Polytechnical University, 2008.
(  0) 0) |
| [15] |
Chu L, Ma D L, Zhang S, et al. Solution model for aerodynamic characteristics of Joined-Wing configuration. Acta Aeronautica et Astronautica Sinica, 2010(5): 909-913. (  0) 0) |
| [16] |
Li J, Li Z K, Song B F. Conceptual layout design of the joined-wing high-altitude-long-endurance UAV. Flight Dynamics, 2009, 27(4): 1-4. (in Chinese) (  0) 0) |
| [17] |
Liu X Q, Li Q, Chai J Z, et al. Aerodynamic characteristic research for box-wing aircraft. Journal of Nanjing University of Aeronautics & Astronautics, 2008, 39(6): 722-725. DOI:10.3969/j.issn.1005-2615.2007.06.006 (  0) 0) |
| [18] |
Zhang X P, Zeng H H, Yu X Q. Application of CFD in conceptual design of joined-wing aircraft. Journal of Nanjing University of Aeronautcs & Astronautics, 2004, 36(6): 763-768. DOI:10.3969/j.issn.1005-2615.2004.06.020 (  0) 0) |
| [19] |
Wang Y K, Shan J X, Tian W, et al. Investigation on non-linear characteristic of pitching moment of joined wing configuration aircraft. Journal of Beijing University of Aeronautics and Astronautics, 2012, 38(7): 862-866. (in Chinese) (  0) 0) |
| [20] |
Li G L, Li G W, Li J, et al. The aerodynamics investigation of the joined-wing configuration. Acta Aerodynamica Sinica, 2006, 24(4): 513-519. DOI:10.3969/j.issn.0258-1825.2006.04.023 (  0) 0) |
| [21] |
Chen C J, Jaw S Y. Fundamentals of Turbulence Modeling. Washington: Taylor & Francis, 1998.78-82.
(  0) 0) |
| [22] |
Manie F, Raynal J C. Transonic Measurements on the ONERA AFV D Variable Sweep Wing in the ONERA S2 MA-Wind Tunnel, AGARD-AR-138.Brussels: North Atlantic Treaty Organization, 1979.
(  0) 0) |
 2019, Vol. 26


