 2020, Vol. 27


Traditional empirical assessment of modal choice in transportation relies on time and cost as main attributes that influence people's travel choice behaviors. However, as Tirachini et al.[1] pointed out that "with the improvement of both our understanding of the modal choice problem and analytical tools (e.g., discrete choice models), we have accumulated unambiguous evidence that shows how users take into account several qualitative aspects that enhance or harm the experience of traveling. In the case of public transport, this includes the number of passengers that have to share a bus or train, the quality of seats and the smoothness of the ride, among many others."
Crowding is related to a high density of passengers on vehicles, access ways, and stations. The effects of high passenger density at bus stops, rail stations, and inside buses and trains are diverse[1]. There are lots of disadvantages of crowding in public transit. For instance, it increases dwell time at stops and stations[2-5], which will bring significant difficulties for buses and metros to adhere to arranged timetables. Furthermore, crowding of public transit will increase personal stress and dissatisfaction[6-7], and thus affects travelers' experience of traveling by public transit.
Therefore, it is necessary to figure out the WTP (willing-to-pay) of travelers on the crowding of public transit. Although some achievements have been made, most of them (except works of Basu[8] and Jiang[9]) discussed the issue in developed countries or regions, while there is still few research related to the impact of crowding of public transit in China. Also, as Li[10] pointed out, the benchmarks that define the unacceptable crowding levels vary across different countries and regions. For example, 4 standees per square meter is the benchmark for Australia[11], and the number increases to 5 for the USA[12], whereas the Guangzhou Metro is much more crowded than those in most developed countries or regions.
Furthermore, as Das et al.[13] stated, "since the service delivery environment differs between developed and developing nations, the user perception of service quality varies between these economic regions", therefore, research results of other regions may not be applicable to China.
Researchers such as Cheng et al.[14] and Hensher et al.[15] also argued that some of the travelers' demographic characteristics, especially travel purpose and job nature, affect travelers' evaluation of the service quality of the public transit significantly. Therefore, this paper analyzes the impact of crowding in metro carriages on travelers' utility. Travelers were divided into three groups according to their travel purposes, i.e., commuters, non-commuters, and college students.
The structure of the paper is arranged as follows. Section 2 examines the literature related to crowding in public transit. Section 3 discusses the experiment designed in this paper. The results analysis is outlined in Section 4 and the paper ends with a discussion in Section 5.
2 Literature Review 2.1 Definition of Crowding Inside CarriagesSo far, there are 4 mainstream methods that describe crowding levels inside buses, metro carriages, and trains: the number of standees, load factor, standee density, and standing time.
Hensher et al.[15] described crowding with the ratio of seats occupied and the number of standees, in which seats occupied range from 25% to 100% and the numbers of standees are 0-27 per carriage for the bus, 0-120 per carriage for the train, and 0-125 per carriage for the metro.
Load factor is defined as the ratio between the number of passengers and the number of the seats (passenger/seat), which was used to assess crowding levels in some previous studies[1, 16-17].
Since the number of seats in the carriage varies by the type of vehicle, the number of standees and the load factor can only provide a rough approximation of crowding in carriages of different buses, metro carriages, and trains. Some researchers thus argued that standees density (the number of standees per square meter) is a better indicator of crowding levels because it can eliminate the impact of types of carriages. Therefore, the effect of crowding defined by standee density can be compared among different carriages, and many researchers[1, 8, 9, 16, 18-19] have studied the effect of crowding by using standee density.
In addition to the number of standees, load factor, and standee density, some researchers also described crowding with standing time inside the carriages[20-22].
2.2 Description of CrowdingPrevious studies employed the linguistic notion method and the photography presentation method to present crowding levels to interviewees.
Ryus et al.[23] described the crowding level inside buses and rail carriages with the linguistic notion method exhibited in Table 1. Jiang et al.[9] and Qin[19] also depicted crowding levels with the method.
| Table 1 Description of crowding in TCQSM |
Researchers Tirachini et al.[1], Hensher et al.[15], Whelan[16], Kroes et al.[17, 24] depicted crowding in the train with bird-eye-view as shown in Fig. 1.

|
Fig.1 Example of crowding in Ref.[16] |
2.3 Utility Functions: Constant Value and Multiplier
The constant-value-per-trip model assumes that the impact of the crowding in carriages is irrelevant to the time in carriages. While the travel time multiplier value model assumes that the impact of the crowding in carriages is proportional to the time in carriages. Some scholars[1, 8, 9, 20, 25] discussed crowding with the single constant-value-per-trip model, while some[15-17, 24, 26] studied the crowding effect with the travel time multiplier value model.
2.4 Impacts of Demographic CharacteristicsAlthough most of the previous studies[1, 9, 15, 18-19, 21-22, 26] did not consider the impacts of demographic characteristics on the value of crowding in carriages, some researchers such as Whelan et al.[16], Douglas et al.[20], and Haywood et al.[25] studied these factors.
Basu et al.[8] investigated the impact of monthly household income, age, and gender, while they failed to find out the influences of these demographic characteristics on the value of crowding in trains. Douglas et al.[20] discussed the effects of gender, age, and trip purpose on the evaluation of crowding, and the results show that these are not significant indicators. Whelan et al.[16] found out that business travelers have a higher disutility of the time spent in crowded conditions. Haywood et al.[25] studied the effects of demographic characteristics such as car ownership, gender, and income, and they found that individual income, gender, and car ownership are not always good indicators of people's taste for comfort in public transit.
3 Experiment Design and Data CollectionSince the number of seats in metro carriages in China varies, the load factor is not appropriate for the measure of crowding, so the standee density is chosen as the indicator of crowding in this paper.
In order to estimate the disutility of crowding in metro carriages, a stated preference (SP) choice experiment was conducted, in which interviewees were offered a series of choices between two hypothetical alternative metro services including various crowding levels and other characteristics.
To make sure that the interviewees understand the hypothetical alternative perfectly, the experiment was designed with a two-stage process, i.e., a pre-survey and a formal survey. In the pre-survey stage, six attributes were included within the SP: 1) crowding in metro carriages, 2) waiting time at stations, 3) ticket price, 4) in-vehicle time, 5) walking time from the origination to the station, and 6) transfer. Four people were convened to evaluate the interpretability of the SP scenario, but all complained that there were too many attributes to understand, which was consistent with the arguments in Refs. [21, 27].
Therefore, the number of attributes was decreased to four, and the attributes and levels of the attributes are shown in Table 2. There are 4 levels of crowding in the metro carriage, i.e., 0, 1, 4, and 7 persons/m2.
| Table 2 Levels of the attributes in the formal stage |
Also, we were interested in the difference of attitudes towards crowding in the metro carriage among respondents and the effects of different crowding-description methods (i.e., the linguistic notion method, the bird-eye-view method, the photography presentation method, and the comic method), especially the linguistic notion method and the photography presentation method. Therefore, we investigated two groups of metro users, i.e., full-time workers and college students by using the linguistic notion method and the photography presentation method.
For college students, based on related research achievements[9, 19] and the crowding levels in metro carriages in China, 4 levels of crowding in the metro carriage were designed as shown in Table 3.
| Table 3 Standee density and the description |
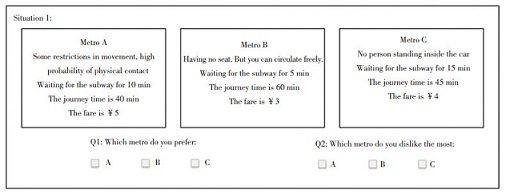
An example of the surveys performed for college students is shown in Appendix Ⅰ, in which each student undertook one comparison and 16 questions similar to the table in Appendix Ⅰ were developed.
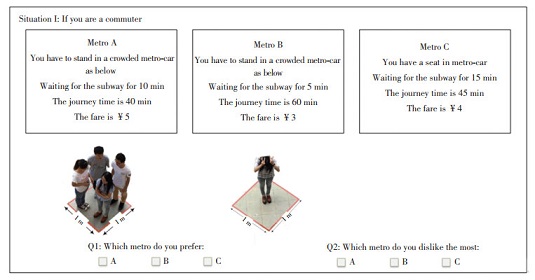
As for full-time workers, we described crowding in the metro carriage with the photographs in Fig. 2. An example of the surveys performed for full-time workers is shown in Appendix Ⅱ. Some of the demographic characteristics were investigated and are shown in Table 4.

|
Fig.2 Description of crowding in the metro carriage |
| Table 4 Demographic characteristics of the full-time workers |
Since we were interested in the effect of travel purpose on crowding evaluation of full-time workers, in the formal survey, we asked respondents to make their choices in the context of travel purpose (commuter or non-commuter), and each respondent undertook one comparison.
Sixteen choice sets were developed for college students and full-time workers as shown in Appendix Ⅲ.
4 Data Analysis 4.1 Descriptive AnalysisSurveys were undertaken in stations of Guangzhou Metro (the Tiyuxi Station and the Zhujiang Newtown Station) on weekdays in May and June 2015 for full-time workers and on the Wushan Campus of the South China University of Technology in April and May 2015 for college students. Each interviewee was asked to evaluate only one randomly selected choice set as shown in Appendix Ⅲ. In the survey of full-time workers, we asked the interviewee whether he or she was full-time workers, and we only continued our SP choice investigation if the answer was "yes." In total, 736 interviews were completed (368 for the commuters and 368 for the non-commuters) for full-time workers and 368 for college students.
Table 4 shows the demographic characteristics of the full-time workers.
Females account for 49.1% of the respondents. None of the respondents owned a car. 92.1% of the respondents traveled by metro more than once a week, and all the respondents traveled by metro more than once per month, which indicates that all the respondents are familiar with the metro. As to the income, it turned out that most of the respondents were reluctant to answer the question (76%), and the remaining only chose the option "no more than ¥5000 per month." Since Haywood et al.[25] considered that income is not a good indicator of people's taste for comfort, it is not discussed in this paper. As for age, since we focused our interest on full-time workers, all respondents were aged between 20 and 55.
Females comprised 48.9% of the investigated college students. None of the respondents had a car. As to the frequency of traveling by metro, 88.3% of the respondents traveled by metro more than once per week, and all of the respondents traveled by metro more than once per month, which indicates that all are familiar with the metro.
Table 5 shows the demographic characteristics of the college students with the data obtained in the SP survey.
| Table 5 Demographic characteristics of the college students |
Females comprised 48.9% of the investigated college students. None of the respondents had a car. As to the frequency of traveling by metro, 88.3% of the respondents traveled by metro more than once per week, and all of the respondents traveled by metro more than once per month, which indicates that all are familiar with the metro.
4.2 Constant-Value-Per-Trip ModelThe collected SP data was analyzed with the ordered logit model, which is derived under an assumption of utility-maximizing.
The disutility of the constant-value-per trip model is expressed as follows:
| $ V=\sum\limits^4_{i=2} D_{i}d_{i}+α_{0}{\rm IVT}+α_{1}{\rm Fare}+α_{2}{\rm Wait} $ | (1) |
where V is the observed component of utility, di (i=1, 2, 3, 4) is dummy variable, and d1, d2, d3, d4 correspond to 0, 1, 4, 7 persons/m2 of standee density, respectively. d1 equals to 1 when the standee density is 0 person/m2, and it equals to 0 when the standee density is not 0 person/m2. "IVT" is in-vehicle time (minutes), "Wait" is the waiting time at the station, and "Fare" is the ticket price (¥ Yuan). α0, α1, α2, and Di (i=2, 3, 4) are coefficients to be estimated. D1 is normalized to zero for recognition.
The results of the constant-value-per-trip model are shown in Table 6.
| Table 6 Results of the constant-value-per-trip model |
All coefficients in Table 6 were significant at the 95% confidence level. Dividing the coefficients in Table 6 by α1, the values of the coefficients expressed by ticket price (RMB Yuan) were then obtained (Fig. 3). It can be concluded from Fig. 3 that the disutility of crowding of college students increased to ¥ 6.05 Yuan if the traveler has to stand in the metro carriage, even though he/she can circulate freely. The disutility of crowding of college students increased rapidly with the increasing standee density when it was larger than 4 persons/m2, and it reached ¥ 15.01 Yuan when the standee density was 7 persons/m2. But the disutility of crowding of commuters was not large (¥ 1.82 Yuan when the standee density was 1 person/m2, which was much smaller than that of college students), and it increased slightly when the standee density increased, which indicates that commuters care less about crowding in the metro carriage. Furthermore, the disutility of non-commuters was larger than that of commuters and less than that of college students.

|
Fig.3 Monetary values of crowding |
Dividing the coefficients in Eq.(1) by α0, we got the relative value expressed by IVT (Fig. 4). It can be found that the disutility of crowding of college students and that of non-commuters were the same when it was expressed by IVT. While the disutility of crowding of commuters (expressed by IVT) was much smaller, which is the same as it is expressed by monetary value. Also, the disutility of crowding increased smoothly as the standee density in the metro carriage increased when the standee density was less than 4 persons/m2, whereas it increased rapidly when the standee density was larger than 4 persons/m2.

|
Fig.4 Values of crowding expressed by IVT |
4.3 In-Vehicle Time Multiplier Model
The constant-value-per-trip model assumes that the crowding effect is irrelevant to the in-vehicle time. However, since the longer the journey is, the more uncomfortable the travel becomes[17], the travel time multiplier value model, which assumes that disutility of crowding is proportional to the in-vehicle time, seems more reasonable. Therefore, the effect of crowding in the metro carriage with the travel time multiplier value model was analyzed, and the utility can be expressed as
| $ V=α_{1}{\rm Fare}+α_{2}{\rm Wait}+ (\sum\limits^4_{i=1} γ_{i}D_{i}){\rm IVT } $ | (2) |
where the meaning of the parameters (V, Fare, Wait, IVT) is the same as that in Eq.(1). α1, α2, γi (i=1, 2, 3, 4) are the coefficients to be estimated. di (i=1, 2, 3, 4) is dummy variable. d1, d2, d3, d4 corresponds to 0, 1, 4, 7 persons/m2 of standee density, respectively. d1 equals to 1 when the standee density is 0 person/m2, and it equals to 0 when the standee density is not 0 person/m2.
The results are shown in Table 7. Dividing the coefficients γ1, γ2, γ3, and γ4 in Table 6 by α1, then multiplying with 60, the travelers' value of in-vehicle time (VOT) expressed by Yuan/hour was thus obtained as shown in Fig. 5.
| Table 7 Results of the multiplier value model |

|
Fig.5 Multiplier expressed by RMB Yuan |
It can be seen from Fig. 5 that there is a non-linear relationship between the standee density and the VOT, which is different from the studies of Cantwell et al.[22] and Whelan el al.[16], where they found a linear relationship between the multiplier and standee density. When the standee density was 0 person/m2, the VOTs of commuters, non-commuters, and college students were 13.6, 8.2, and 16.7 Yuan/h, respectively, which are rather small when travelers have seats.
As the standee density increased, the VOTs of commuters, non-commuters, and college students increased. When the standee density increased from 0 person/m2 (the traveler has a seat) to 1 person/m2 (the traveler has no seat, but can circulate freely), the VOTs of commuters, non-commuters, and college students increased by 2.2, 4.6, and 8.3 Yuan/h, respectively, which is a large increase.
When the standee density increased from 1 person/m2 to 4 persons/m2, the VOT increased slightly, when the standee density increased from 4 persons/m2 to 7 persons/m2, the VOT increased greatly, that is, the VOTs of commuters, non-commuters, and college students increased by 5.0, 8.5, and 16.5 Yuan/h, respectively.
It was also found that the VOT of college students was much larger than those of commuters and non-commuters. The VOT of commuters was slightly larger than that of non-commuters when the standee density was less than 4 persons/m2, but less when the standee density was 7 persons/m2.
In order to evaluate the effect of crowding in the metro carriage more clearly, it is necessary to analyze relative multipliers. Therefore, we chose the multiplier of college students when the standee density was 0 person/m2 as the reference, divided all multipliers of college students by the reference value, and the relative multiplier of college students was obtained. Those of the commuters and non-commuters were calculated in the same way. The relative multipliers are shown in Fig. 6.

|
Fig.6 Relative multipliers compared with reference values |
It seems that commuters do not care much about crowding in the metro carriage. The relative multiplier increased slowly as the standee density increased and reached 1.61 when the standee density was 7 persons/m2 (there is a serious physical contact and it is hard to get on or off the metro carriage in this case). That is, when the standee density was 7 persons/m2, the VOT of commuters was 1.61 times of that when the traveler has a seat.
In contrast, non-commuters and college students pay special attention to crowding in the metro carriage, especially when the metro carriage is really crowded. The relative multipliers of non-commuters and college students reached 2.94 and 2.61 when standee density was 7 persons/m2, which was much larger than that of the commuters (1.61). Therefore, when the standee density was 7 persons/m2, the VOT of non-commuters was 2.94 times more than that when the traveler has a seat, whereas the VOT of college students was 2.61 times more than that when the traveler has a seat. The result is at odds with an earlier study by Whelan et al.[16] which indicated that business travelers have a higher penalty in the crowded condition, and is different from the result of Douglas et al.[20] which concluded that the impact of trip purpose on crowding is not significant. But it is consistent with the study of Liu et al.[28] which proved that commuters pay much more attention to the in-carriage environment than non-commuters do.
5 Discussion and ConclusionsWith the data from surveys of college students and full-time workers in Guangzhou, we analyzed travelers' perception of crowding in the metro carriage with a constant value per trip model and an in-vehicle time multiplier value model. It is found that there is a non-linear relationship between the standee density in metro carriages and the disutility of crowding. The disutility increases at a modest rate as the standee density increases when the standee density is less than 4 persons/m2 and it increases faster when the standee density is larger than 4 persons/m2. The result is different from the studies of Cantwell et al.[22] and Whelan et al.[16]
The relative multipliers of non-commuters and college students are in close proximity to 3 when the standee density is 7 persons/m2, which are much larger than the results of previous studies[16, 22, 25].
Furthermore, according to the above mentioned models, there are significant differences in preferences for crowding in metro carriages among commuters, non-commuters, and college students. Crowding in metro carriages has a greater impact on non-commuters and college students than on commuters. The result is different from those in Refs. [16, 20] and is the same as that in Ref. [28]. Practitioners usually focus on factors such as travel time and cost, but overlook or undervalue the impact of service quality (e.g., convenience, crowding). The results of this paper indicate that it is essential to take into account the impact of crowding in metro carriages.
This paper analyzes the impact of travel purpose on travelers' evaluation of crowding in the metro carriage and divides full-time workers into two groups (commuters and non-commuters). However, we failed to analyze the impact of monthly income because respondents were unwilling to reveal such information, so I'd like to take into account the impact of income as the future extension of this study. Besides, the difference between the disutility of crowding of commuters and that of non-commuters may be caused by the fixed arrival time of most of the commuters. Therefore, it is necessary to divide the commuters into two subgroups (commuters with fixed work starting time and commuters with flexible work starting time).
Moreover, it can be concluded from Fig. 3 and Fig. 5 that the disutility of crowding of college students expressed by monetary value is much larger than that of commuters and non-commuters, which cannot be explained so far. Are college students more averse to in-carriage crowding than full-time workers? Do the photographs of crowding make density less of a problem than just having verbal descriptions? It presents a problem: does a different description of crowding lead to different evaluations. Therefore, it is necessary to evaluate and verify the linguistic notion method, the bird-eye-view method, and the photography presentation method in future studies.
Appendices Appendix Ⅰ Example of SP question in the formal investigation for college students
|
|
| Table |
| [1] |
Tirachini A, Hensher D A, Rose J M. Crowding in public transport systems: Effects on users, operation and implications for the estimation of demand. Transportation Research Part A: Policy and Practice, 2013, 53: 36-52. DOI:10.1016/j.tra.2013.06.005 (  0) 0) |
| [2] |
Milkovits M N. Modeling the factors affecting bus stop dwell time: Use of automatic passenger counting, automatic fare counting, and automatic vehicle location data. Transportation Research Record: Journal of the Transportation Research Board, 2008, 2072(1): 125-130. DOI:10.3141/2072-13 ( 0) |
| [3] |
Katz D, Garrow L A. The impact of bus door crowding on operations and safety. Journal of Public Transportation, 2012, 15(2): 71-93. DOI:10.5038/2375-0901.15.2.4 ( 0) |
| [4] |
Fletcher G, El-Geneidy A. Effects of fare payment types and crowding on dwell time: Fine-grained analysis. Transportation Research Record: Journal of the Transportation Research Board, 2013, 2351(1): 124-132. DOI:10.3141/2351-14 ( 0) |
| [5] |
Currie G, Delbosc A, Harrison S, et al. Impact of crowding on streetcar dwell time. Transportation Research Record: Journal of the Transportation Research Board, 2013, 2353(1): 100-106. DOI:10.3141/2353-10 ( 0) |
| [6] |
O'Regan B, Buckley F. The psychological effects of commuting in Dublin. Centre for Research in Management Learning and Development Working Paper Series, Dublin: Dublin City University, 2003.
( 0) |
| [7] |
Evans G W, Wener R E. Crowding and personal space invasion on the train: Please don't make me sit in the middle. Journal of Environmental Psychology, 2007, 27(1): 90-94. DOI:10.1016/j.jenvp.2006.10.002 ( 0) |
| [8] |
Basu D, Hunt J D. Valuing of attributes influencing the attractiveness of suburban train service in Mumbai city: A stated preference approach. Transportation Research Part A: Policy and Practice, 2012, 46(9): 1465-1476. DOI:10.1016/j.tra.2012.05.010 ( 0) |
| [9] |
Jiang S, Sun Y, Du Y. Infuence of in-vehicle congestion degree on choice of public transit mode. Journal of Tongji University (Natural Science), 2012, 40(12): 1831-1835. DOI:10.3969/j.issn.0253-374x.2012.12.015 ( 0) |
| [10] |
Li Z, Hensher D A. Crowding in public transport: A review of objective and subjective measures. Journal of Public Transportation, 2013, 16(2): 107-134. DOI:10.5038/2375-0901.16.2.6 ( 0) |
| [11] |
Diec J, Coxon S, de Bono A. Designing a public train station shelter to minimise anti-social behaviour and crime in Melbourne's metropolitan rail environment. Proceedings of 2010 ATRF: 33rd Australasian Transport Research Forum. Canberra, ACT: Transport and Regional Economics, Bureau of Infrastructure, 2010. 1-17. https://www.researchgate.net/publication/228955738_Designing_a_public_train_station_shelter_to_minimise_anti-social_behaviour_and_crime_in_Melbourne's_metropolitan_rail_environment
( 0) |
| [12] |
Furth P G, Hemily B, Muller T H J, et al. Using archived AVL-APC data to improve transit performance and management. National Academices of Sciences, Engineering, and Medicine. Washington, D.C.: The National Academies Press, 2006. 1-6. DOI: 10.17226/13907.
( 0) |
| [13] |
Das S, Pandit D. Importance of user perception in evaluating level of service for bus transit for a developing country like India: A review. Transport Reviews, 2013, 33(4): 402-420. DOI:10.1080/01441647.2013.789571 ( 0) |
| [14] |
Cheng Y H, Chen S Y. Perceived accessibility, mobility, and connectivity of public transportation systems. Transportation Research Part A: Policy and Practice, 2015, 77(7): 386-403. DOI:10.1016/j.tra.2015.05.003 ( 0) |
| [15] |
Hensher D A, Rose J M, Collins A T. Identifying commuter preferences for existing modes and a proposed Metro in Sydney, Australia with special reference to crowding. Public Transport, 2011, 3(2): 109-147. DOI:10.1007/s12469-010-0035-4 ( 0) |
| [16] |
Whelan G, Crockett J. An investigation of the willingness to pay to reduce rail overcrowding. Proceedings of The First International Conference on Choice Modelling. Berlin: Springer, 2009. 1-16. https://www.researchgate.net/publication/264967575_An_investigation_of_the_willingness_to_pay_to_reduce_rail_overcrowding
( 0) |
| [17] |
Kroes E, Kouwenhoven M, Debrincat L, et al. On the value of crowding in public transport for Ile-de-France. Proceedings of International Transport Forum Discussion Papers. Paris: OECD Publishing, 2013. 1-37. DOI: 10.1787/5k3z04fx2zq7-en.
( 0) |
| [18] |
Prud'Homme R, Koning M, Lenormand L, et al. Public transport congestion costs: The case of the Paris subway. Transport Policy, 2012, 21: 101-109. DOI:10.1016/j.tranpol.2011.11.002 ( 0) |
| [19] |
Qin F. Investigating the in-vehicle crowding cost functions for public transit modes. Mathematical Problems in Engineering, 2014, 2014: 1-13. DOI:10.1155/2014/502708 ( 0) |
| [20] |
Douglas N, Karpouzis G. Estimating the passenger cost of train overcrowding. Proceedings of 29th Australian Transport Research Forum. Gold Coas, 2006. https://www.researchgate.net/publication/264967495_Estimating_the_passenger_cost_of_train_overcrowding
( 0) |
| [21] |
Lu H, Fowkes T, Wardman M. Amending the incentive for strategic bias in stated preference studies case study in users' valuation of rolling stock. Transportation Research Record: Journal of the Transportation Research Board, 2008, 2049(1): 128-135. DOI:10.3141/2049-15 ( 0) |
| [22] |
Cantwell M, Caulfield B, O'Mahony M. Examining the factors that impact public transport commuting satisfaction. Journal of Public Transportation, 2009, 12(2): 1-21. DOI:10.5038/2375-0901.12.2.1 ( 0) |
| [23] |
Ryus P, Danaher A, Walker M, et al. Quality of service concepts. Transit Capacity and Quality of Service Mannual, Third Edition. Transportation Research Board. Washington, D.C.: The National Academies Press, 2013. 141-190. DOI: 10.17226/24766.
( 0) |
| [24] |
Kroes E, Kouwenhoven M, Debrincat L, et al. The value of crowding for public transport in the Paris region. European Transport Conference, Frankfurt, 2013, 1-23. ( 0) |
| [25] |
Haywood L, Koning M. Pushy Parisian elbows: Evidence on taste for travel comfort. Proceedings of ERSA Conference Papers. Paris: European Regional Science Assosiation, 2011. 1-41.
( 0) |
| [26] |
Haywood L, Koning M. Estimating crowding costs in public transport. D|W Berlin Discussion Paper. 2013, 1293: 1-41. DOI: 10.2139/ssrn.2256332
( 0) |
| [27] |
Bradley M, Daly A. Use of the logit scaling approach to test for rank-order and fatigue effects in stated preference data. Transportation, 1994, 21(2): 167-184. DOI:10.1007/bf01098791 ( 0) |
| [28] |
Liu J, Guo T. Utility and weight of factors of bus transit's service quality analysis in Nanjing. Journal of Harbin Institute of Technology (New Series), 2015, 22(3): 115-122. DOI:10.11916/j.issn.1005-9113.2015.03.017 ( 0) |