With the rapid development of mobile computing, the wireless communication network brings a strong impetus for personal positioning applications. In this circumstance, the Location-based Service (LBS)[1] has caught extensive attention. At present, the Global Navigation Satellite System (GNSS)[2] can basically meet the demand of outdoor positioning accuracy, whereas the signal from the satellites is easily blocked by the buildings, which will consequently deteriorate the positioning accuracy of the GNSS. However, there is no such problem for Bluetooth[3], Wireless Local Area Network (WLAN)[4-5], Ultra Wideband (UWB)[6], Radio Frequency Identification (RFID)[7], and magnetic[8] positioning technologies, which are much applicable to indoor environments.
The Bluetooth positioning technology is featured with the characteristics of low-power, low-cost, and high positioning accuracy. Among the existing Bluetooth positioning approaches, fingerprint-based Bluetooth positioning approach[9] is the most favored because of its low computational complexity, no extra hardware requirement, and strong environmental adaptability. However, this approach normally requires laborious and time-consuming manual process of collecting fingerprints with position labels[10-11] to construct and update fingerprint database. What is more difficult to accept is that this manual process needs to be repeated whenever the fingerprint database becomes outdated[12] due to the environmental change.
To overcome this limitation, this paper proposes a new fingerprint database updating approach, which enables users to participate in the process of fingerprint database construction and updating with low labor and time costs. Three main contributions of this paper are summarized as follows. First, the Bluetooth and Micro-Electro-Mechanical System (MEMS) fusion positioning algorithm was designed to assign the unlabeled Received Signal Strength (RSS) data with position labels and generate candidate fingerprints. This approach is based on the advantages of Bluetooth module and MEMS sensors to eliminate the accumulated error of the Pedestrian Dead Reckoning (PDR) and the jump error of the fingerprint-based Bluetooth positioning respectively. Second, by considering the error of the Bluetooth and MEMS fusion positioning algorithm which may lead to the mismatch between the candidate fingerprints and the reference points (RPs), the Density-based Spatial Clustering of Applications with Noise (DBSCAN) approach was conducted on both the original and the candidate fingerprints to filter out the fingerprints which had been identified as the noise, and then the mean of fingerprints in the cluster with the largest data volume (or simply called the largest cluster) at each RP was selected to update fingerprint database. Third, the effectiveness and efficiency of the proposed approach were verified by using our own-designed hardware platform in an actual indoor environment.
The rest of this paper is organized as follows. Section 2 reviews some related work on fingerprint database construction and updating in indoor positioning. Section 3 describes the proposed approach in detail, and the corresponding experimental results are illustrated in Section 4. Finally, Section 5 concludes the paper and provides some future research directions.
2 Related WorkTo maintain the performance of fingerprint-based positioning, the fingerprint database construction and updating process has caught significant attention. The authors in Ref. [13] proposed a new fingerprint database updating approach, OIL, which provides an interactive interface for users to actively participate in updating fingerprints. In this approach, almost no manual effort is involved in the fingerprint database updating process, whereas the users have to be frequently bothered when they first start the system, which increases the burden of the users. Luo et al.[14] proposed a voting mechanism and a fingerprint database update method. The mutual cooperation between reference anchor nodes was used to update the fingerprint database, which can reduce the burden of the users.
To avoid the subjective error caused by user participation, many approaches utilize the data from the MEMS sensors embedded in smartphones and the topological structure of the target area to physically label the unlabeled RSS data. Most of the existing popular systems such as Zee[15], UnLoc[16], WILL[17], and LiFS[18] depend on the MEMS sensors to update fingerprint database. Although these systems are capable of updating the fingerprint database to some extent, many problems arise due to the imperfection of MEMS sensors. For example, the error of MEMS sensors results in the accumulated error of the PDR and leads to the deterioration of positioning accuracy. To avoid such problem, researchers[19-20] installed a smartphone on robots for collecting fingerprints by Simultaneous Localization and Mapping (SLAM) technology.
Many other approaches adopt the concept of semi-supervised learning[21-22] to update the fingerprint database based on a small amount of labeled RSS data. Most of them depend on specific optimization algorithms (such as manifold learning[23] and interpolation[24]) to estimate the position labels of the unlabeled RSS data. For example, the approach in Ref. [25] is dependent on the dimensionality reduction migration learning, which uses the manifold alignment to estimate the position labels of the crowdsourced unlabeled RSS data with low effort. However, the performance of these approaches is determined by the initial model which is constructed from a few labeled RSS data, and therefore it could be poor when the labeled RSS data are not enough or ineffective. To solve this problem, Jung and Han[26] proposed to use the concept of unsupervised learning to update the fingerprint database by considering the hidden internal relations between the unlabeled RSS data. Researchers in Ref. [27] adopted active learning scheme with uncertainty selective sampling algorithm to maximize cost-efficiency of the update phase.
Different from the approaches above, this paper uses the Bluetooth and MEMS fusion positioning algorithm to assign the unlabeled RSS data with position labels instead of using the MEMS sensors solely. In addition, as one of the most representative unsupervised learning algorithms, the DBSCAN approach is applied without constructing any specific initial model to filter out the fingerprints which have been identified as the noise, and then the mean of fingerprints is used in the largest cluster at each RP to update the fingerprint database.
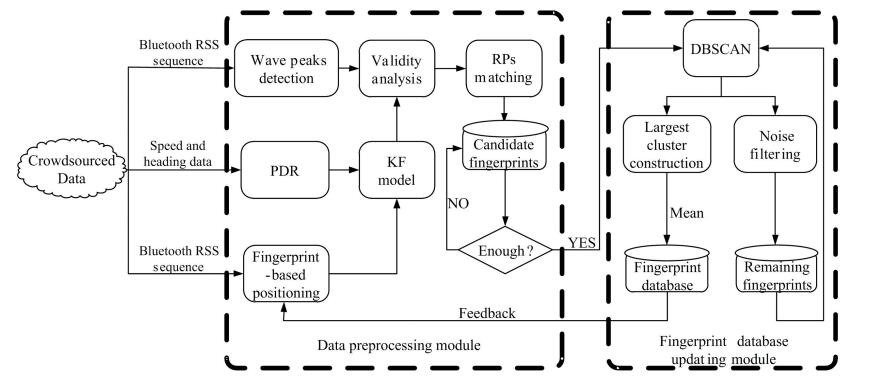
3 System Description 3.1 System FrameworkThe overall system structure consists of two main modules (i.e., data preprocessing module and database updating module), as shown in Fig. 1. First of all, the crowdsourced data including the Bluetooth RSS sequences and the speed and heading data from the MEMS sensors are forwarded to the server. Second, the wave peaks which are discriminated from the RSS sequences are combined with the result of the Kalman Filtering (KF) to perform the trajectory validity analysis. Then, the candidate fingerprints are generated by assigning the position labels to the unlabeled RSS data from the result of RPs matching. Finally, with enough candidate fingerprints obtained, both the original and the candidate fingerprints at each RP are clustered by the DBSCAN approach, and the mean of the fingerprints in the largest cluster is selected as the updated fingerprint of the corresponding RP. In addition, the remaining fingerprints after noise filtering are set as the new original fingerprints for the next clustering.
|
Fig.1 System structure |
3.2 KF Model
The PDR is a popular algorithm using the 9-axis MEMS sensor data to estimate the positions of a pedestrian[28]. Since most of the commercial smartphones are equipped with low-cost MEMS sensors, the speed and heading data from the MEMS sensors are normally affected by the accumulated error over time, which may lead to the deviation of the estimated positions gradually from the real ones. The fingerprint-based positioning algorithms[29] (e.g., Weighted K-nearest Neighbor (WKNN)) are independent of the accumulated error because each positioning result is determined by the matching between the current RSS data and the pre-constructed fingerprint database. Therefore, we utilized the KF model[30] to fuse the results of the PDR and the fingerprint-based positioning to improve the accuracy of the unlabeled candidate fingerprints labeling.
The KF model is known as a state estimation approach with minimum variance. Specifically, it is based on the state transition equation to combine the state estimation at the previous moment and the observation result at the current moment to infer the new state value, as expressed in Eqs. (1) and (2). This approach has the advantage of no need for storing a large amount of data.
| $ {{\mathit{\boldsymbol{x}}_{t + 1}} = \mathit{\boldsymbol{F}}{\mathit{\boldsymbol{x}}_t} + {\mathit{\boldsymbol{\omega }}_t}} $ | (1) |
| $ {{\mathit{\boldsymbol{y}}_t} = \mathit{\boldsymbol{H}}{\mathit{\boldsymbol{x}}_t} + {\mathit{\boldsymbol{v}}_t}} $ | (2) |
where xt and yt are the state and observed variables at the moment t. ωt and vt are the process and observation noise, and the corresponding covariance matrices are notated as Q and R respectively. F and H are the state transition and observation matrices. Based on the KF model, the optimal estimation process is described in Eqs. (3)-(7).
| $ {\mathit{\boldsymbol{P}}_{t + 1}^ - = \mathit{\boldsymbol{FP}}_t^ + {\mathit{\boldsymbol{F}}^{\rm{T}}} + \mathit{\boldsymbol{Q}}} $ | (3) |
| $ {{\mathit{\boldsymbol{K}}_{t + 1}} = \mathit{\boldsymbol{P}}_{t + 1}^ - {\mathit{\boldsymbol{H}}^{\rm{T}}}{{(\mathit{\boldsymbol{HP}}_{t + 1}^ - {\mathit{\boldsymbol{H}}^{\rm{T}}} + \mathit{\boldsymbol{R}})}^{ - 1}}} $ | (4) |
| $ {\mathit{\boldsymbol{\hat x}}_{t + 1}^ - = \mathit{\boldsymbol{F\hat x}}_t^ + } $ | (5) |
| $ {\mathit{\boldsymbol{\hat x}}_{t + 1}^ + = \mathit{\boldsymbol{\hat x}}_{t + 1}^ - + {\mathit{\boldsymbol{K}}_{t + 1}}({\mathit{\boldsymbol{y}}_{t + 1}} - \mathit{\boldsymbol{H\hat x}}_{t + 1}^ - )} $ | (6) |
| $ {\mathit{\boldsymbol{P}}_{t + 1}^ + = (\mathit{\boldsymbol{I}} - {\mathit{\boldsymbol{K}}_{t + 1}}\mathit{\boldsymbol{H}})\mathit{\boldsymbol{P}}_{t + 1}^ - } $ | (7) |
where I is the identity matrix,
| $ {\mathit{\boldsymbol{\hat x}}_0^ + = \mathit{\boldsymbol{E}}({\mathit{\boldsymbol{x}}_0})} $ | (8) |
| $ {\mathit{\boldsymbol{P}}_0^ + = \mathit{\boldsymbol{E}}[({\mathit{\boldsymbol{x}}_0} - \mathit{\boldsymbol{\hat x}}_0^ + ){{({\mathit{\boldsymbol{x}}_0} - \mathit{\boldsymbol{\hat x}}_0^ + )}^{\rm{T}}}]} $ | (9) |
where the notation E(·) represents the expectation operation.
To build the KF model, we first employed the PDR to construct the state transition equation as
| $ {\mathit{\boldsymbol{X}}_t} = \left[ {\begin{array}{*{20}{l}} {{x_t}}\\ {{y_t}}\\ {{v_t}}\\ {{\theta _t}} \end{array}} \right] = \left[ {\begin{array}{*{20}{c}} 1&0&{{\rm{sin}}({\theta _{t - 1}})}&0\\ 0&1&{{\rm{cos}}({\theta _{t - 1}})}&0\\ 0&0&1&0\\ 0&0&0&1 \end{array}} \right] \times \left[ {\begin{array}{*{20}{l}} {{x_{t - 1}}}\\ {{y_{t - 1}}}\\ {{v_{t - 1}}}\\ {{\theta _{t - 1}}} \end{array}} \right] + {\mathit{\boldsymbol{W}}_{t - 1}} $ | (10) |
where xt and yt are the estimated horizontal and vertical coordinates of the pedestrian at the moment t, vt and θt are the speed and heading of the pedestrian at the moment t, and Wt-1 is the state noise at the moment t-1, which is assumed to be the Gaussian white noise with the mean 0 and variance E[WiWjT] = Q(i, j)δij, where i, j=1, …, n, n is the number of PDR results, Q(i, j) is the covariance matrix of Wt-1, and δij is the Kronecker function defined as
| $ {\delta _{ij}} = \left\{ {\begin{array}{*{20}{l}} {0,{\rm{ if}}{\kern 1pt} {\kern 1pt} {\kern 1pt} i \ne j}\\ {1,{\rm{ otherwise }}} \end{array}} \right. $ | (11) |
Then, by taking the fingerprint-based positioning result as well as the speed and heading data from the MEMS sensors as the observations, the observation equation is constructed as
| $ {\mathit{\boldsymbol{Z}}_t} = \left[ {\begin{array}{*{20}{c}} {x_t^{\rm{B}}}\\ {y_t^{\rm{B}}}\\ {v_t^{\rm{M}}}\\ {\theta _t^{\rm{M}}} \end{array}} \right] = \left[ {\begin{array}{*{20}{l}} 1&0&0&0\\ 0&1&0&0\\ 0&0&1&0\\ 0&0&0&1 \end{array}} \right] \times \left[ {\begin{array}{*{20}{l}} {{x_t}}\\ {{y_t}}\\ {{v_t}}\\ {{\theta _t}} \end{array}} \right] + {\mathit{\boldsymbol{V}}_t} $ | (12) |
where xtB and ytB are the horizontal and vertical coordinates of the fingerprint-based positioning result at the moment t, vtM and θtM are the speed and heading data from MEMS data at the moment t, and Vt is the observation noise at the moment t, which is also assumed as the Gaussian white noise with the mean 0 and variance E[ViTVj]=R(i, j)δij(i, j=1, …, n), where n is the number of observation variables and R is the covariance matrix of Vt.
When the fingerprint database has large deviations, there will be a large jump error in Bluetooth positioning at some RPs. At this time, the predicted position (xt, yt) at time t can be obtained according to the system state equation in the KF model, and the position (xtB, ytB) at the time t can be obtained by the Bluetooth positioning. Meanwhile, the Euclidean distance D of the two positions can also be obtained. If D is greater than a certain threshold (i.e., 7 m in the system), it can be determined that the Bluetooth positioning error is too large at the location, and the predicted location (xt, yt) is directly used as the position label of the current RSS without Kalman fusion.
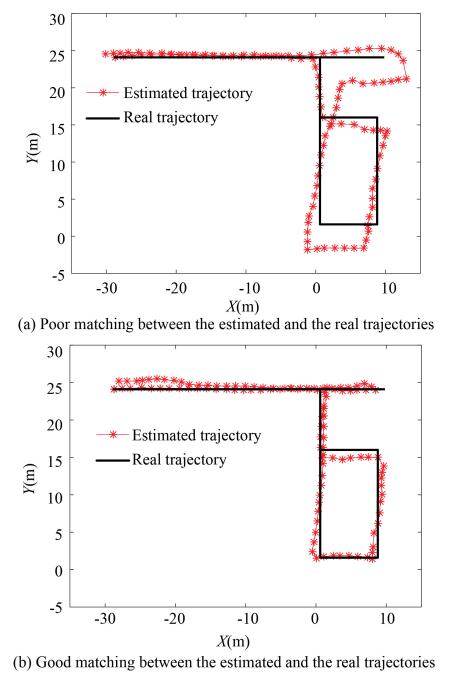
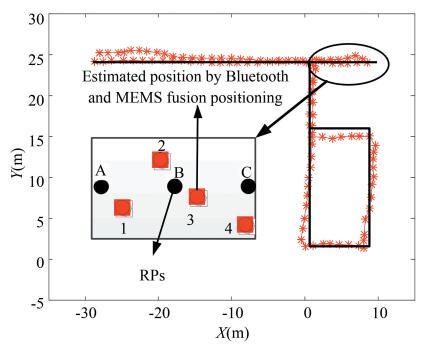
3.3 Trajectory Validity AnalysisDue to the excessive jump errors in the Bluetooth and MEMS positioning results, the performance of Bluetooth and MEMS fusion positioning algorithm is not always satisfactory. Figs. 2(a) and 2(b) provide two examples of the results of Bluetooth and MEMS fusion positioning. It can be concluded that if the poor matching between the estimated and the real trajectories occurs, the position labels cannot be precisely assigned to the real associated unlabeled RSS data, which will consequently deteriorate the performance of the fingerprint database. To address this problem and to guarantee the effectiveness of the physical labeling process, we conducted the trajectory validity analysis to eliminate the estimated positions which deviate a lot from the real ones.
|
Fig.2 Result of Bluetooth and MEMS fusion positioning |
Therefore, the propagation model with respect to the Bluetooth signal is constructed as
| $ {\rm{RSS}} = - 10n{\rm{log}}d - A $ | (13) |
where A is the RSS value at the location with 1 m from the anchor, d is the distance from the anchor to the target, RSS is the RSS value at the target location, and n is the path loss exponent which is estimated from the labeled RSS data. On the basis of the signal propagation property in Eq. (13), we proposed an approach to judge whether a newly-collected piece of RSS data can be used to update the fingerprint database.
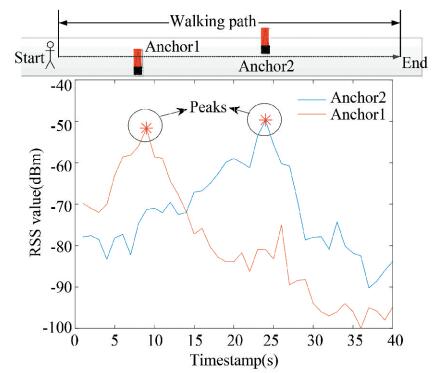
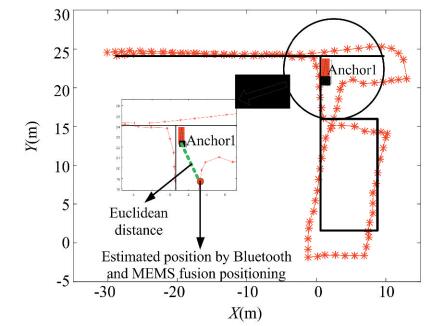
An example of the RSS variation from two different anchors in an actual straight corridor environment is shown in Fig. 3, from which we can find that there was a peak of the RSS values (defined as a local maximum of RSS values larger than -55 dBm) when the pedestrian is passed by an anchor. Based on this, we recorded each moment at which a peak appeared and selected the position of the corresponding anchor as the real position of the pedestrian at this moment. Then, we calculated the Euclidean distance between the real and the estimated positions by the Bluetooth and MEMS fusion positioning, according to which we judged whether this newly-collected piece of RSS data can be used for fingerprint database updating. For example, as shown in Fig. 4, if the peak of RSS values from Anchor1 is obtained at the moment t, the location of Anchor1 is selected as the real position of the pedestrian (xAP, yAP) at this moment. When the distance between (xAP, yAP) and the estimated position (xfusion, yfusion) is not larger than the threshold distancemax, the RSS data can be used to update the fingerprint database. Here, the threshold distancemax is set to be twice of RP interval in our system.
|
Fig.3 An example of RSS variation from two different anchors |
|
Fig.4 Trajectory validity analysis |
3.4 Position Labels Assignment
After the trajectory validity analysis, the coordinate of the RP with the smallest distance to the estimated position of the pedestrian (or the matched RP), (xRF, yRF), was selected as the physical label of the corresponding unlabeled RSS data to generate a candidate fingerprint as follows
| $ \mathop {{\rm{ argmin }}}\limits_{{x_{{\rm{RF}}}},{y_{{\rm{RF}}}}} (\sqrt {{{({x_{{\rm{ fusion }}}} - {x_{{\rm{RF}}}})}^2} + {{({y_{{\rm{ fusion }}}} - {y_{{\rm{RF}}}})}^2}} ) $ | (14) |
where (xRF, yRF) and (x, y) are the coordinates of RPs and the estimated positions. To illustrate this process clearer, Fig. 5 shows an example of three RPs (A, B, and C) with four estimated positions (1, 2, 3, and 4) at the moments t1, t2, t3, and t4. The RSS sequence corresponding to each estimated position is notated as (RSSt1, RSSt2, …, RSStn), where t=t1, t2, t3, and t4, and n is the number of RSS data used for each position estimation. Without losing generality, we assumed that the number of RSS data used for each position estimation is the same. In this case, we matched the estimated positions 1 into A, 2 and 3 into B, and 4 into C by taking B as an example. The corresponding candidate fingerprints are described as
|
Fig.5 RPs matching |
| $ {\rm{Fingerprin}}{{\rm{t}}_B} = \left\{ {\begin{array}{*{20}{l}} {({\rm{RSS}}_{{t_2}}^1, \cdots ,{\rm{RSS}}_{{t_2}}^n)({x_B},{y_B})}\\ {({\rm{RSS}}_{{t_3}}^1, \cdots ,{\rm{RSS}}_{{t_3}}^n)({x_B},{y_B})} \end{array}} \right. $ | (15) |
Fig. 6 shows the architecture diagram from the input crowdsourced data to candidate fingerprints generation. When a sufficient amount of crowdsourced data is collected, enough candidate fingerprints can be obtained at each RP for the next fingerprint database updating.
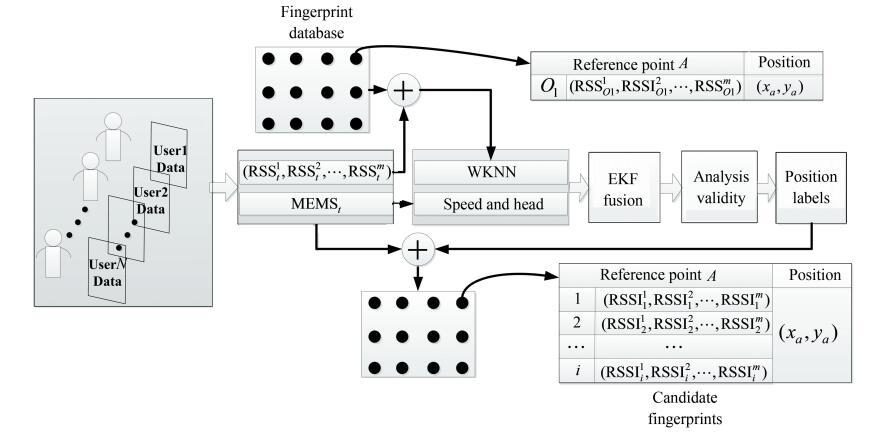
|
Fig.6 Candidate fingerprints generation |
3.5 Fingerprint Database Updating
With enough candidate fingerprints obtained, the fingerprint database updating can be started by conducting the DBSCAN approach[31] on both the original and the candidate fingerprints.
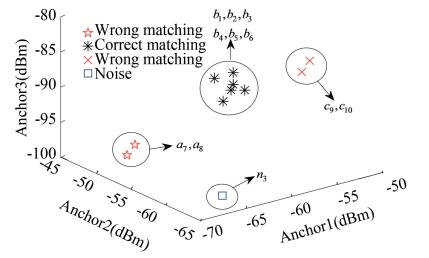
3.5.1 DBSCANThe trajectory validity analysis helps much to filter out the pedestrian trajectories which deviate a lot from the real ones, but the error of the estimated positions leads to the bias of assigning position labels to candidate fingerprints and results in the wrong matching of candidate fingerprints to the RPs which they do not actually belong to. Besides, the RSS data at each RP involve the noise more or less due to the instability of devices and the interference during the data acquisition. Figs. 7-10 show an example of considering only three RPs (A, B, and C) and the corresponding matching results in both physical and signal spaces. Here, ai, bi, and ci stand for the fingerprints which belong to A, B, and C, and ni is the noise. By taking A as an example, b8, b9, b10 and c7 were wrongly matched to A.
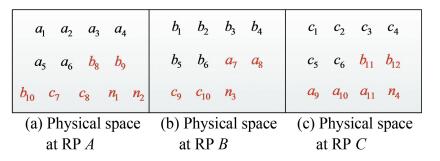
|
Fig.7 Candidate fingerprints belonging to each RP |
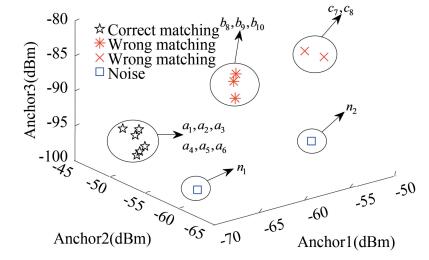
|
Fig.8 Signal space at RP A |
|
Fig.9 Signal space at RP B |

|
Fig.10 Signal space at RP C |
In order to choose the appropriate clustering approach to increase the probability of correct matching with respect to candidate fingerprints, we illustrate the two main properties of the candidate fingerprints at each RP as follows:
1) The candidate fingerprints at each RP normally involve a small amount of wrongly-matched fingerprints and noises, which should be filtered out during the fingerprint database updating.
2) With the accumulation of crowdsourced data, the number of the candidate fingerprints at each RP increases, which results in the difficulty of choosing the appropriate number of clusters for candidate fingerprints.
By considering the properties of the candidate fingerprints above, the DBSCAN approach is appropriate for the candidate fingerprints clustering because it can filter out the noise and generate the clusters automatically based on the density of the candidate fingerprints without manually setting the number of clusters in advance. By taking A as an example, it was difficult to discriminate the wrongly-matched fingerprints and filter out the noise in physical space, but they deviated a lot from the candidate fingerprints which actually belong to A, as shown in Figs. 8-10. Based on this, we conducted the DBSCAN approach on candidate fingerprints in signal space, and selected the mean of fingerprints in the largest cluster to update the fingerprint database.
To facilitate the interpretation of conducting the DBSCAN approach on candidate fingerprints, we constructed the set of candidate fingerprints at each RP as
| $ {\rm{CandidateFingerprints}} = \{ {f_1}, \cdots {f_i}, \cdots ,{f_m}\} $ | (16) |
where fi is the i-th candidate fingerprint. Then define the terms used in the DBSCAN approach as
1) ε-neighborhood: For each candidate fingerprint fi∈CandidateFingerprints, its ε-neighborhood, Nε(fi), consists of the candidate fingerprints with the distance from fi not larger than ε, which is expressed as
| $ N({f_i}) = \{ {f_j} \in {\rm{CandidateFingerprints }}| {\rm{dist}} ({f_i},{f_j}) \le \varepsilon \} $ | (17) |
where dist(fi, fj) indicates the Euclidean distance between fi and fj.
2) Core candidate fingerprint: If the ε-neighborhood of fi contains at least MinFts candidate fingerprints (i.e., |Nε(fi)|≥MinFts), where |Nε(fi)| is the number of elements in Nε(fi), then fi is a core candidate fingerprint.
3) Directly density-reachable: If fj is a core candidate fingerprint and fj is in the ε-neighborhood of fi, fj is directly density-reachable from fi.
4) Density-reachable: For fi and fj, if there is a sequence {p1, p2, …, pn} satisfying the relations that p1=fi, pn=fj, and pi+1 is directly density-reachable from pi, then fj is density-reachable to fi.
5) Density-connected: For fi and fj, if there is fk from which both fi and fj are density-reachable, fi is density-connected with fj.
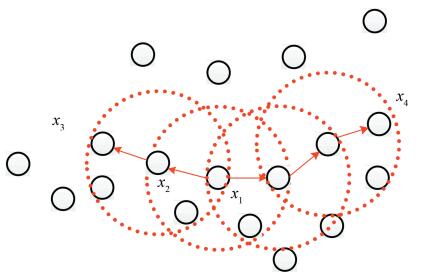
Fig. 11 shows an example to illustrate the terms defined above, where ε=3, ε-neighborhood is represented as the dotted red circle, and x1 is a core candidate fingerprint. It was found that x2 was directly density-reachable from x1 and x3, and density-connected with x4.
|
Fig.11 Illustration of the terms used in the DBSCAN |
As we know, the aim of the DBSCAN approach is to generate the cluster containing the largest number of candidate fingerprints which are directly density-reachable or density-reachable between each other. From the pseudo-code of the DBSCAN approach in Table 1, it can be seen that from lines 3 to 12, if the relations of |Nε(fi)|≥MinFts for each candidate fingerprint fi is satisfied, then fi is determined as a core candidate fingerprint, otherwise it is determined as the noise. From lines 17 to 27, the cluster containing only core candidate fingerprints is expanded by adding the associated density-connected candidate fingerprints. Finally, from lines 15 to 16, the cluster CReal containing the largest number of candidate fingerprints is selected as the output of the DBSCAN approach.
| Table 1 Pseudo-code of the DBSCAN approach |
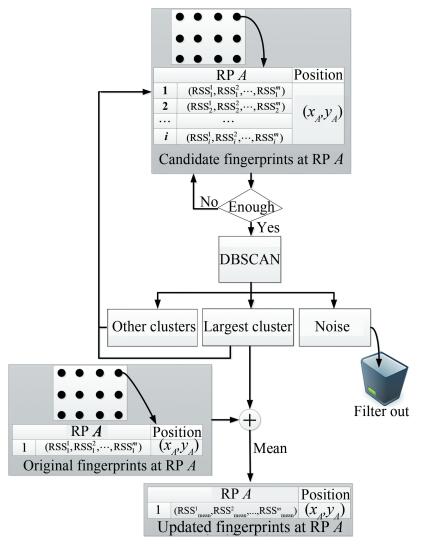
Fig. 12 shows the architecture diagram of the DBSCAN conducted on both the original and the candidate fingerprints at each RP, in which the fingerprints which have been identified as the noise are filtered out, and the mean of fingerprints in the largest cluster to update the fingerprint database is selected.
|
Fig.12 Fingerprint database updating at each RP |
3.5.2 Parameters optimization
Based on the discussion above, the performance of the DBSCAN approach significantly depends on the parameters ε and MinFts. During the testing, if the value ε is appropriately selected, the value |Nε(fi)| for different candidate fingerprints is much different, otherwise the value |Nε(fi)| tends to be the same. For example, when the value ε is too small, the value |Nε(fi)| approaches 1, while when the value ε is too large, the value |Nε(fi)| approaches n, where n is the number of candidate fingerprints. Hence, we utilized the information entropy[32] to convert the parameter ε optimization problem into the problem of minimizing the information entropy in Eq.(18). To solve this problem, we used the simulated annealing approach[33] to obtain the optimal value ε corresponding to the minimal information entropy. Here, we set the optimal value MinFts equal to the mean of |Nε(fi)| under the optimal value ε.
| $ \left\{ {\begin{array}{*{20}{l}} {p({f_i}) = \frac{{|{N_\varepsilon }({f_i})|}}{{\sum\limits_{j = 1}^n | {N_\varepsilon }({f_i})|}}}\\ {H(X) = \sum\limits_{j = 1}^n p ({f_i}){\rm{lo}}{{\rm{g}}_2}\frac{1}{{p({f_i})}}} \end{array}} \right. $ | (18) |
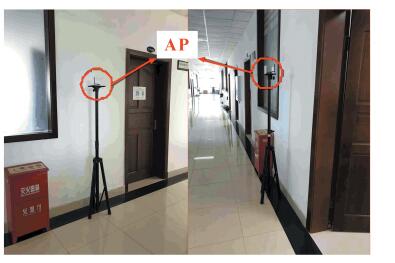
Fig. 13 shows the target environment (with the dimension of 65 m by 17 m), in which there is a hall and a straight corridor. In this figure, the red triangles and the black dots stand for the locations of anchors and RPs respectively. A photo of the target environment is shown in Fig. 14.

|
Fig.13 Topological structure of the target environment |
|
Fig.14 Photo of the target environment |
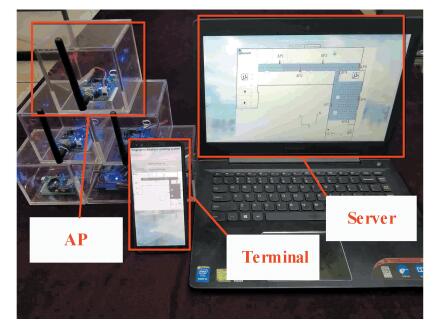
Fig. 15 shows the hardware platform, which involves a smartphone terminal used for data acquisition, a Java-based data processing server, and several Bluetooth anchors based on TI's CC2540 chip. The platform was utilized to collect the Bluetooth RSS data and the data from the magnetometer, gyroscope, and accelerometer simultaneously.
|
Fig.15 Hardware platform |
4.2 Result of DBSCAN
Fig. 16 shows an example of the clustering result of the candidate fingerprints at a RP by the DBSCAN approach. In this figure, the horizontal and vertical axes stand for the anchor ID and RSS value respectively, and each candidate fingerprint is represented as a polyline, where the black polylines are the noise and the blue, red, and green ones stand for the candidate fingerprints belonging to clusters 1, 2, and 3, respectively. Since cluster 1 contains the largest number of candidate fingerprints, the mean of the candidate fingerprints in this cluster was used to update the fingerprint at this RP.

|
Fig.16 Clustering result of candidate fingerprints at a RP |
4.3 Results of Fingerprint Database Updating
Because of the large area of the experimental environment, a lot of data needed to be collected to update the fingerprint database. Therefore, the tester walked around the positioning area for about 3 h a day and collected data to update the fingerprint database. The experiment was carried out for five days, and the data collected in the first three days effectively improved the positioning accuracy. While the data collected on the fourth and fifth days basically had no effect on the improvement of the positioning accuracy. Therefore, we mainly display and analyze the positioning results of the first three fingerprint database updating.
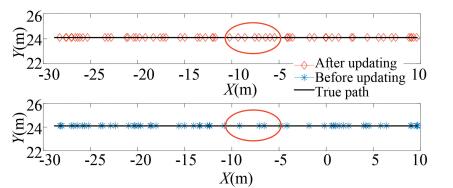
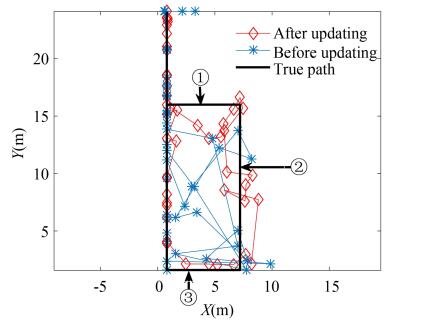
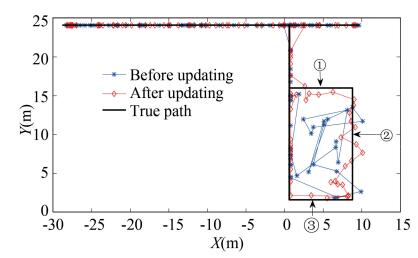
To investigate the performance of the proposed fingerprint database updating approach, three paths in the target environment were selected for the testing. The results of Bluetooth positioning on these paths are shown in Figs. 17-19, in which the black, blue, and red polylines stand for the real path and the paths estimated by the Bluetooth positioning before and after fingerprint database updating, respectively. By taking a length of the straight path circled in red in Fig. 17 as an example, the estimated positions after the fingerprint database updating were more in accordance with the motion behavior of the pedestrian since they were more evenly distributed compared with those before the fingerprint database updating. In addition, we took the line segments labeled with ①, ②, and ③ in Fig. 18 and Fig. 19 as another example. It was found that after the fingerprint database updating, the distribution of the estimated positions changed from disorder to order, which further verified the effectiveness of the proposed fingerprint database updating approach.
|
Fig.17 Bluetooth positioning on path 1 |
|
Fig.18 Bluetooth positioning on path 2 |
|
Fig.19 Bluetooth positioning on path 3 |
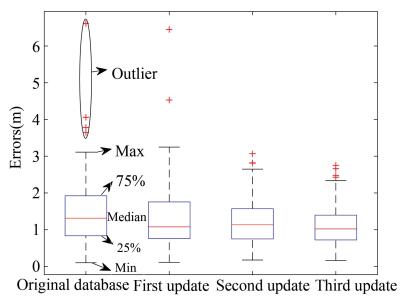
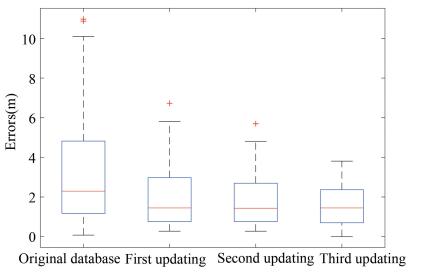
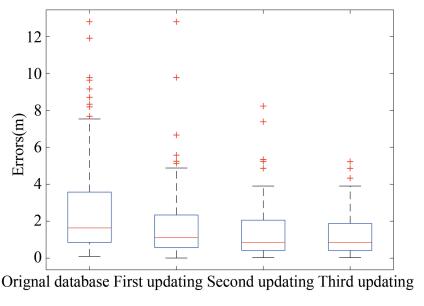
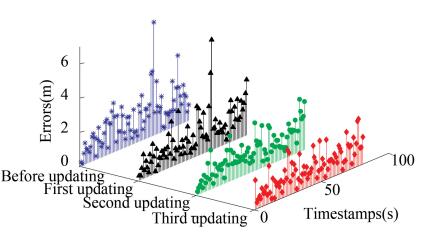
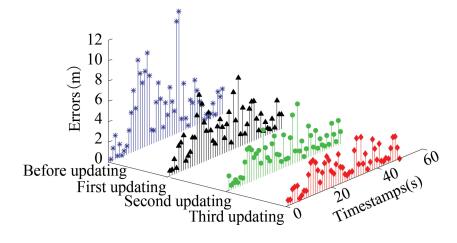
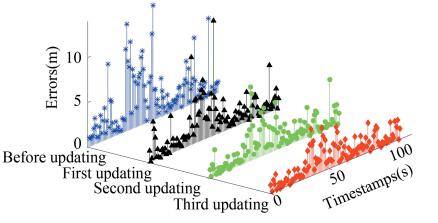
The box-whisker plots of positioning errors on the selected three paths before and after fingerprint database updating are shown in Figs. 20-22, where the horizontal and vertical axes stand for the updating times of fingerprint database and positioning errors. With the increase of the number of fingerprint database updating, the median of positioning errors generally decreased, and meanwhile the number of outliers decreased. It demonstrates that the process of fingerprint database updating can help a lot in improving the accuracy of Bluetooth positioning. Moreover, Figs. 23-25 show the corresponding three-dimensional stem graphs of positioning errors before and after fingerprint database updating. Here, the x, y, and z axes stand for the number of fingerprint database updating (including before updating), timestamps of the walking on each path, and positioning errors. Obviously, the increase of the number of fingerprint database updating generally decreased the positioning errors as expected.
|
Fig.20 Box-whisker plot on path 1 |
|
Fig.21 Box-whisker plot on path 2 |
|
Fig.22 Box-whisker plot on path 3 |
|
Fig.23 Positioning errors on path 1 |
|
Fig.24 Positioning errors on path 2 |
|
Fig.25 Positioning errors on path 3 |
Finally, the Cumulative Distribution Functions (CDFs) of the positioning errors before and after fingerprint database updating are shown in Fig. 26, and the corresponding percentile errors are illustrated in Table 2. From these results, we can find that the process of fingerprint database updating was able to reduce the median of positioning errors from 1.6 m to 1.1 m and tailing error (i.e., 90% error) from 6.0 m to 2.8 m. Meanwhile, the fourth and fifth updates had little effect on the positioning accuracy of fingerprint database. Therefore, when the amount of updated data is sufficient and there are enough candidate fingerprints at each RP, the positioning errors fluctuate near the optimal result.

|
Fig.26 CDFs of positioning errors |
| Table 2 Positioning errors under different percentile values |
5 Conclusions
Aiming at the purpose that the fingerprint database needs to be updated from the change of environment to improve indoor Bluetooth positioning accuracy, this paper proposes a new system which depends on the crowdsourced data to achieve the adaptive fingerprint database updating. Experimental results show that the proposed system can update fingerprint database in the constantly-changing signal environment with high positioning accuracy. In addition, the proposed system uses positioning result to update fingerprint database without the manual effort of re-collecting the location fingerprints at each RP. Compared with the conventional fingerprint database updating systems which require the participation of professionals, the proposed system has high positioning accuracy, needs low manpower, and is easier to operate. However, the way to simultaneously construct and update the fingerprint database in a cost-efficient manner forms an interesting future research direction.
| [1] |
Yu C, Lan H, Gu F, et al. A Map/INS/Wi-Fi integrated system for indoor location-based service applications. Sensors, 2017, 17(6): 1272-1289. DOI:10.3390/s17061272 (  0) 0) |
| [2] |
Yu X, Gao J. Kinematic precise point positioning using multi-constellation global navigation satellite system (GNSS) observations. ISPRS International Journal of Geo-Information, 2017, 6(1): 6-20. DOI:10.3390/ijgi6010006 (  0) 0) |
| [3] |
Faragher R, Harle R. Location fingerprinting with Bluetooth Low Energy beacons. IEEE Journal on Selected Areas in Communications, 2015, 33(11): 2418-2428. DOI:10.1109/JSAC.2015.2430281 (  0) 0) |
| [4] |
Zhuang Y, Syed Z, Li Y, et al. Evaluation of two WiFi positioning systems based on autonomous crowdsourcing of handheld devices for indoor navigation. IEEE Transactions on Mobile Computing, 2016, 15(8): 1982-1995. DOI:10.1109/TMC.2015.2451641 (  0) 0) |
| [5] |
Khalajmehrabadi A, Gatsis N, Akopian D. Modern WLAN fingerprinting indoor positioning methods and deployment challenges. IEEE Communications Surveys and Tutorials, 2017, 19(3): 1974-2002. DOI:10.1109/COMST.2017.2671454 (  0) 0) |
| [6] |
Kulmer J, Hinteregger S, Großwindhager B, et al. Using DecaWave UWB transceivers for high-accuracy multipath-assisted indoor positioning. Proceedings of 2017 IEEE International Conference on Communications Workshops (ICC Workshops). Piscataway: IEEE, 2017, 1239-1245. DOI:10.1109/ICCW.2017.7962828 (  0) 0) |
| [7] |
Saab S S, Nakad Z S. A standalone RFID indoor positioning system using passive tags. IEEE Transactions on Industrial Electronics, 2011, 58(5): 1961-1970. DOI:10.1109/TIE.2010.2055774 (  0) 0) |
| [8] |
Lee N, Han D. Magnetic indoor positioning system using deep neural network. Proceedings of 2017 International Conference on Indoor Positioning and Indoor Navigation (IPIN). Piscataway: IEEE, 2017, 1-8. DOI:10.1109/IPIN.2017.8115887 (  0) 0) |
| [9] |
Zhang Y, Zhang S, Li R, et al. WiFi fingerprint positioning based on clustering in mobile crowdsourcing system. Proceedings of the 2017 12th International Conference on Computer Science and Education (ICCSE). Piscataway: IEEE, 2017. 252-256. DOI: 10.1109/ICCSE.2017.8085498.
(  0) 0) |
| [10] |
Van Renesse R, Birman K P, Maffeis S. Horus: A flexible group communications system. Communications of the ACM, 1996, 39(4): 76-83. DOI: 10.1145/227210.227229.
(  0) 0) |
| [11] |
Han D, Jung S, Lee M, et al. Building a practical Wi-Fi-based indoor navigation system. IEEE Pervasive Computing, 2014, 13(2): 72-79. DOI:10.1109/MPRV.2014.24 (  0) 0) |
| [12] |
He S, Lin W, Chan S H G. Indoor localization and automatic fingerprint update with altered AP signals. IEEE Transactions on Mobile Computing, 2017, 16(7): 1897-1910. DOI:10.1109/TMC.2016.2608946 (  0) 0) |
| [13] |
Park J G, Charrow B, Curtis D, et al. Growing an organic indoor location system. Proceedings of the 8th International Conference on Mobile Systems, Applications, and Services. New York, USA: ACM, 2010. 271-284. DOI: 10.1145/1814433.1814461.
(  0) 0) |
| [14] |
Luo J, Yin X X, Zheng Y L, et al. Secure indoor localization based on extracting trusted fingerprint. Sensors, 2018, 18(2): 469-492. DOI:10.3390/s18020469 (  0) 0) |
| [15] |
Rai A, Chintalapudi K K, Padmanabhan V N, et al. Zee: Zero effort crowdsourcing for indoor localization. Proceedings of the 18th Annual International Conference on Mobile Computing and Networking. New York, USA: ACM. DOI:10.1145/2348543.2348580 (  0) 0) |
| [16] |
Wang H, Sen S, Elgohary A, et al. No need to war-drive: Unsupervised indoor localization. Proceedings of the 19th International Conference on Mobile Systems, Applications, and Services. New York, USA: ACM, 2012. 197-210. DOI: 10.1145/2307636.2307655.
(  0) 0) |
| [17] |
Wu C, Yang Z, Liu Y, et al. WILL: Wireless indoor localization without site survey. IEEE Transactions on Parallel and Distributed Systems, 2013, 24(4): 839-848. DOI:10.1109/TPDS.2012.179 (  0) 0) |
| [18] |
Wu C, Yang Z, Liu Y. Smartphones based crowdsourcing for indoor localization. IEEE Transactions on Mobile Computing, 2015, 14(2): 444-457. DOI: 10.1109/TMC.2014.2320254.
(  0) 0) |
| [19] |
Peng Y T, Niu X J, Tang J, et al. Fast signals of opportunity fingerprint database maintenance with autonomous Unmanned Ground Vehicle for indoor positioning. Sensors, 2018, 18(10): 3419. DOI: 10.3390/s18103419.
(  0) 0) |
| [20] |
Luo R C, Hsiao T J. Dynamic wireless indoor localization incorporating with an autonomous mobile robot based on an adaptive signal model fingerprinting approach. IEEE Transactions on Industrial Electronics, 2019, 66(3): 1940-1951. DOI:10.1109/TIE.2018.2833021 (  0) 0) |
| [21] |
Zhao Y X, Liu C, Mihaylova L S, et al. Gaussian processes for RSS fingerprints construction in indoor localization. Proceedings of the 2018 21st International Conference on Information Fusion (FUSION). Piscataway: IEEE, 2018. 1377-1384. DOI: 10.23919/ICIF.2018.8455842
(  0) 0) |
| [22] |
Xia Y, Zhang Z Z, Ma L, et al. Semi-supervised clustering fingerprint positioning algorithm based on distance constraints. Journal of Harbin Institute of Technology, 2015, 22(6): 55-61. DOI:10.11916/j.issn.1005-9113.2015.06.008 (  0) 0) |
| [23] |
Pan J J, Pan S J, Yin J, et al. Tracking mobile users in wireless networks via semi-supervised colocalization. IEEE Transactions on Pattern Analysis and Machine Intelligence, 2012, 34(3): 587-600. DOI:10.1109/tpami.2011.165 (  0) 0) |
| [24] |
Duan L F, Hu Z P, Xu F, et al. Fast high-density fingerprint data acquisition based on dense sampling. Proceedings of the 2018 Joint International Advanced Engineering and Technology Research Conference (JIAET 2018). Paris: Atlantis Press, 2018. 2352-5401. DOI: 10.2991/jiaet-18.2018.7
(  0) 0) |
| [25] |
Sorour S, Lostanlen Y, Valaee S. Reduced-effort generation of indoor radio maps using crowdsourcing and manifold alignment. Proceedings of the 6th International Symposium on Telecommunications (IST). Piscataway: IEEE, 2012. 354-358. DOI: 10.1109/ISTEL.2012.6483011.
(  0) 0) |
| [26] |
Jung S H, Han D. Automated construction and maintenance of Wi-Fi radio maps for crowdsourcing-based indoor positioning systems. IEEE Access, 2017, 6(12): 1764-1777. DOI:10.1109/ACCESS.2017.2780243 (  0) 0) |
| [27] |
Kim Y, Kim S. Design of aging-resistant Wi-Fi fingerprint-based localization system with continuous active learning. Proceedings of the 2018 20th International Conference on Advanced Communication Technology (ICACT). Piscataway: IEEE, 2018. 1054-1059. DOI: 10.23919/ICACT.2018.8323934.
(  0) 0) |
| [28] |
Kang W, Han Y. SmartPDR: Smartphone-based pedestrian dead reckoning for indoor localization. IEEE Sensors Journal, 2015, 15(5): 2906-2916. DOI:10.1109/JSEN.2014.2382568 (  0) 0) |
| [29] |
Bahl P, Padmanabhan V N. RADAR: An in-building RF-based user location and tracking system. Proceedings of IEEE INFOCOM 2000. Conference on Computer Communications. Nineteenth Annual Joint Conference of the IEEE Computer and Communications Societies. Piscataway: IEEE, 2000. 775-784. DOI: 10.1109/INFCOM.2000.832252.
(  0) 0) |
| [30] |
Yomchinda T. A method of multirate sensor fusion for target tracking and localization using extended Kalman Filter. Proceedings of the 2017 Fourth Asian Conference on Defence Technology-Japan (ACDT). Piscataway: IEEE, 2017, 1-7. DOI:10.1109/ACDTJ.2017.8259590 (  0) 0) |
| [31] |
Luo T, Zheng X, Xu G, et al. An improved DBSCAN algorithm to detect stops in individual trajectories. ISPRS International Journal of Geo-Information, 2017, 6(3): 63. DOI:10.3390/ijgi6030063 (  0) 0) |
| [32] |
Shannon C E. A mathematical theory of communication. The Bell System Technical Journal, 1948, 27(4): 623-656. DOI:10.1002/j.1538-7305.1948.tb00917.x (  0) 0) |
| [33] |
Kirkpatrick S, Gelatt Jr. C D, Vecchi M P. Optimization by simulated annealing. Science, 1983, 220(4598): 671-680. DOI:10.1126/science.220.4598.671 (  0) 0) |
 2020, Vol. 27


