Optical fibre displacement measurement technology is an important part of optical fibre sensing technology, which has been applied in all kinds of non-contact measurement because it has high precision, high adaptability, corrosion resistance, high temperature resistance, and is immune to electromagnetic interference. At present, there are two main methods for realizing optical fibre displacement detection. One uses the laser as the coherent light source, and the interferometry is applied to realize the detection of the small displacement. Although the accuracy is very high, the whole system is complex and expensive. The other one is the reflective intensity-modulation technique. The displacement is realized by measuring the light strength reflected from the reflector through the optical fibres. This approach has the advantages of simple structure, good stability, high accuracy, and low cost, so it has a good prospect in the displacement detection technology and has been studied by scholars all over the world[1-4]. Although its measuring principle is intuitionistic, it is essential to build the mathematic models of optical fibre bundle displacement sensors (OFBDS) based on the reflective intensity-modulation technique. It relates to light intensity spatial distribution, the arrangement of optical fibres, the numerical aperture (NA), the fibre core-radius and so on, and usually change of a single parameter can have a huge impact on the OFBDS preference. It is of great significance to carry out research on the modelling analysis of the OFBDS.
Researchers in Refs. [5-6] used the pure Gaussian distribution to calculate the light intensity spatial distribution of the transmitting fibre, which was obviously not in line with reality. Jia et al.[7] considered that the received light intensity of the receiving fibre could use the light intensity of the transmitting fibre middle point in the virtual fibre front-end as they thought the transmitting fibre radius was very small. However, this inevitably resulted in big calculation errors of the received light intensity, and brought inaccuracy to the research on the modelling of optical fibre bundles with large numbers of fibres. Marzban et al.[8] and Xie et al.[9] designed specific OFBDS based on their research objects, and the corresponding models were carried out, but they did not propose a method for modelling multi-structure optical fibre bundles.
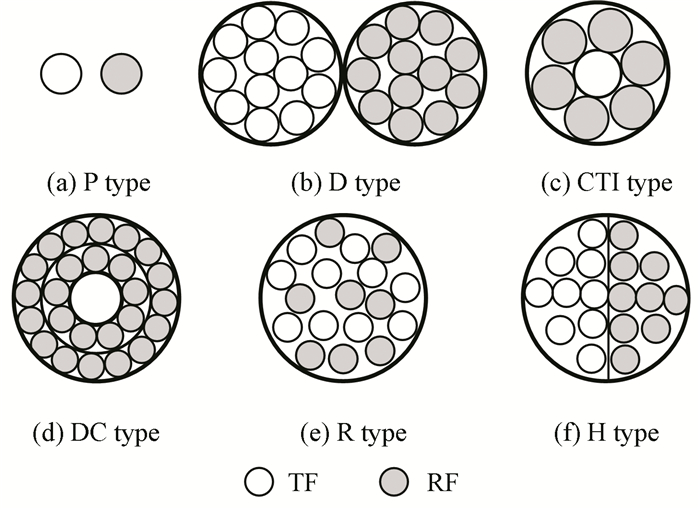
In this paper, a unified mathematical model is established based on the analysis of five kinds of most studied OFBDS, as shown in Fig. 1, including the common structures of dual (D) type, concentric transmitting inside (CTI) type, double circular (DC) type, random (R) type, and hemispherical (H) type, and are matched with the light intensity-modulation characteristics of the pair (P) type. Based on the comparison and analysis of the intensity-modulation characteristic of the abovementioned fibre bundle structure, the optimal fibre bundle structure is selected for displacement sensor design.
|
Fig.1 Cross-sectional front-end view of the common types of the OFBDS |
2 Theoretical Basis of Modelling Multi-structure OFBDS 2.1 Most Studied Structures of the OFBDS
At present, there are many different structures of the OFBDS, which have various arrangements of the transmitting fibres (TF) and the receiving fibres (RF). The most adopted are the pair (P) type with a TF and an RF, the dual (D) type with a TF bundle and an RF bundle, the concentric (C) type with a TF (bundle) and a single loop or multiple loops RF around, the random (R) type with a certain amount of randomly arranged TF and RF, and the hemispherical (H) type with half TF and half RF.
Each type of the OFBDS can be regarded as a combination of one or more P type OFBDS in the structure. Each type has different arrangement of optical fibres in the front-end, thus the light intensity coupled to RF from TF is not alike and it causes great difference in the modulation characteristics of each type.
2.2 Working Principle of the OFBDSThe working principle of the OFBDS is shown in Fig. 2, where the light emits from the TF in a conical shape and the maximum divergence angle depends on the NA. After the light is reflected by the object surface, some or all light is received by the RF. When the distance between the measurement surface and the OFBDS front-end is changing, the intensity of the reflected light received by RF will change accordingly. Provided that other conditions are invariant, the modulated signal received by the photodetector D is determined by the distance between the measurement surface and the OFBDS front-end. The function of displacement measurement is realized by the detection of the changing modulated signal.

|
Fig.2 Working principle of the OFBDS |
2.3 Characteristics of Light Intensity Spatial Distribution in Optical Output Field
According to the mode theory of optical fibre transmission, most light power is concentrated near the base and low order modes in a steady state. The radial distribution of the combined light intensity in the optical output field can be approximated by the Gaussian function, which is called Approximate-Gaussian distribution[10]. Furthermore, the light that transmits along the fibres can be approximated as plane wave, which is nearly equivalent to the circular hole diffraction formed by the plane wave in the optical output field emitted perpendicularly to the circular hole surface in an opaque screen. As a result, the actual situation is closed to a certain mixture of the above two situations.
For large core-radius multimode fibres, Yuan[10] provided the expression of light intensity spatial distribution in optical output field in Cartesian coordinates as follows:
| $ \begin{array}{l} {I_{(x,y,z)}} = \frac{{{I_0}}}{{a_0^2{{\left[ {1 + \zeta {{\left( {\frac{z}{{{a_0}}}} \right)}^{\frac{3}{2}}} \cdot {\rm{tan}}\theta } \right]}^2}}} \cdot \\ {\kern 1pt} {\kern 1pt} {\kern 1pt} {\kern 1pt} {\kern 1pt} {\kern 1pt} {\kern 1pt} {\kern 1pt} {\kern 1pt} {\kern 1pt} {\kern 1pt} {\kern 1pt} {\kern 1pt} {\kern 1pt} {\kern 1pt} {\kern 1pt} {\kern 1pt} {\kern 1pt} {\kern 1pt} {\kern 1pt} {\kern 1pt} {\kern 1pt} {\kern 1pt} {\kern 1pt} {\kern 1pt} {\kern 1pt} {\kern 1pt} {\kern 1pt} {\kern 1pt} {\kern 1pt} {\kern 1pt} {\kern 1pt} {\kern 1pt} {\kern 1pt} {\kern 1pt} {\kern 1pt} {\kern 1pt} {\kern 1pt} {\kern 1pt} {\kern 1pt} {\kern 1pt} {\kern 1pt} {\rm{exp}}\left\{ {\begin{array}{*{20}{r}} { - \frac{{{x^2} + {y^2}}}{{ a_0^2{{\left[ {1 + \zeta {{\left( {\frac{z}{{{a_0}}}} \right)}^{\frac{3}{2}}} \cdot {\rm{tan}}\theta } \right]}^2}}}} \end{array}} \right\} \end{array} $ | (1) |
where I0 (cd) is the maximum received light intensity in the front-end; z (mm) is the distance between the front-end and the reflector; I(x, y, z) (lm) is the light flux density of the position (x, y, z) in the optical output field; σ is the associated parameter which indicates the distribution of fibre refractive index, and σ=1 for the step-index fibre; a0 (mm) denotes the fibre core-radius; ζ is the modulation coefficient related to the light source type and the coupling between source and fibre, which indicates the influence of light source property and coupling condition on the intensity distribution in the optical output field; and θ(rad) is the maximum divergence angle of the optical fibre.
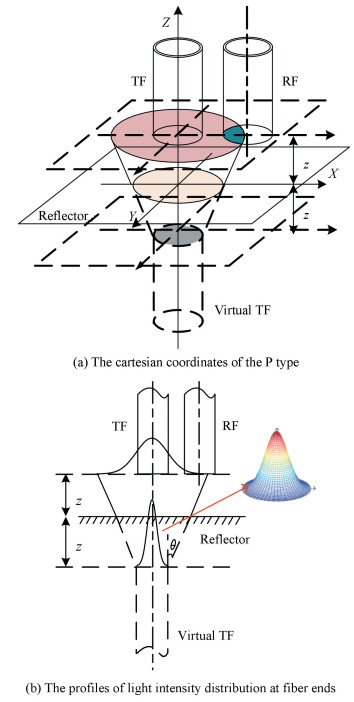
2.4 Intensity-Modulation Function of the P Type OFBDSFor the P type, according to the intensity-modulation function in Eq. (2), it can be calculated by the ratio of light intensity that TF emits and the light intensity that RF receives. The light flux received by the RF equals to that received by the RF from the TF image multiplied by the reflection coefficient of the reflector. The Cartesian coordinates were established based on Fig. 3(a).
|
Fig.3 Working principle of the P type OFBDS |
The intensity-modulation function of the P type OFBDS at the distance z between the front-end and the reflector is expressed in Eq. (2) as
| $ M = \delta \cdot \frac{{\int {\int_{{S_r}} {{I_{({x_r},{y_r},z)}}} } \cdot {S_r}{\rm{d}}s}}{{\int {\int_{{S_t}} {{I_{({x_t},{y_t},z)}}} } \cdot {S_t}{\rm{d}}s}} $ | (2) |
where Sr denotes the effective receiving area of the RF; St is the facula area reflected from the reflector in OFBDS front-end surface; and δ is the reflection coefficient of the reflector. For the convenience of the subsequent calculation, the reflector was selected as a smooth mirror, thus δ≈1. For the P type with different parameters, when the distance z changes, there are three conditions for the calculation of Sr as follows: 1) The RF cannot receive any reflected light, and Sr=0; 2) Partial RF can receive the reflected light, and Sr is dynamically changed with the change of z; and 3) The RF receives the reflected light completely, and Sr equals to the area of the RF.
Set the core-radius of TF as a1, the maximum divergence angle as θ which matches with NA, the axles distance between TF and RF as p, the distance between the reflector and TF as z, and the radius of the facula area reflected from the reflector in OFBDS front-end surface as q, thus q=2ztanθ+a1. Obviously, q is changed dynamically with z, and they have the same variation tendency. Hence, the situations can be discussed according to the change of q.
1) q ≤ p-a2, that is, z ≤ (p-a2-a1)/2tanθ;
In this situation, Sr=0, and the received light flux Фr=0, then
| $ M = \frac{{\int {\int_{{S_r}} {{I_{({x_r},{y_r},z)}}} } \cdot {S_r}{\rm{d}}s}}{{\int {\int_{{S_t}} {{I_{({x_t},{y_t},z)}}} } \cdot {S_t}{\rm{d}}s}} = 0 $ | (3) |
2) p-a2 < q ≤ p+a2, that is, (p-a2-a1)/2tanθ < q≤(p+a2-a1)/2tanθ;
As shown in Fig. 4, with the increase of z, q keeps increasing with Sr.

|
Fig.4 The area of Sr changes with q dynamically |
| $ \begin{array}{l} M = \frac{{\int {\int_{{S_r}} {{I_{({x_r},{y_r},z)}}} } \cdot {S_r}{\rm{d}}s}}{{\int {\int_{{S_t}} {{I_{({x_t},{y_t},z)}}} } \cdot {S_t}{\rm{d}}s}} = \\ {\kern 1pt} {\kern 1pt} {\kern 1pt} {\kern 1pt} {\kern 1pt} {\kern 1pt} {\kern 1pt} {\kern 1pt} {\kern 1pt} {\kern 1pt} {\kern 1pt} {\kern 1pt} {\kern 1pt} {\kern 1pt} {\kern 1pt} \frac{{2(\int {\int_{{S_{ADC}}} {{I_{(x,y,z)}}} } {\rm{d}}x{\rm{d}}y + \int {\int_{{S_{DCB}}} {{I_{(x,y,z)}}} } {\rm{d}}x{\rm{d}}y)}}{{4\int {\int_{{S_{EOB}}} {{I_{(x,y,z)}}} } {\rm{d}}x{\rm{d}}y}} = \\ {\kern 1pt} {\kern 1pt} {\kern 1pt} {\kern 1pt} {\kern 1pt} {\kern 1pt} {\kern 1pt} {\kern 1pt} {\kern 1pt} {\kern 1pt} {\kern 1pt} {\kern 1pt} {\kern 1pt} {\kern 1pt} \frac{{\int_0^{\sqrt {a_2^2 - {{(x - p)}^2}} } {\int_{p - {a_2}}^{\frac{{({p^2} + {q^2} - a_2^2)}}{{2p}}} {{I_{(x,y,z)}}} } {\rm{d}}x{\rm{d}}y + }}{{2\int_0^{\sqrt {{q^2} - {x^2}} } {\int_0^q {{I_{(x,y,z)}}} } {\rm{d}}x{\rm{d}}y}} \to \\ {\kern 1pt} {\kern 1pt} {\kern 1pt} {\kern 1pt} {\kern 1pt} {\kern 1pt} {\kern 1pt} {\kern 1pt} {\kern 1pt} {\kern 1pt} {\kern 1pt} {\kern 1pt} {\kern 1pt} {\kern 1pt} \leftarrow \frac{{\int_0^{\sqrt {{q^2} - {x^2}} } {\int_{\frac{{({p^2} + {q^2} - a_2^2)}}{{2p}}}^q {{I_{(x,y,z)}}} } {\rm{d}}x{\rm{d}}y}}{1} \end{array} $ | (4) |
3) q >p+a2, that is, z> (p+a2-a1)/2tanθ.
In this situation, the RF can completely receive the light reflected from the reflector, and Sr reaches the maximum, as shown in Fig. 4(c).
| $ \begin{array}{l} M = \frac{{\int {\int_{{S_r}} {{I_{({x_r},{y_r},z)}}} } \cdot {S_r}{\rm{d}}s}}{{\int {\int_{{S_t}} {{I_{({x_t},{y_t},z)}}} } \cdot {S_t}{\rm{d}}s}} = \frac{{\int {\int_{{S_r}} {{I_{({x_r},{y_r},z)}}} } \cdot {S_r}{\rm{d}}s}}{{4\int {\int_{{S_{FOG}}} {{I_{(x,y,z)}}} } {\rm{d}}x{\rm{d}}y}} = \\ {\kern 1pt} {\kern 1pt} {\kern 1pt} {\kern 1pt} {\kern 1pt} {\kern 1pt} {\kern 1pt} {\kern 1pt} {\kern 1pt} {\kern 1pt} {\kern 1pt} {\kern 1pt} {\kern 1pt} {\kern 1pt} {\kern 1pt} {\kern 1pt} {\kern 1pt} {\kern 1pt} {\kern 1pt} {\kern 1pt} {\kern 1pt} {\kern 1pt} {\kern 1pt} {\kern 1pt} {\kern 1pt} {\kern 1pt} {\kern 1pt} \frac{{\int_0^{\sqrt {a_2^2 - {{(x - p)}^2}} } {\int_{p - {a_2}}^{p + {a_2}} {{I_{(x,y,z)}}} } {\rm{d}}x{\rm{d}}y}}{{2\int_0^{\sqrt {{q^2} - {x^2}} } {\int_0^q {{I_{(x,y,z)}}} } {\rm{d}}x{\rm{d}}y}} \end{array} $ | (5) |
In conclusion, according to the P type OFBDS working principle and under the assumption that the reflector was regarded as a smooth mirror, the intensity-modulation function of the P type was obtained based on the geometric relationship between the virtual optical output field and the received light area of RF.
3 Modelling of Multi-Structure OFBDS 3.1 D TypeThe structure of the D type is shown in Fig. 1(b). The TF bundle and the RF bundle are constituted by a certain amount of smaller core-radius fibres, whose radii are R1 and R2 respectively and the thickness of protection are p1 and p2. Assume that all the fibres have the same NA (the same NA makes sure that all the fibres have the same maximum divergence angle), and the two bundles are closely combined, so the axis distance pD=R1+p1+R2+p2. With the aid of Eq. (6), the intensity-modulation function of the D type OFBDS is expressed as follows:
| $ {M_p} = ({a_1},{a_2},\theta ,p,z) = \\ \left\{ \begin{array}{l} 0,{\kern 1pt} {\kern 1pt} {\kern 1pt} {\kern 1pt} {\kern 1pt} {\kern 1pt} {\kern 1pt} {\kern 1pt} {\kern 1pt} {\kern 1pt} {\kern 1pt} {\kern 1pt} {\kern 1pt} {\kern 1pt} {\kern 1pt} {\kern 1pt} {\kern 1pt} {\kern 1pt} {\kern 1pt} {\kern 1pt} {\kern 1pt} {\kern 1pt} {\kern 1pt} {\kern 1pt} {\kern 1pt} {\kern 1pt} {\kern 1pt} {\kern 1pt} {\kern 1pt} {\kern 1pt} {\kern 1pt} {\kern 1pt} {\kern 1pt} {\kern 1pt} {\kern 1pt} {\kern 1pt} {\kern 1pt} {\kern 1pt} {\kern 1pt} {\kern 1pt} {\kern 1pt} {\kern 1pt} {\kern 1pt} {\kern 1pt} {\kern 1pt} {\kern 1pt} {\kern 1pt} {\kern 1pt} {\kern 1pt} {\kern 1pt} {\kern 1pt} {\kern 1pt} {\kern 1pt} {\kern 1pt} {\kern 1pt} {\kern 1pt} {\kern 1pt} {\kern 1pt} {\kern 1pt} {\kern 1pt} {\kern 1pt} {\kern 1pt} {\kern 1pt} {\kern 1pt} {\kern 1pt} {\kern 1pt} {\kern 1pt} {\kern 1pt} {\kern 1pt} {\kern 1pt} {\kern 1pt} {\kern 1pt} {\kern 1pt} {\kern 1pt} {\kern 1pt} {\kern 1pt} {\kern 1pt} {\kern 1pt} {\kern 1pt} {\kern 1pt} {\kern 1pt} {\kern 1pt} {\kern 1pt} {\kern 1pt} {\kern 1pt} {\kern 1pt} {\kern 1pt} {\kern 1pt} {\kern 1pt} {\kern 1pt} {\kern 1pt} {\kern 1pt} {\kern 1pt} {\kern 1pt} {\kern 1pt} {\kern 1pt} {\kern 1pt} {\kern 1pt} {\kern 1pt} {\kern 1pt} {\kern 1pt} {\kern 1pt} {\kern 1pt} {\kern 1pt} {\kern 1pt} {\kern 1pt} {\kern 1pt} {\kern 1pt} {\kern 1pt} {\kern 1pt} {\kern 1pt} {\kern 1pt} {\kern 1pt} {\kern 1pt} {\kern 1pt} {\kern 1pt} {\kern 1pt} {\kern 1pt} {\kern 1pt} {\kern 1pt} {\kern 1pt} {\kern 1pt} {\kern 1pt} {\kern 1pt} {\kern 1pt} {\kern 1pt} {\kern 1pt} {\kern 1pt} {\kern 1pt} {\kern 1pt} {\kern 1pt} {\kern 1pt} {\kern 1pt} {\kern 1pt} {\kern 1pt} {\kern 1pt} {\kern 1pt} {\kern 1pt} {\kern 1pt} {\kern 1pt} {\kern 1pt} {\kern 1pt} {\kern 1pt} {\kern 1pt} {\kern 1pt} {\kern 1pt} {\kern 1pt} {\kern 1pt} {\kern 1pt} {\kern 1pt} {\kern 1pt} {\kern 1pt} {\kern 1pt} {\kern 1pt} {\kern 1pt} {\kern 1pt} {\kern 1pt} {\kern 1pt} {\kern 1pt} {\kern 1pt} {\kern 1pt} {\kern 1pt} {\kern 1pt} {\kern 1pt} {\kern 1pt} {\kern 1pt} {\kern 1pt} {\kern 1pt} {\kern 1pt} {\kern 1pt} {\kern 1pt} {\kern 1pt} {\kern 1pt} {\kern 1pt} {\kern 1pt} {\kern 1pt} {\kern 1pt} {\kern 1pt} {\kern 1pt} {\kern 1pt} {\kern 1pt} {\kern 1pt} {\kern 1pt} {\kern 1pt} {\kern 1pt} {\kern 1pt} {\kern 1pt} {\kern 1pt} {\kern 1pt} {\kern 1pt} {\kern 1pt} {\kern 1pt} {\kern 1pt} {\kern 1pt} {\kern 1pt} {\kern 1pt} {\kern 1pt} {\kern 1pt} {\kern 1pt} {\kern 1pt} {\kern 1pt} z \le \frac{{p - {a_2} - {a_1}}}{{2{\rm{tan}}\theta }}\\ \frac{{\int_0^{\sqrt {a_2^2 - {{(x - p)}^2}} } {\int_{p - {a_2}}^{{p^2} + {q^2} - a_2^2} {{I_{(x,y,z)}}} } {\rm{d}}x{\rm{d}}y + \int_0^{\sqrt {{q^2} - {x^2}} } {\int_{\frac{{{p^2} + {q^2} - a_2^2}}{{2p}}}^q {{I_{(x,y,z)}}} } {\rm{d}}x{\rm{d}}y}}{{2\int_0^{\sqrt {{q^2} - {x^2}} } {\int_0^q {{I_{(x,y,z)}}} } {\rm{d}}x{\rm{d}}y}},\\ {\kern 1pt} {\kern 1pt} {\kern 1pt} {\kern 1pt} {\kern 1pt} {\kern 1pt} {\kern 1pt} {\kern 1pt} {\kern 1pt} {\kern 1pt} {\kern 1pt} {\kern 1pt} {\kern 1pt} {\kern 1pt} {\kern 1pt} {\kern 1pt} {\kern 1pt} {\kern 1pt} {\kern 1pt} {\kern 1pt} {\kern 1pt} {\kern 1pt} {\kern 1pt} {\kern 1pt} {\kern 1pt} {\kern 1pt} {\kern 1pt} {\kern 1pt} {\kern 1pt} {\kern 1pt} {\kern 1pt} {\kern 1pt} {\kern 1pt} {\kern 1pt} {\kern 1pt} {\kern 1pt} {\kern 1pt} {\kern 1pt} {\kern 1pt} {\kern 1pt} {\kern 1pt} {\kern 1pt} {\kern 1pt} {\kern 1pt} {\kern 1pt} {\kern 1pt} {\kern 1pt} {\kern 1pt} {\kern 1pt} {\kern 1pt} {\kern 1pt} {\kern 1pt} {\kern 1pt} {\kern 1pt} {\kern 1pt} {\kern 1pt} {\kern 1pt} {\kern 1pt} {\kern 1pt} {\kern 1pt} {\kern 1pt} {\kern 1pt} {\kern 1pt} {\kern 1pt} {\kern 1pt} {\kern 1pt} {\kern 1pt} {\kern 1pt} {\kern 1pt} {\kern 1pt} {\kern 1pt} {\kern 1pt} {\kern 1pt} {\kern 1pt} {\kern 1pt} {\kern 1pt} {\kern 1pt} {\kern 1pt} {\kern 1pt} {\kern 1pt} {\kern 1pt} {\kern 1pt} {\kern 1pt} {\kern 1pt} {\kern 1pt} {\kern 1pt} {\kern 1pt} {\kern 1pt} {\kern 1pt} {\kern 1pt} {\kern 1pt} {\kern 1pt} {\kern 1pt} {\kern 1pt} {\kern 1pt} {\kern 1pt} {\kern 1pt} {\kern 1pt} {\kern 1pt} {\kern 1pt} {\kern 1pt} {\kern 1pt} {\kern 1pt} {\kern 1pt} {\kern 1pt} {\kern 1pt} {\kern 1pt} {\kern 1pt} {\kern 1pt} {\kern 1pt} {\kern 1pt} {\kern 1pt} {\kern 1pt} {\kern 1pt} {\kern 1pt} {\kern 1pt} {\kern 1pt} {\kern 1pt} {\kern 1pt} {\kern 1pt} {\kern 1pt} {\kern 1pt} {\kern 1pt} {\kern 1pt} {\kern 1pt} {\kern 1pt} {\kern 1pt} {\kern 1pt} {\kern 1pt} {\kern 1pt} {\kern 1pt} {\kern 1pt} {\kern 1pt} {\kern 1pt} {\kern 1pt} {\kern 1pt} {\kern 1pt} {\kern 1pt} {\kern 1pt} {\kern 1pt} {\kern 1pt} {\kern 1pt} {\kern 1pt} {\kern 1pt} {\kern 1pt} {\kern 1pt} {\kern 1pt} {\kern 1pt} {\kern 1pt} {\kern 1pt} {\kern 1pt} {\kern 1pt} {\kern 1pt} {\kern 1pt} {\kern 1pt} {\kern 1pt} {\kern 1pt} {\kern 1pt} {\kern 1pt} {\kern 1pt} {\kern 1pt} {\kern 1pt} {\kern 1pt} {\kern 1pt} {\kern 1pt} {\kern 1pt} {\kern 1pt} {\kern 1pt} {\kern 1pt} {\kern 1pt} {\kern 1pt} {\kern 1pt} {\kern 1pt} {\kern 1pt} {\kern 1pt} {\kern 1pt} {\kern 1pt} {\kern 1pt} {\kern 1pt} {\kern 1pt} {\kern 1pt} {\kern 1pt} {\kern 1pt} {\kern 1pt} {\kern 1pt} {\kern 1pt} {\kern 1pt} {\kern 1pt} {\kern 1pt} {\kern 1pt} {\kern 1pt} {\kern 1pt} {\kern 1pt} {\kern 1pt} {\kern 1pt} {\kern 1pt} {\kern 1pt} {\kern 1pt} {\kern 1pt} {\kern 1pt} {\kern 1pt} {\kern 1pt} \frac{{p - {a_2} - {a_1}}}{{2{\rm{tan}}\theta }} < z \le \frac{{p + {a_2} - {a_1}}}{{2{\rm{tan}}\theta }}\\ \frac{{\int_0^{\sqrt {a_2^2 - {{(x - p)}^2}} } {\int_{p - {a_2}}^{p + {a_2}} {{I_{(x,y,z)}}} } {\rm{d}}x{\rm{d}}y}}{{2\int_0^{\sqrt {{q^2} - {x^2}} } {\int_0^q {{I_{(x,y,z)}}} } {\rm{d}}x{\rm{d}}y}},{\kern 1pt} {\kern 1pt} {\kern 1pt} {\kern 1pt} {\kern 1pt} {\kern 1pt} {\kern 1pt} {\kern 1pt} {\kern 1pt} {\kern 1pt} {\kern 1pt} {\kern 1pt} {\kern 1pt} {\kern 1pt} {\kern 1pt} {\kern 1pt} {\kern 1pt} {\kern 1pt} {\kern 1pt} {\kern 1pt} {\kern 1pt} {\kern 1pt} {\kern 1pt} {\kern 1pt} {\kern 1pt} {\kern 1pt} {\kern 1pt} {\kern 1pt} {\kern 1pt} {\kern 1pt} {\kern 1pt} {\kern 1pt} {\kern 1pt} {\kern 1pt} {\kern 1pt} {\kern 1pt} {\kern 1pt} {\kern 1pt} {\kern 1pt} {\kern 1pt} {\kern 1pt} {\kern 1pt} {\kern 1pt} {\kern 1pt} {\kern 1pt} {\kern 1pt} {\kern 1pt} {\kern 1pt} {\kern 1pt} {\kern 1pt} {\kern 1pt} {\kern 1pt} {\kern 1pt} {\kern 1pt} {\kern 1pt} {\kern 1pt} {\kern 1pt} {\kern 1pt} {\kern 1pt} {\kern 1pt} {\kern 1pt} {\kern 1pt} {\kern 1pt} {\kern 1pt} {\kern 1pt} {\kern 1pt} {\kern 1pt} {\kern 1pt} {\kern 1pt} {\kern 1pt} {\kern 1pt} {\kern 1pt} {\kern 1pt} {\kern 1pt} {\kern 1pt} {\kern 1pt} {\kern 1pt} {\kern 1pt} {\kern 1pt} {\kern 1pt} {\kern 1pt} {\kern 1pt} {\kern 1pt} {\kern 1pt} {\kern 1pt} {\kern 1pt} {\kern 1pt} z > \frac{{p + {a_2} - {a_1}}}{{2{\rm{tan}}\theta }} \end{array} \right. $ | (6) |
| $ \begin{array}{l} {M_D}({R_1},{R_2},\theta ,{p_D},z) = M({R_1},{R_2},\theta ,{R_1} + {p_1} + {R_2} + {p_2},z) = \\ \left\{ \begin{array}{l} 0,{\kern 1pt} {\kern 1pt} {\kern 1pt} {\kern 1pt} {\kern 1pt} {\kern 1pt} {\kern 1pt} {\kern 1pt} {\kern 1pt} {\kern 1pt} {\kern 1pt} {\kern 1pt} {\kern 1pt} {\kern 1pt} {\kern 1pt} {\kern 1pt} {\kern 1pt} {\kern 1pt} {\kern 1pt} {\kern 1pt} {\kern 1pt} {\kern 1pt} {\kern 1pt} {\kern 1pt} {\kern 1pt} {\kern 1pt} {\kern 1pt} {\kern 1pt} {\kern 1pt} {\kern 1pt} {\kern 1pt} {\kern 1pt} {\kern 1pt} {\kern 1pt} {\kern 1pt} {\kern 1pt} {\kern 1pt} {\kern 1pt} {\kern 1pt} {\kern 1pt} {\kern 1pt} {\kern 1pt} {\kern 1pt} {\kern 1pt} {\kern 1pt} {\kern 1pt} {\kern 1pt} {\kern 1pt} {\kern 1pt} {\kern 1pt} {\kern 1pt} {\kern 1pt} {\kern 1pt} {\kern 1pt} {\kern 1pt} {\kern 1pt} {\kern 1pt} {\kern 1pt} {\kern 1pt} {\kern 1pt} {\kern 1pt} {\kern 1pt} {\kern 1pt} {\kern 1pt} {\kern 1pt} {\kern 1pt} {\kern 1pt} {\kern 1pt} {\kern 1pt} {\kern 1pt} {\kern 1pt} {\kern 1pt} {\kern 1pt} {\kern 1pt} {\kern 1pt} {\kern 1pt} {\kern 1pt} {\kern 1pt} {\kern 1pt} {\kern 1pt} {\kern 1pt} {\kern 1pt} {\kern 1pt} {\kern 1pt} {\kern 1pt} {\kern 1pt} {\kern 1pt} {\kern 1pt} {\kern 1pt} {\kern 1pt} {\kern 1pt} {\kern 1pt} {\kern 1pt} {\kern 1pt} {\kern 1pt} {\kern 1pt} {\kern 1pt} {\kern 1pt} {\kern 1pt} {\kern 1pt} {\kern 1pt} {\kern 1pt} {\kern 1pt} {\kern 1pt} {\kern 1pt} {\kern 1pt} {\kern 1pt} {\kern 1pt} {\kern 1pt} {\kern 1pt} {\kern 1pt} {\kern 1pt} {\kern 1pt} {\kern 1pt} {\kern 1pt} {\kern 1pt} {\kern 1pt} {\kern 1pt} {\kern 1pt} {\kern 1pt} {\kern 1pt} {\kern 1pt} {\kern 1pt} {\kern 1pt} {\kern 1pt} {\kern 1pt} {\kern 1pt} {\kern 1pt} {\kern 1pt} {\kern 1pt} {\kern 1pt} {\kern 1pt} {\kern 1pt} {\kern 1pt} {\kern 1pt} {\kern 1pt} {\kern 1pt} {\kern 1pt} {\kern 1pt} {\kern 1pt} {\kern 1pt} {\kern 1pt} {\kern 1pt} {\kern 1pt} {\kern 1pt} {\kern 1pt} {\kern 1pt} {\kern 1pt} {\kern 1pt} {\kern 1pt} {\kern 1pt} {\kern 1pt} {\kern 1pt} {\kern 1pt} {\kern 1pt} {\kern 1pt} {\kern 1pt} {\kern 1pt} {\kern 1pt} {\kern 1pt} {\kern 1pt} {\kern 1pt} {\kern 1pt} {\kern 1pt} {\kern 1pt} {\kern 1pt} {\kern 1pt} {\kern 1pt} {\kern 1pt} {\kern 1pt} {\kern 1pt} {\kern 1pt} {\kern 1pt} {\kern 1pt} {\kern 1pt} {\kern 1pt} {\kern 1pt} {\kern 1pt} {\kern 1pt} {\kern 1pt} {\kern 1pt} {\kern 1pt} {\kern 1pt} {\kern 1pt} {\kern 1pt} {\kern 1pt} {\kern 1pt} {\kern 1pt} {\kern 1pt} {\kern 1pt} {\kern 1pt} {\kern 1pt} {\kern 1pt} {\kern 1pt} {\kern 1pt} {\kern 1pt} {\kern 1pt} {\kern 1pt} {\kern 1pt} {\kern 1pt} {\kern 1pt} {\kern 1pt} {\kern 1pt} {\kern 1pt} {\kern 1pt} {\kern 1pt} {\kern 1pt} {\kern 1pt} {\kern 1pt} {\kern 1pt} {\kern 1pt} {\kern 1pt} {\kern 1pt} {\kern 1pt} {\kern 1pt} {\kern 1pt} {\kern 1pt} {\kern 1pt} {\kern 1pt} {\kern 1pt} {\kern 1pt} {\kern 1pt} {\kern 1pt} {\kern 1pt} {\kern 1pt} {\kern 1pt} {\kern 1pt} {\kern 1pt} {\kern 1pt} {\kern 1pt} {\kern 1pt} {\kern 1pt} {\kern 1pt} {\kern 1pt} {\kern 1pt} {\kern 1pt} {\kern 1pt} {\kern 1pt} {\kern 1pt} {\kern 1pt} {\kern 1pt} {\kern 1pt} {\kern 1pt} {\kern 1pt} {\kern 1pt} {\kern 1pt} {\kern 1pt} {\kern 1pt} {\kern 1pt} {\kern 1pt} {\kern 1pt} {\kern 1pt} {\kern 1pt} {\kern 1pt} {\kern 1pt} {\kern 1pt} {\kern 1pt} {\kern 1pt} {\kern 1pt} {\kern 1pt} {\kern 1pt} {\kern 1pt} {\kern 1pt} {\kern 1pt} {\kern 1pt} {\kern 1pt} {\kern 1pt} {\kern 1pt} {\kern 1pt} {\kern 1pt} {\kern 1pt} {\kern 1pt} {\kern 1pt} {\kern 1pt} {\kern 1pt} {\kern 1pt} {\kern 1pt} {\kern 1pt} {\kern 1pt} {\kern 1pt} {\kern 1pt} {\kern 1pt} {\kern 1pt} {\kern 1pt} {\kern 1pt} {\kern 1pt} {\kern 1pt} {\kern 1pt} {\kern 1pt} {\kern 1pt} {\kern 1pt} {\kern 1pt} {\kern 1pt} {\kern 1pt} {\kern 1pt} z \le \frac{{{p_D} - {R_2} - {R_1}}}{{2{\rm{tan}}\theta }}\\ \frac{{\int_0^{\sqrt {R_2^2 - {{(x - {p_D})}^2}} } {\int_{{p_D} - {R_2}}^{\frac{{p_D^2 + {q^2} - R_2^2}}{{2{p_D}}}} {{I_{(x,y,z)}}} } {\rm{d}}x{\rm{d}}y + \int_0^{\sqrt {{q^2} - {x^2}} } {\int_{\frac{{p_D^2 + {q^2} - R_2^2}}{{2{p_D}}}}^q {{I_{(x,y,z)}}} } {\rm{d}}x{\rm{d}}y}}{{2\int_0^{\sqrt {{q^2} - {x^2}} } {\int_0^q {{I_{(x,y,z)}}} } {\rm{d}}x{\rm{d}}y}},{\kern 1pt} {\kern 1pt} {\kern 1pt} {\kern 1pt} {\kern 1pt} \frac{{{p_D} - {R_2} - {R_1}}}{{2{\rm{tan}}\theta }} < z \le \frac{{{p_D} + {R_2} - {R_1}}}{{2{\rm{tan}}\theta }}\\ \\ \frac{{\int_0^{\sqrt {R_2^2 - {{(x - {p_D})}^2}} } {\int_{{p_D} - {R_2}}^{{p_D} + {R_2}} {{I_{(x,y,z)}}} } {\rm{d}}x{\rm{d}}y}}{{2\int_0^{\sqrt {{q^2} - {x^2}} } {\int_0^q {{I_{(x,y,z)}}} } {\rm{d}}x{\rm{d}}y}},{\kern 1pt} {\kern 1pt} {\kern 1pt} {\kern 1pt} {\kern 1pt} {\kern 1pt} {\kern 1pt} {\kern 1pt} {\kern 1pt} {\kern 1pt} {\kern 1pt} {\kern 1pt} {\kern 1pt} {\kern 1pt} {\kern 1pt} {\kern 1pt} {\kern 1pt} {\kern 1pt} {\kern 1pt} {\kern 1pt} {\kern 1pt} {\kern 1pt} {\kern 1pt} {\kern 1pt} {\kern 1pt} {\kern 1pt} {\kern 1pt} {\kern 1pt} {\kern 1pt} {\kern 1pt} {\kern 1pt} {\kern 1pt} {\kern 1pt} {\kern 1pt} {\kern 1pt} {\kern 1pt} {\kern 1pt} {\kern 1pt} {\kern 1pt} {\kern 1pt} {\kern 1pt} {\kern 1pt} {\kern 1pt} {\kern 1pt} {\kern 1pt} {\kern 1pt} {\kern 1pt} {\kern 1pt} {\kern 1pt} {\kern 1pt} {\kern 1pt} {\kern 1pt} {\kern 1pt} {\kern 1pt} {\kern 1pt} {\kern 1pt} {\kern 1pt} {\kern 1pt} {\kern 1pt} {\kern 1pt} {\kern 1pt} {\kern 1pt} {\kern 1pt} {\kern 1pt} {\kern 1pt} {\kern 1pt} {\kern 1pt} {\kern 1pt} {\kern 1pt} {\kern 1pt} {\kern 1pt} {\kern 1pt} {\kern 1pt} {\kern 1pt} {\kern 1pt} {\kern 1pt} {\kern 1pt} {\kern 1pt} {\kern 1pt} {\kern 1pt} {\kern 1pt} {\kern 1pt} {\kern 1pt} {\kern 1pt} {\kern 1pt} {\kern 1pt} {\kern 1pt} {\kern 1pt} {\kern 1pt} {\kern 1pt} {\kern 1pt} {\kern 1pt} {\kern 1pt} {\kern 1pt} {\kern 1pt} {\kern 1pt} {\kern 1pt} {\kern 1pt} {\kern 1pt} {\kern 1pt} {\kern 1pt} {\kern 1pt} {\kern 1pt} {\kern 1pt} {\kern 1pt} {\kern 1pt} {\kern 1pt} {\kern 1pt} {\kern 1pt} {\kern 1pt} {\kern 1pt} {\kern 1pt} {\kern 1pt} {\kern 1pt} {\kern 1pt} {\kern 1pt} {\kern 1pt} {\kern 1pt} {\kern 1pt} {\kern 1pt} {\kern 1pt} {\kern 1pt} {\kern 1pt} {\kern 1pt} {\kern 1pt} {\kern 1pt} {\kern 1pt} {\kern 1pt} {\kern 1pt} {\kern 1pt} {\kern 1pt} {\kern 1pt} {\kern 1pt} {\kern 1pt} {\kern 1pt} {\kern 1pt} {\kern 1pt} {\kern 1pt} {\kern 1pt} {\kern 1pt} {\kern 1pt} {\kern 1pt} {\kern 1pt} {\kern 1pt} {\kern 1pt} {\kern 1pt} {\kern 1pt} {\kern 1pt} {\kern 1pt} {\kern 1pt} {\kern 1pt} {\kern 1pt} {\kern 1pt} {\kern 1pt} {\kern 1pt} {\kern 1pt} {\kern 1pt} {\kern 1pt} {\kern 1pt} {\kern 1pt} {\kern 1pt} {\kern 1pt} {\kern 1pt} {\kern 1pt} {\kern 1pt} {\kern 1pt} {\kern 1pt} {\kern 1pt} {\kern 1pt} {\kern 1pt} {\kern 1pt} {\kern 1pt} {\kern 1pt} {\kern 1pt} {\kern 1pt} {\kern 1pt} z > \frac{{{p_D} + {R_2} - {R_1}}}{{2{\rm{tan}}\theta }} \end{array} \right. \end{array} $ | (7) |
where q=2ztanθ+R1.
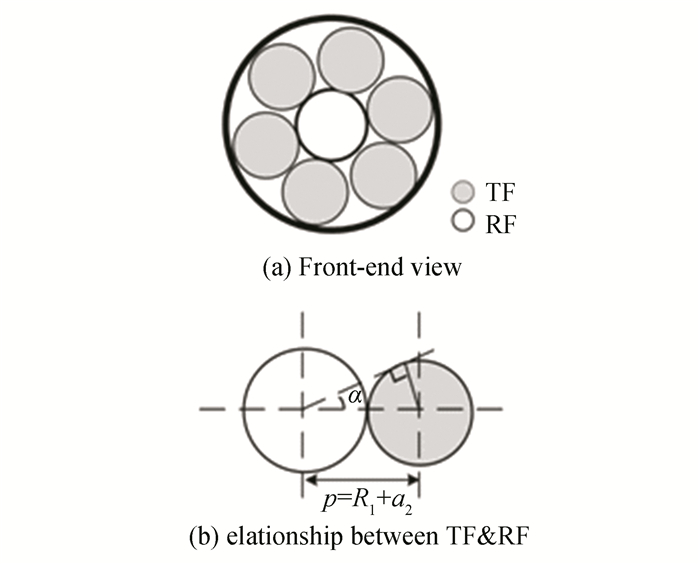
3.2 CTI TypeThe cross-sectional front-end view and the plane geometry relationship are presented in Fig. 5.
|
Fig.5 Structure of the CTI type |
Set the middle TF as the thick fibre bundle with the parameters of core-radius R1 and the maximum divergence angle θ. The core-radius of the RF is a2. All fibres have the same NA. The intensity-modulation function of the CTI type can be calculated as the combination of the P type made up by the middle TF bundle and any RF around.
Since the CTI type is closely combined by the TF bundle and all the receiving fibres, and the thickness of protection is much smaller than their core-radius, the axis distance between the TF bundle and the RF can be written as pCTI=R1+a2. Then the amount of the RF around is
| $ N=\operatorname{int}(\mathsf{π} / a)=\operatorname{int}\left[\mathsf{π} / \arcsin \left(a_{2} /\left(R_{1}+a_{2}\right)\right)\right] $ |
The intensity-modulation of the CTI type can be obtained as follows:
| $ {M_{{\rm{CTI}}}} = nM({R_1},{a_2},\theta ,{p_{{\rm{CTI}}}},z) = \\ \left\{ \begin{array}{l} 0,{\kern 1pt} {\kern 1pt} {\kern 1pt} {\kern 1pt} {\kern 1pt} {\kern 1pt} {\kern 1pt} {\kern 1pt} {\kern 1pt} {\kern 1pt} {\kern 1pt} {\kern 1pt} {\kern 1pt} {\kern 1pt} {\kern 1pt} {\kern 1pt} {\kern 1pt} {\kern 1pt} {\kern 1pt} {\kern 1pt} {\kern 1pt} {\kern 1pt} {\kern 1pt} {\kern 1pt} {\kern 1pt} {\kern 1pt} {\kern 1pt} {\kern 1pt} {\kern 1pt} {\kern 1pt} {\kern 1pt} {\kern 1pt} {\kern 1pt} {\kern 1pt} {\kern 1pt} {\kern 1pt} {\kern 1pt} {\kern 1pt} {\kern 1pt} {\kern 1pt} {\kern 1pt} {\kern 1pt} {\kern 1pt} {\kern 1pt} {\kern 1pt} {\kern 1pt} {\kern 1pt} {\kern 1pt} {\kern 1pt} {\kern 1pt} {\kern 1pt} {\kern 1pt} {\kern 1pt} {\kern 1pt} {\kern 1pt} {\kern 1pt} {\kern 1pt} {\kern 1pt} {\kern 1pt} {\kern 1pt} {\kern 1pt} {\kern 1pt} {\kern 1pt} {\kern 1pt} {\kern 1pt} {\kern 1pt} {\kern 1pt} {\kern 1pt} {\kern 1pt} {\kern 1pt} {\kern 1pt} {\kern 1pt} {\kern 1pt} {\kern 1pt} {\kern 1pt} {\kern 1pt} {\kern 1pt} {\kern 1pt} {\kern 1pt} {\kern 1pt} {\kern 1pt} {\kern 1pt} {\kern 1pt} {\kern 1pt} {\kern 1pt} {\kern 1pt} {\kern 1pt} {\kern 1pt} {\kern 1pt} {\kern 1pt} {\kern 1pt} {\kern 1pt} {\kern 1pt} {\kern 1pt} {\kern 1pt} {\kern 1pt} {\kern 1pt} {\kern 1pt} {\kern 1pt} {\kern 1pt} {\kern 1pt} {\kern 1pt} {\kern 1pt} {\kern 1pt} {\kern 1pt} {\kern 1pt} {\kern 1pt} {\kern 1pt} {\kern 1pt} {\kern 1pt} {\kern 1pt} {\kern 1pt} {\kern 1pt} {\kern 1pt} {\kern 1pt} {\kern 1pt} {\kern 1pt} {\kern 1pt} {\kern 1pt} {\kern 1pt} {\kern 1pt} {\kern 1pt} {\kern 1pt} {\kern 1pt} {\kern 1pt} {\kern 1pt} {\kern 1pt} {\kern 1pt} {\kern 1pt} {\kern 1pt} {\kern 1pt} {\kern 1pt} {\kern 1pt} {\kern 1pt} {\kern 1pt} {\kern 1pt} {\kern 1pt} {\kern 1pt} {\kern 1pt} {\kern 1pt} {\kern 1pt} {\kern 1pt} {\kern 1pt} {\kern 1pt} {\kern 1pt} {\kern 1pt} {\kern 1pt} {\kern 1pt} {\kern 1pt} {\kern 1pt} {\kern 1pt} {\kern 1pt} {\kern 1pt} {\kern 1pt} {\kern 1pt} {\kern 1pt} {\kern 1pt} {\kern 1pt} {\kern 1pt} {\kern 1pt} {\kern 1pt} {\kern 1pt} {\kern 1pt} {\kern 1pt} {\kern 1pt} {\kern 1pt} {\kern 1pt} {\kern 1pt} {\kern 1pt} z \le \frac{{{p_{{\rm{CTI}}}} - {a_2} - {R_1}}}{{2{\rm{tan}}\theta }}\\ n \cdot \frac{{\int_0^{\sqrt {a_2^2 - {{(x - {p_{{\rm{CTI}}}})}^2}} } {\int_{{p_{{\rm{CTI}}}} - {a_2}}^{\frac{{p_{{\rm{CTI}}}^2 + {q^2} - a_2^2}}{{2p}}} {{I_{(x,y,z)}}} } {\rm{d}}x{\rm{d}}y + \int_0^{\sqrt {{q^2} - {x^2}} } {\int_{\frac{{p_{{\rm{CTI}}}^2 + {q^2} - a_2^2}}{{2{p_{{\rm{CTI}}}}}}}^q {{I_{(x,y,z)}}} } {\rm{d}}x{\rm{d}}y}}{{2\int_0^{\sqrt {{q^2} - {x^2}} } {\int_0^q {{I_{(x,y,z)}}} } {\rm{d}}x{\rm{d}}y}},{\kern 1pt} {\kern 1pt} {\kern 1pt} {\kern 1pt} {\kern 1pt} \\ {\kern 1pt} {\kern 1pt} {\kern 1pt} {\kern 1pt} {\kern 1pt} {\kern 1pt} {\kern 1pt} {\kern 1pt} {\kern 1pt} {\kern 1pt} {\kern 1pt} {\kern 1pt} {\kern 1pt} {\kern 1pt} {\kern 1pt} {\kern 1pt} {\kern 1pt} {\kern 1pt} {\kern 1pt} {\kern 1pt} {\kern 1pt} {\kern 1pt} {\kern 1pt} {\kern 1pt} {\kern 1pt} {\kern 1pt} {\kern 1pt} {\kern 1pt} {\kern 1pt} {\kern 1pt} {\kern 1pt} {\kern 1pt} {\kern 1pt} {\kern 1pt} {\kern 1pt} {\kern 1pt} {\kern 1pt} {\kern 1pt} {\kern 1pt} {\kern 1pt} {\kern 1pt} {\kern 1pt} {\kern 1pt} {\kern 1pt} {\kern 1pt} {\kern 1pt} {\kern 1pt} {\kern 1pt} {\kern 1pt} {\kern 1pt} {\kern 1pt} {\kern 1pt} {\kern 1pt} {\kern 1pt} {\kern 1pt} {\kern 1pt} {\kern 1pt} {\kern 1pt} {\kern 1pt} {\kern 1pt} {\kern 1pt} {\kern 1pt} {\kern 1pt} {\kern 1pt} {\kern 1pt} {\kern 1pt} {\kern 1pt} {\kern 1pt} {\kern 1pt} {\kern 1pt} {\kern 1pt} {\kern 1pt} {\kern 1pt} {\kern 1pt} {\kern 1pt} {\kern 1pt} {\kern 1pt} {\kern 1pt} {\kern 1pt} {\kern 1pt} {\kern 1pt} {\kern 1pt} {\kern 1pt} {\kern 1pt} {\kern 1pt} {\kern 1pt} {\kern 1pt} {\kern 1pt} {\kern 1pt} {\kern 1pt} {\kern 1pt} {\kern 1pt} {\kern 1pt} {\kern 1pt} {\kern 1pt} {\kern 1pt} {\kern 1pt} {\kern 1pt} {\kern 1pt} {\kern 1pt} {\kern 1pt} {\kern 1pt} {\kern 1pt} {\kern 1pt} {\kern 1pt} {\kern 1pt} {\kern 1pt} {\kern 1pt} {\kern 1pt} {\kern 1pt} {\kern 1pt} {\kern 1pt} {\kern 1pt} {\kern 1pt} {\kern 1pt} {\kern 1pt} {\kern 1pt} {\kern 1pt} {\kern 1pt} {\kern 1pt} {\kern 1pt} {\kern 1pt} {\kern 1pt} {\kern 1pt} {\kern 1pt} {\kern 1pt} {\kern 1pt} {\kern 1pt} {\kern 1pt} {\kern 1pt} {\kern 1pt} {\kern 1pt} {\kern 1pt} {\kern 1pt} {\kern 1pt} {\kern 1pt} {\kern 1pt} {\kern 1pt} {\kern 1pt} {\kern 1pt} {\kern 1pt} {\kern 1pt} {\kern 1pt} {\kern 1pt} {\kern 1pt} {\kern 1pt} {\kern 1pt} {\kern 1pt} {\kern 1pt} {\kern 1pt} {\kern 1pt} {\kern 1pt} {\kern 1pt} {\kern 1pt} {\kern 1pt} {\kern 1pt} {\kern 1pt} {\kern 1pt} {\kern 1pt} {\kern 1pt} {\kern 1pt} {\kern 1pt} {\kern 1pt} {\kern 1pt} {\kern 1pt} {\kern 1pt} {\kern 1pt} {\kern 1pt} \frac{{{p_{{\rm{CTI}}}} - {a_2} - {R_1}}}{{2{\rm{tan}}\theta }} < z \le \frac{{{p_{{\rm{CTI}}}} + {a_2} - {R_1}}}{{2{\rm{tan}}\theta }}\\ n \cdot \frac{{\int_0^{\sqrt {a_2^2 - {{(x - {p_{{\rm{CTI}}}})}^2}} } {\int_{{p_{{\rm{CTI}}}} - {a_2}}^{{p_{{\rm{CTI}}}} + {a_2}} {{I_{(x,y,z)}}} } {\rm{d}}x{\rm{d}}y}}{{2\int_0^{\sqrt {{q^2} - {x^2}} } {\int_0^q {{I_{(x,y,z)}}} } {\rm{d}}x{\rm{d}}y}},z > \frac{{{p_{{\rm{CTI}}}} + {a_2} - {R_1}}}{{2{\rm{tan}}\theta }} \end{array} \right. $ | (8) |
where q=2ztanθ+R1.
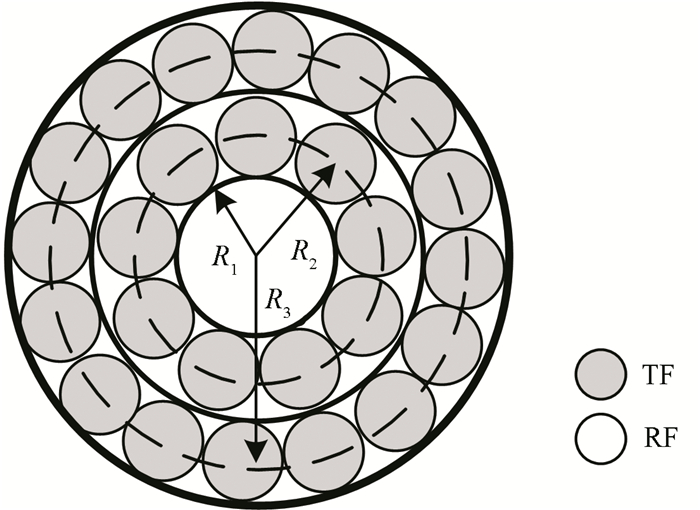
3.3 DC TypeAs shown in Fig. 6, the radius of the TF (bundle) is R1, and those of the middle and the outer circles are R2 and R3. The core-radius of all receiving fibres is a2. Each fibre (bundle) has the same NA and the same maximum divergence angle θ. Assume that the thickness of the protection for fibres is too thin to be calculated, then the axis distance between the TF (bundle) and the middle circle P1=R1+a2, and the axis distance between the TF (bundle) and the outer circle p2=R1+3a2.
|
Fig.6 Structure of the DC type |
The DC type can be equivalent to two sets of the CTI type working together. One is comprised by the TF (bundle) and the receiving fibres in the middle circle, and the other is constituted by the TF (bundle) and the receiving fibres in the outer circle. The intensity-modulation function of the first set is M1 and that of the second is M2, so the intensity-modulation function of the DC type is expressed as
| $ {M_{{\rm{DC}}}} = \frac{{{M_2}}}{{{M_1}}} $ | (9) |
The calculations of the intensity-modulation function M1 and M2 are similar to that in Section 3.2.
| $ \left\{ {\begin{array}{*{20}{l}} {{M_1} = {n_{r1}}M({R_1},{a_2},\theta ,{p_1},z)}\\ {{M_2} = {n_{r2}}M({R_1},{a_2},\theta ,{p_2},z)} \end{array}} \right. $ | (10) |
where
Hence, the intensity-modulation function of the DC type can be written as
| $ {M_{{\rm{DC}}}} = \frac{{{M_2}}}{{{M_1}}} = \frac{{{n_{r2}}M({R_1},{a_2},\theta ,{p_2},z)}}{{{n_{r1}}M({R_1},{a_2},\theta ,{p_1},z)}} $ | (11) |
The cross-sectional front-end view of the R type is presented in Fig. 1(e). The R type OFBDS is consisted of nt transmitting fibres and nr receiving fibres, as shown in Fig. 7. The radius of the whole bundle is R. Each fibre-core radius is a, and the maximum divergence angle is θ. The working principle of the R type can be considered as nt·nr sets of the P type randomly arranged with each other closely with the parameters a and θ working together.

|
Fig.7 Distribution of TF and RF under rectangular coordinate system |
Set the intensity-modulation function of the P type combined by the ith TF and the jth RF as
| $ {M_{ij}} = \frac{{{\varPhi _{rij}}}}{{{\varPhi _{ti}}}} $ | (12) |
where Фti is the output light flux of the ith TF and Фrij is the received light flux of the jth RF only from the ith TF. With the same fibre parameters and light source, the output light flux of each TF in the R type is identical, that is Фt=Фti, and the total output light flux Qt=ntФt. The total received light flux of the R type OFBDS Qr equals to the sum of Фrij (j=1 to nr, i=1 to nt).
Therefore, the intensity-modulation function of the R type can be written as
| $ {M_R} = \frac{{{Q_r}}}{{{Q_t}}} = \frac{{\sum\limits_{j = 1}^{{n_r}} {\sum\limits_{i = 1}^{{n_t}} {{\varPhi _{rij}}} } }}{{{n_t}{\varPhi _t}}} = \frac{{\sum\limits_{j = 1}^{{\mathit{\boldsymbol{n}}_\mathit{\boldsymbol{r}}}} {\sum\limits_{i = 1}^{{\mathit{\boldsymbol{n}}_\mathit{\boldsymbol{t}}}} {{\mathit{\boldsymbol{M}}_{\mathit{\boldsymbol{ij}}}}} } }}{{{\mathit{\boldsymbol{n}}_\mathit{\boldsymbol{t}}}}} $ | (13) |
When Mij=M(a1, a2, θ, pij, z)=M(a, θ, pij, z) in Eq.(13), the MR calculation is equal to the calculation of any axis distance Pij between any TF and RF in all nt·nr sets of the arranged P type OFBDS randomly.
According to Ref. [11], the calculation method for pij under rectangular coordinate system is
| $ \begin{array}{l} {p_{ij}} = (2a + 2c + g) \cdot \\ {\kern 1pt} {\kern 1pt} {\kern 1pt} {\kern 1pt} {\kern 1pt} {\kern 1pt} {\kern 1pt} {\kern 1pt} {\kern 1pt} {\kern 1pt} {\kern 1pt} {\kern 1pt} {\kern 1pt} {\kern 1pt} {\kern 1pt} {\kern 1pt} {\kern 1pt} {\kern 1pt} {\kern 1pt} {\kern 1pt} {\kern 1pt} {\kern 1pt} {\kern 1pt} {\kern 1pt} {\kern 1pt} {\kern 1pt} {\kern 1pt} \sqrt {{{({x_i} - {x_j})}^2} + {{({y_i} - {y_j})}^2} + ({x_i} - {x_j})({y_i} - {y_j})} \end{array} $ | (14) |
where a is the radius of the TF and the RF; c is the thickness of the protection for fibres; and g denotes the shortest distance between any two adjacent fibres. Meanwhile, the arrangement regulation of the TF and RF in the R type OFBDS is summarized as follows[11]:
| $ \left\{ {\begin{array}{*{20}{c}} {T(x,y) \in \left\{ {(x,y)|\,{\rm{mod}}\,\left( {x + \frac{3}{2},\frac{3}{2}} \right) = } \right.}\\ {\left. {0 \cap s \le R - \frac{{2r + 2c + g}}{2}} \right\}}\\ {R(x,y) \in \left\{ {(x,y)|\,{\rm{mod}}\,\left( {x + \frac{3}{2},\frac{3}{2}} \right) \ne } \right.}\\ {\left. {0 \cap s \le R - \frac{{2r + 2c + g}}{2}} \right\}} \end{array}} \right. $ | (15) |
The structure of the H type is given in Fig. 1(f). Obviously, the H type OFBDS has the same amount of transmitting fibres and receiving fibres according to its structure characteristics, so nt=nr=n, the radius of each fibre is a, and the NA and θ are identical. The radius of the whole H type OFBDS is R. Parallel to the intensity-modulation function of the R type, the H type is similar with Eq. (14).
| $ \begin{array}{*{20}{c}} {{M_H} = \frac{{{Q_r}}}{{{Q_t}}} = \frac{{\sum\limits_{j = 1}^{{n_r}} {\sum\limits_{i = 1}^{{n_t}} {{\Phi _{rij}}} } }}{{{n_t}{\Phi _t}}} = }\\ {\frac{{\sum\limits_{j = 1}^{{n_r}} {\sum\limits_{i = 1}^{{n_t}} M } (a,\theta ,{p_{ij}},z)}}{{{n_t}}}} \end{array} $ | (16) |
where
It was noticed that the distribution of TF and RF in the H type was different from that in the R type under rectangular coordinate system, which was also proposed in Ref. [11] as follows:
| $ \left\{ {\begin{array}{*{20}{l}} {T(x,y) \in \left\{ {(x,y)|x + \frac{y}{2} < 0 \cap s \le R - \frac{{2r + 2c + g}}{2}} \right\}}\\ {R(x,y) \in \left\{ {(x,y)|x + \frac{y}{2} \ge 0 \cap s \le R - \frac{{2r + 2c + g}}{2}} \right\}} \end{array}} \right. $ | (17) |
When the other fibre parameters were unchanged and all fibres were closely arranged, the intensity-modulation characteristics of each type OFBDS analysed above were simulated to the influence caused by the change of fibre core-radius based on the Eqs. (6)-(8), (11), (13), (16). Set NA=0.22, the modulation coefficient ζ=0.5[12], and the z-axis coordinates in the figures below were normalized.
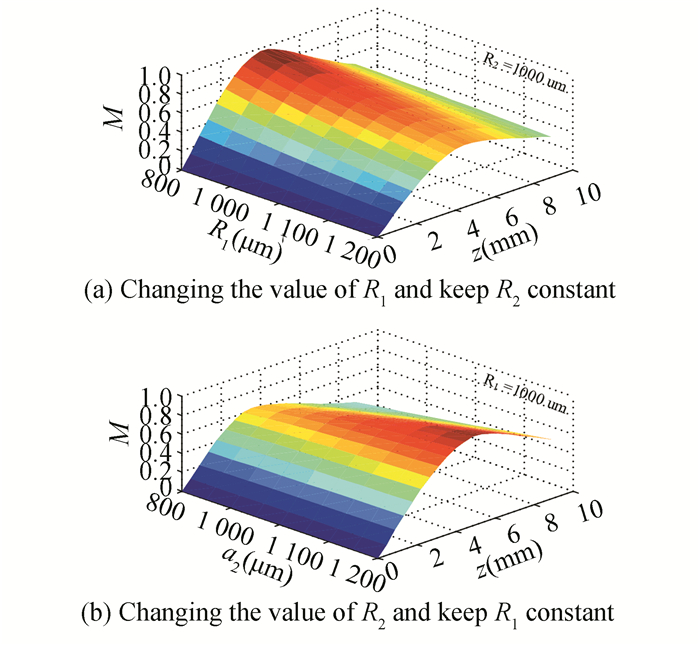
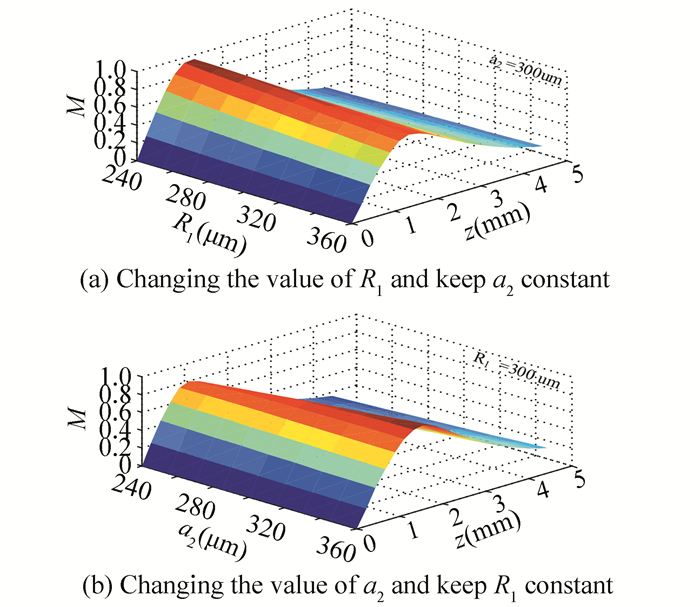
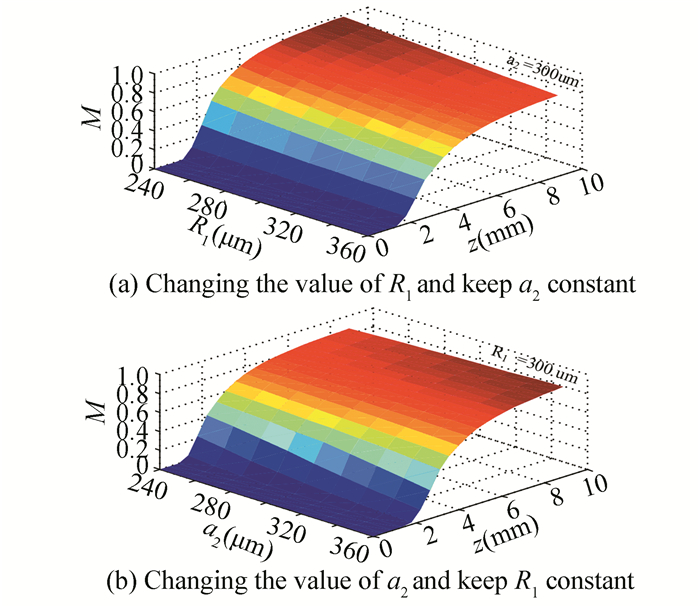
For the P type, the D type, the CTI type, and the DC type (as shown in Figs. 8-11), when the radius of TF (bundle) increased, the starting distance d0 remained, the peak distance [d0, dp] increased, the peak value Mp decreased, and the forward sloop displacement sensitivity Sf showed a decreasing trend with other conditions maintained unchanged. When the radius of the RF increased in the P type, the D type, and the CTI type, the starting distance d0 remained, while the peak distance [d0, dp], the peak value Mp, and the forward sloop displacement sensitivity Sf increased. However, in the DC type structure, d0, [d0, dp], Mp, and Sf all increased with the increase of the radius of RF.

|
Fig.8 Simulation of the P type intensity-modulation characteristics when a1 and a2 change separately |
|
Fig.9 Simulation of the D type intensity-modulation characteristics when R1 and R2 change separately |
|
Fig.10 Simulation of the CTI type intensity-modulation characteristics when R1 and R2 change separately |
|
Fig.11 Simulation of the DC type intensity-modulation characteristics when R1 and a2 change separately |
It can be seen from Fig. 12 that d0 was almost zero, [d0, dp] increased, Mp had no significant change, and Sf decreased when the core-radius of TF and RF both changed.

|
Fig.12 Simulation of the R type and the H type intensity-modulation characteristics when the core radii of TF and RF change together |
4.2 Influence of Change of NA on Intensity-Modulation Characteristics
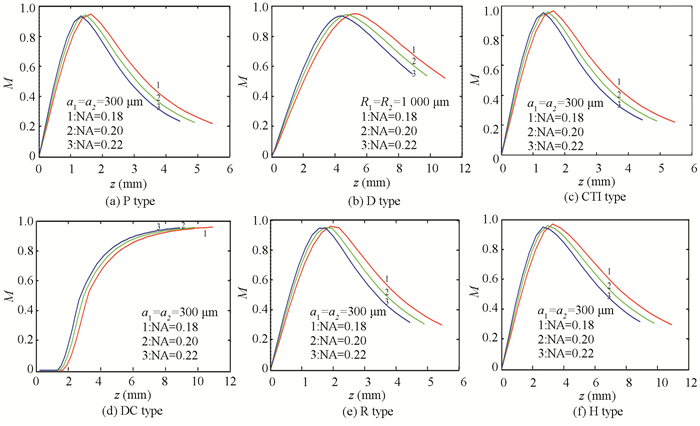
The simulation requirement was the same with that in Section 5.1, and only the NA of each type was changed. The simulation curves of the intensity-modulation characteristics of each type are presented below. The M value in Fig. 13 was normalized.
|
Fig.13 Simulation of intensity-modulation characteristics when NA changes |
As illustrated above, when NA increased, [d0, dp] gradually reduced, and d0 and Mp were essentially constant with other conditions unchanged. Therefore, the linear range of the forward sloop became shorter and Sf increased. In particularly, d0 decreased when the NA of the fibres increased only in the DC type.
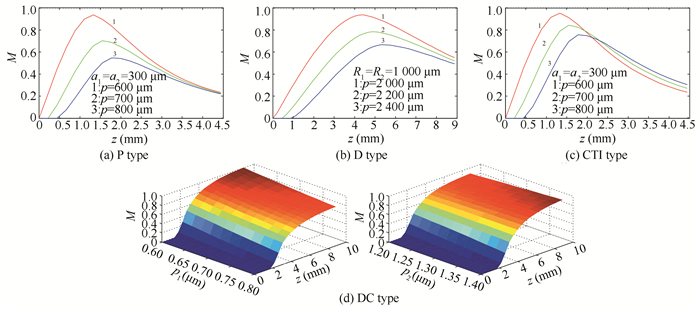
4.3 Influence of Change of Axis Distance between TF (Bundle) and RF (Bundle) on Intensity-Modulation CharacteristicsWhen the radius and NA of each fibre were unchanged, the simulation of the influence of the change of the axis distance between TF (bundle) and RF (bundle) on intensity-modulation characteristics is shown in Fig. 14 according to Eqs. (6)-(8), (11), (13), (16).
|
Fig.14 Simulation of intensity-modulation characteristics when the axis distance changes |
It should be noticed that the R type and the H type had the structural feature of all fibres combined, thus the analysis of the influence of the axis distance on them was not taken account of.
The simulation results show that with the growth of the axis distance between TF (bundle) and RF (bundle), d0 and [d0, dp] increased while Mp and Sf reduced in the P type, the D type, and the CTI type. For the DC type structure, when only the axis distance between the TF (bundle) and the middle circle p1 increased, d0 enlarged while [d0, dp] and Mp reduced, and Sf remained constant. When only the axis distance between the TF (bundle) and the outer circle p2 increased, d0, [d0, dp], and Mp all enlarged, and Sf also had an increasing trend.
4.4 Selection of the Sensor Fibre Bundle StructureBased on the above analysis, it can be seen that the CTI type fibre bundle had better light intensity modulation characteristics. Therefore, according to the simulation results, the designed fibre bundle parameters are presented in Table 1.
| Table 1 Design parameters of the sensor fiber probe |
5 Design of Fibre Sensor System 5.1 Design of the Hardware System 5.1.1 Light source
JW3105B box-type red source uses the Laser diode as light emitting device, and the laser drive circuit ensures that the laser has a constant power output. JW310B was used as the sensor light source.
5.1.2 Design of photoelectric conversion circuitSince the receiving light intensity of the optical fibre displacement sensor is very weak, the OPT101 (made by Burr-Brown Company) chip was chosen as the Photoelectric conversion Device, which has a large measurement area that collects a significant amount of light, and thus allows for high-sensitivity measurement. The internal feedback resistor was laser trimmed to 1 MΩ. Using this resistor, the output voltage responsivity (RV) was approximately 0.45 V/μw at 650 nm wavelength. Based on the diagram of OPT101 equivalent circuit as shown in Fig. 15, the model of OPT101 is as follows:

|
Fig.15 Diagram of OPT101 equivalent circuit |
| $ {H_1}(s) = \frac{{{R_2}//\frac{1}{{sC}}}}{{{R_1}}} = \frac{{{R_2}}}{{{R_1}}} \cdot \frac{1}{{{R_2}Cs + 1}} $ | (18) |
where R1=10 kΩ, R2=1 MΩ, and C=11 pF.
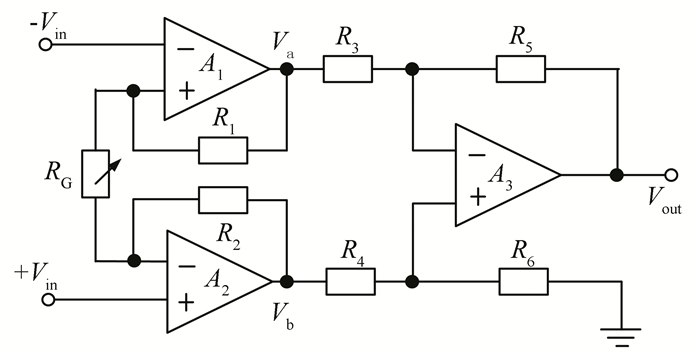
5.1.3 Signal amplifier moduleSince the output voltage of OPT101 is in millivolt level, an AD620 was used as the core amplifier to enlarge the output voltage. AD620 is a commonly used single chip instrumentation amplifier, whose variable gain ranges up to 1000 and the extremely wide operating voltage ranges from ±2.3 V to ±18 V. The functional structure diagram of AD620 is shown in Fig. 16.
|
Fig.16 Diagram of AD620 functional structure |
Based on the functional structure of AD620, the amplification calculated is
| $ G = \frac{{47.4}}{{{R_G}}} + 1 $ | (19) |
where G is the amplification of the circuit, and RG (kΩ) is the external gain resistor.
5.1.4 Design of lowpass filter modulesConsidering that the output voltage signal of the photoelectric conversion chip may be affected by the photoelectric tube noise and the circuit noise in the system, an active filter based on MAX274 monolithic integrated is designed in this paper. The schematic diagram of the filter circuit is shown in Fig. 17.

|
Fig.17 Schematic diagram of filter circuit |
According to Fig. 17, the transfer function of the filter can be calculated as
| $ \left\{ {\begin{array}{*{20}{l}} {\frac{{{V_{{\rm{ in }}}}}}{{{R_1}}} = - \frac{{{V_{{\rm{ BP }}}}}}{{{R_3}}} - \frac{{{V_{{\rm{ HP }}}}}}{{{R_X}}}}\\ {\frac{{{V_{{\rm{ HP }}}}}}{{{R_{\rm{Y}}}}} = - \frac{{{V_A}}}{{1/s{\kern 1pt} {\kern 1pt} {C_1}}} - \frac{{{V_{{\rm{LP}}}}}}{{{R_2}}}}\\ {\frac{{{V_{\rm{A}}}}}{{{R_{11}}}} = - \frac{{{V_{{\rm{ BP }}}}}}{{{R_{22}}}}}\\ {\frac{{{V_{{\rm{ BP }}}}}}{{{R_4} + {R_{33}}}} = - \frac{{{V_{{\rm{ LP }}}}}}{{1/s{\kern 1pt} {\kern 1pt} {C_2}}}} \end{array}} \right. $ | (20) |
| $ {H_2}(s) = \frac{{{V_{{\rm{LP}}}}}}{{{V_{{\rm{IN}}}}}} = \frac{{\frac{{{R_{\rm{X}}}}}{{{R_{\rm{Y}}}{R_1}{C_1}{C_2}({R_4} + {R_{33}})}}}}{{{s^2} + s\frac{{{R_{\rm{X}}}}}{{{R_{\rm{Y}}}{R_3}{C_1}}} + \frac{1}{{{C_1}{C_2}{R_2}({R_4} + {R_{33}})}}}} $ | (21) |
The typical expression for the filter transfer functions is
| $ A(s) = \frac{{{A_0}\frac{s}{{Q{\omega _0}}}}}{{1 + \frac{s}{{Q{\omega _0}}} + {{\left( {\frac{s}{{{\omega _0}}}} \right)}^2}}} $ | (22) |
Based on Eqs. (21) and (22), the centre frequency of the lowpass filter ω0, the Quality factor Q, and the system gain G can be obtained as follows:
| $ {{\omega _0} = \sqrt {\frac{1}{{{R_2}{C_1}{C_2}({R_4} + {R_{33}})}}} } $ | (23) |
| $ {Q = \sqrt {\frac{1}{{{R_2}{C_1}{C_2}({R_4} + {R_{33}})}}} \frac{{{R_{\rm{Y}}}}}{{{R_{\rm{X}}}}}{R_3}} $ | (24) |
| $ {G = \frac{{{R_3}}}{{{R_1}}}} $ | (25) |
According to Eqs. (23)-(25), the mathematical relationship between R1, R2, R3, and R4 can be obtained as
| $ \left\{ {\begin{array}{*{20}{l}} {{R_1} = \frac{{{R_3}}}{G}}\\ {{R_2} = \frac{{2 \times {{10}^9}}}{{{F_0}}}}\\ {{R_3} = \frac{{Q \times 2 \times {{10}^9}}}{{{F_0}}} \times \frac{{{R_{\rm{X}}}}}{{{R_{\rm{Y}}}}}}\\ {{R_4} = {R_2} - 5{\kern 1pt} {\kern 1pt} {\kern 1pt} {\rm{k\Omega }}} \end{array}} \right. $ | (26) |
Considering the maximum output bandwidth of the OPT101 is 23 kHz, so 23 kHz was designed as the sensor bandwidth. For formula (26), R1=16 kΩ, R2=46 kΩ, R3=16 kΩ, and R4=46 kΩ were selected for the design.
5.2 Sensor Measurement EquationsThe sensor measurement equation can be written as
| $ V = 6G{R_f}{S_p}P $ | (27) |
where G is the amplification calculated by formula (19); Rf is the internal load resistance of the photoelectric; SP is the sensitivity of the OPT101 calculated by formula (18); and P is the receiving light intensity of single fibre.
According to formulae (1) and (27),
| $ \begin{array}{*{20}{l}} {V = 6G{R_f}{S_p}P = 6G{R_f}{S_p} \cdot }\\ {{\kern 1pt} {\kern 1pt} {\kern 1pt} {\kern 1pt} {\kern 1pt} {\kern 1pt} {\kern 1pt} {\kern 1pt} {\kern 1pt} {\kern 1pt} {\kern 1pt} {\kern 1pt} {\kern 1pt} {\kern 1pt} {\kern 1pt} {\kern 1pt} {\kern 1pt} {\kern 1pt} {\kern 1pt} {\kern 1pt} {\kern 1pt} {\kern 1pt} {\kern 1pt} \int {\int_s {\frac{{{K_0}{I_0}}}{{\mathsf{π} {a^2}{{[1 + \zeta {{(z/a)}^{3/2}}{\rm{tan}}\theta ]}^2}}} \cdot } } }\\ {{\kern 1pt} {\kern 1pt} {\kern 1pt} {\kern 1pt} {\kern 1pt} {\kern 1pt} {\kern 1pt} {\kern 1pt} {\kern 1pt} {\kern 1pt} {\kern 1pt} {\kern 1pt} {\kern 1pt} {\kern 1pt} {\kern 1pt} {\kern 1pt} {\kern 1pt} {\kern 1pt} {\kern 1pt} {\kern 1pt} {\kern 1pt} {\kern 1pt} {\kern 1pt} {\rm{exp}}\left\{ { - \frac{{{r^2}}}{{{a^2}{{[1 + \zeta {{(z/a)}^{3/2}}{\rm{tan}}\theta ]}^2}}}} \right\}{\rm{d}}s} \end{array} $ | (28) |
where K0 is the loss rate of the fibre sensor.
Since the size of the fibre end surface is small, the light intensity at the centre of the receiving face can be used as the average light intensity of each receiving fibre surface, then the simplified sensor measurement formula can be written as
| $ V = 6G{R_f}{S_p} \cdot \frac{{S{K_0}{I_0}}}{{{a^2}{{[1 + \zeta {{(z/a)}^{3/2}}{\rm{tan}}\theta ]}^2}}} $ | (29) |
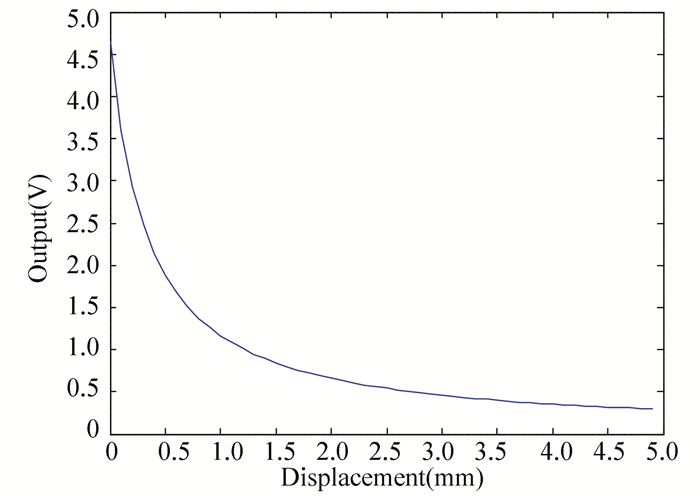
where S is the receiving area of the single fibre. Combined with the fibre bundle design parameters in Table 1, the output character of the CTI type sensor is shown in Fig. 18.
|
Fig.18 Simulation result of the sensor output |
6 Experiment and Results 6.1 Static Measurement Test 6.1.1 Calibration
The helical micro-measuring device was used for the sensor calibration. In the experiment, a plane was pushed to move in the axis direction of the fibre sensor probe. The plane was moved away from 0 to 6 mm before the sensor surface with a step of 0.1 mm. The process and return curve of the sensor are shown in Fig. 19. The process and return calibration experiment were conducted for ten times, and the curve was fitted using the least square method. It can be seen from Fig. 19 that the sensor had a measurement range of about 3 mm, and the calibration results curve was very similar with the simulation result in Fig. 18.

|
Fig.19 Calibration results of the fibre sensor |
6.1.2 Temperature interference experiment
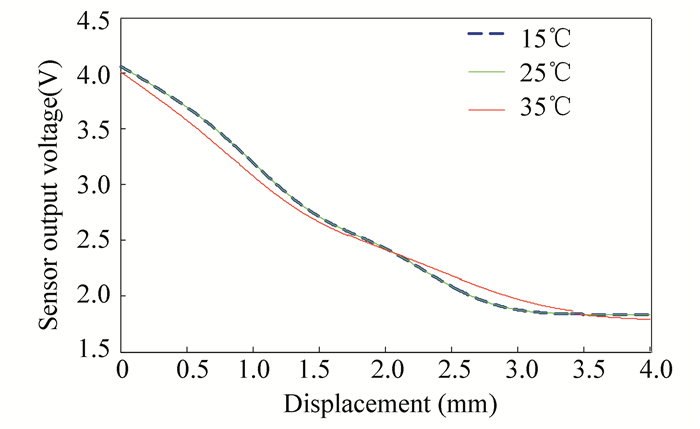
The room temperature was set at 15℃, 25℃, and 35℃, and the output measurement of the sensor at different temperatures was achieved. After repeated measurements, the average value of each set of data at different temperatures was obtained. The least squares fitting results of them are shown in Fig. 20.
|
Fig.20 Fibre sensor output at different temperatures |
From Fig. 20, it can be seen that the output of the sensor system slightly fell in the measurement range of 0-2 mm with the increase of the temperature. Temperature change had certain influence on the measurement result in this experiment. In order to ensure the measurement accuracy, the working environment temperature of photoelectric conversion and amplification filter circuit should be controlled in practical applications.
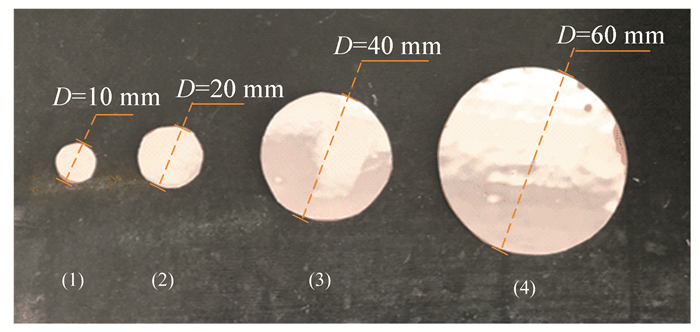
6.1.3 Changes of the measured surface area of the planeThe possible effect of the changes of the measured plane area size on the measurement results was investigated. Four iron sheets with smooth surface were selected as the measurement plane. The iron sheets with different diameters and covered with mirror reflective film are presented in Fig. 21. The measurement experiment was performed as described in Section 6.1.1, and the results are illustrated in Fig. 22.
|
Fig.21 Measured plane with different diameters |

|
Fig.22 Measurement results of the plane with different diameters |
It can be seen that for different measurement plane areas with the same surface shader, the measured plane size had very little effect on the sensor output character.
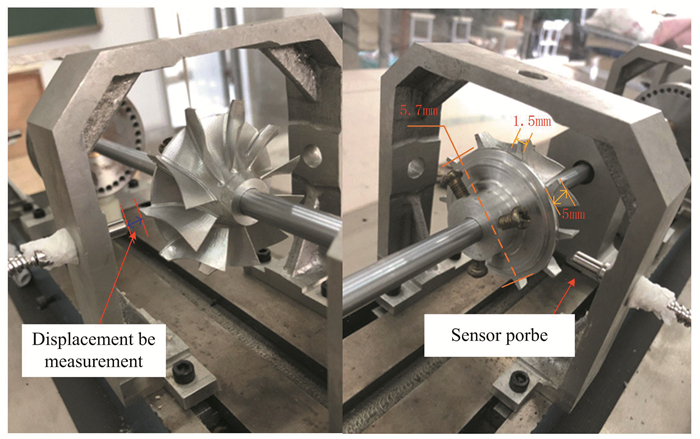
6.2 Dynamic MeasurementThe dynamic measurement experiments were realized on a rotor dynamic test platform as presented in Fig. 23. The sensor probe and the rotor blade tip plane were kept with a distance, and the rotor rotation speed and the frequency of the blade passing before the sensor probe were changed at the same time. The rotor speed was changed to 1000, 2000, and 3000 r/min respectively, and the measurement results are shown in Fig. 24.
|
Fig.23 Platform of the dynamic experiment |

|
Fig.24 Fibre sensor output at different rotor RPM |
The frequencies of the blade passing before the sensor were 0.17, 0.22, and 0.50 kHz. Based on sampling principle, the sample frequency was twice of the blade rotation speed at least to realize the information with no lost. It can be seen that the fibre sensor can achieve the displacement between the blade tip surface and the probe surface completely, as shown in Fig. 24.
7 ConclusionsThe model of multi-structural OFBDS is presented in this paper. Based on the model, influences of the fibre core-radius, the NA, and the axis distance on intensity-modulation characteristic were analysed. Through the light intensity modulation character of different fibre bundle structures under the unified model comparison and analysis, the structure of the fibre displacement sensor probe was selected. Then, the sensor measurement equation and sensor hardware system were designed. In order to test the characteristic of the sensor, static experiment and dynamic experiment were conducted. Results showed that the transducer had excellent static and dynamic characteristics.
| [1] |
Buchoud E, Vrabie V, Mars J I, et al. Quantification of submillimeter displacements by distributed optical fiber sensors. IEEE Transactions on Instrumentation & Measurement, 2016, 65(2): 413-422. DOI:10.1109/TIM.2015.2485340 (  0) 0) |
| [2] |
Chetia D, Basumatary T, Singh H K, et al. Low-cost refractometer with longitudinally displaced optical fibers. IEEE Sensors Journal, 2016, 16(15): 5950-5957. DOI:10.1109/JSEN.2016.2576779 (  0) 0) |
| [3] |
Su J, Dong X, Lu C. Property of bent few-mode fiber and its application in displacement sensor. IEEE Photonics Technology Letters, 2016, 28(13): 1387-1390. DOI:10.1109/LPT.2016.2542366 (  0) 0) |
| [4] |
Kim H H, Choi S J, Yi H, et al. Novel non-contact optical fiber displacement sensor using bidirectional modulation of a Mach-Zehnder electro-optical modulator. Proceedings of 2014 OptoElectronics and Communication Conference and Australian Conference on Optical Fibre Technology. Piscataway: IEEE, 2014, 847-849. (  0) 0) |
| [5] |
Wanninayake I B, Dasgupta P, Seneviratne L D, et al. Modeling and optimizing output characteristics of intensity modulated optical fiber-based displacement sensors. IEEE Transactions on Instrumentation & Measurement, 2015, 64(3): 758-767. DOI:10.1109/TIM.2014.2347694 (  0) 0) |
| [6] |
Puangmali P, Althoefer K, Seneviratne L D. Mathematical modeling of intensity-modulated bent-tip optical fiber displacement sensors. IEEE Transactions on Instrumentation & Measurement, 2010, 59(2): 283-291. DOI:10.1109/TIM.2009.2023147 (  0) 0) |
| [7] |
Jia B, He L, Yan G, et al. A differential reflective intensity optical fiber angular displacement sensor. Sensors, 2016, 16(9): 1508. DOI:10.3390/s16091508 (  0) 0) |
| [8] |
Marzban M, Packirisamy M, Dargahi J. Fiber-mirror integrated compliant mechanical system for measuring force and displacement simultaneously. Proceedings of 2015 Photonics North. Piscataway: IEEE, 2015, 1-8. DOI:10.1109/PN.2015.7292534 (  0) 0) |
| [9] |
Xie S, Zhang X. Design and modeling of three-dimensional tip-clearance optical probe based on two-circle reflective coaxial fiber bundle. Proceedings of 2016 IEEE Sensors, Piscataway: IEEE, 2016, 1-3. DOI:10.1109/ICSENS.2016.7808641 (  0) 0) |
| [10] |
Yuan Libo. Light source and the optical field formed by an optical fiber end. Optical Communication Technology, 1994, 18(1): 54-64. (in Chinese) DOI:10.13921/j.cnki.issn1002-5561.1994.01.012 (  0) 0) |
| [11] |
Cao H, Chen Y, Zhou Z, et al. Theoretical and experimental study on the optical fiber bundle displacement sensors. Sensors and Actuators A: Physical, 2007, 136(2): 580-587. DOI:10.1016/j.sna.2006.12.010 (  0) 0) |
| [12] |
Jia B, He L. An optical fiber measurement system for blade tip clearance of engine. International Journal of Aerospace Engineering, 2017(5): 1-9. DOI:10.1155/2017/4168150 (  0) 0) |
 2020, Vol. 27


