2. China Railway Shanghai Design Institute Group Co., LTD., Shanghai 200070, China;
3. CRRC Tang Shan Co., LTD., Tangshan 063000, China;
4. CRRC Chang Chun Railway Vehicles Co., LTD., Changchun 130062, China
Stainless steel rail lightweight passenger vehicles made of 301L austenitic stainless steel cold-rolled series have been widely used in subways and intercity express trains because of their advantages of high efficiency, safety, and material recyclability[1-2]. Resistance spot welding (RSW) is the main welding method of vehicle manufacturing due to its good weld ability[3-5]. The major part of a car body is stainless steel RSW structure[6-8], but there are some welded structures of dissimilar austenitic stainless steel and mild steel in the vehicle body[9]. Among various alternative dissimilar steel welding methods, RSW is a better choice to improve mechanical properties and reduce manufacturing costs[10-11]. The geometrical shape of the RSW joint is asymmetrical[12], while the mechanical properties in partial area are diverse due to the differences in electrical resistivity and thermal conductivity between dissimilar base metals[13]. The differences in tensile fracture mode result from the competition between the maximum stress at the edge of the nugget and the shear stress at the nugget interface[14-15]. The evolution process of the tensile deformation has been simulated, and numerical studies have investigated the influence of each part of the spot welding structure on the strength, stiffness, and fracture plasticity of specimens. Welding experiments have been conducted to study effects of welding conditions on nugget size and mechanical properties. Yuan et al.[16] found that the failure mode of DP600/DC54D alloy changes from interface fracture to pull-out fracture and tensile shear strength increases with the increase of RSW heat input. However, when the heat input exceeds a critical value, the tensile shear strength decreases. In addition, the position of pull-out fracture depends on the work hardening ability of the base metal[17]. The spot welding structure has a notch effect[18] and the lap joint interface is concealed. The stress concentration leads to the complexity of the stress and strain distribution. In this study, ABAQUS finite element software was used to simulate the fracture process of 301L/Q235B dissimilar steel resistance spot welded joints, and the influence of the joint structure on mechanical properties was studied.
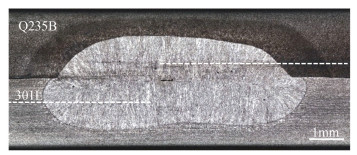
2 Structure of 301L/Q235B Dissimilar Steel Resistance Spot Welded JointTwo groups of 2.0 mm thick austenitic stainless steel and carbon steel 301L-DLT/Q235B resistance spot welded specimens were prepared, whose chemical compositions and mechanical properties are given in Table 1. The welding process parameters of the spot welding test are listed in Table 2. The outer sheet surfaces of the 301L-DLT stainless steel and the Q235B carbon steel of the two groups are both relatively flat, and the solder joint dents are shallow. Fig. 1 shows the resistance spot welded joint. The diameter of the nugget on the Q235B side was smaller than that on 301L because the electrical resistivity of stainless steel is about 4 times larger than that of carbon steel, while the thermal conductivity is only 1/3 of that of carbon steel. Besides, the unbalanced electric heating in the two welded plates also leads to the larger nugget diameter on the 301L side. The nugget diameter and the penetration rate in the 301L/Q235B welding joints of the two processes are listed in Table 2. It can be found that for the same welded joint, the nugget diameter and the penetration rate on the 301L side were both larger than those on the Q235B side.
| Table 1 Chemical composition and mechanical properties of the test plates |
| Table 2 Spot welding process parameters, nugget diameter, and penetration rate in 301L-DLT and Q235B plates |

|
Fig.1 Image of 301L/Q235B steel resistance spot welded joint |
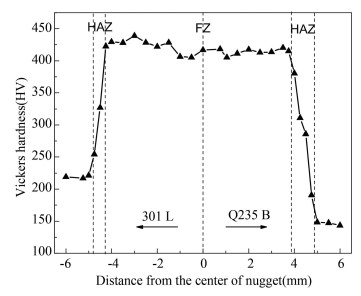
The Vickers hardness value of each part of the spot welded joint was measured near the bonding surface. The measuring path is shown in Fig. 1 represented by the dotted line, which was loaded with 500 g for 15 s. Fig. 2 shows the Vickers hardness distribution of the welded joint. Due to the precipitation of a large amount of Cr carbide, the highest hardness value of the specimen occurred on the nugget area. The average hardness of the nugget area was 419 HV, the hardness of the 301L stainless steel base material was 219 HV, and the average hardness of the heat affected zone was 335 HV. The hardness of the Q235B low carbon steel base material was 146 HV, and the average hardness of the heat affected zone was 289 HV.

|
Fig.2 Hardness distribution of 301L/Q235B steel resistance spot welded joint |
3 Mechanical Properties of Tensile Shear
Tensile shear test was performed on the two specimens, and each was subjected to three repeated tests. The load-displacement curves and the fracture modes of the specimens are shown in Fig. 3. The linear elastic regime of the two curves coincided, but the plastic deformation was obviously different due to different nugget sizes. Specimen 2 has a larger nugget, so it can withstand larger fracture load and plastic deformation, and the failure mode was the nugget pull-out fracture in the 301L plate. Since Specimen 1 has a smaller nugget, it had lower breaking load and displacement, and the failure mode was interfacial fracture.

|
Fig.3 Force-displacement curve and failure mode of the spot welded joint |
Failure mode is the result of the shear stress of the weld joint nugget interface and the tensile stress of the weld nugget in the circumferential direction[19]. Nugget diameter has great influences on overload performance and failure mode. The relationship between the load and the nugget diameter of the specimens in interfacial failure mode is expressed in Eq. (1), and that in pull-out failure mode is described in Eq. (2). When the two fracture modes reach an equilibrium value, the nugget diameter of the welded joint at this time is the critical nugget diameter, as shown in Eq. (3)[20].
| $ {P_f} = 1.25{K_c}{d^{(5/2)}}/t $ | (1) |
| $ {P_f} = td{\sigma _f} $ | (2) |
| $ {d_{cr}} = 0.86{\left( {{\sigma _f}/{K_c}} \right)^{2/3}}{t^{4/3}} $ | (3) |
where Pf is the maximum failure load, d is the nugget diameter on the Q235B side, t is the plate thickness of 2.0 mm, Kc is the fracture toughness of the nugget material, σf is the failure stress of the tensile, and dcr is the critical nugget diameter. The test data of Specimen 1 was calculated in Eq. (1) to obtain
Simulation analyses of stress and strain distribution of Specimen 2 with larger nugget were performed using ABAQUS software. Due to the symmetrical welding structure, a 1/2 model was used. Material properties of each area in the spot welded joints were calculated based on the measured hardness values[21]. The mechanical properties of the heat affected zone and the nugget zone of the 301L/Q235B spot welded joints are presented in Table 3. One end of the specimen was fully constrained, and the other side was full of constraints except for the loading direction. The finite element model mesh of the spot welded specimen is displayed in Fig. 4.
| Table 3 Mechanical properties of different areas of 301L/Q235B base metal and spot welded joint |

|
Fig.4 Finite element model of spot welded specimen |
After applying a load to the spot welded specimen, the actual deformation of the specimen and the finite element simulation of the tensile deformation were compared and found consistent, as illustrated in Fig. 5. Fig. 6 shows the comparison between the simulated force-displacement curve and the experimental tensile curve. The simulation results agreed well with the experimental curve. Fig. 5 and Fig. 6 demonstrate the accuracy of the finite element model, which can reflect the stress and strain distribution of each region of the joint welding process and the evolution of fracture.

|
Fig.5 Comparison of finite element simulation tensile deformation and actual tensile deformation of spot welded specimen |

|
Fig.6 Finite element simulation tensile curve and actual tensile curve of spot welded specimen |
4.2 Analysis of Tensile Fracture Mode
In the static tensile test of the spot welded joint, different fracture failure modes are the result of the competition between the interfacial fracture driving force of the spot welded joint and the driving force of the nugget pull-out fracture. The finite element analysis of the driving force of different fracture modes of the spot welded joint can more accurately reflect the failure process of the weldment. Stress S12 is the driving force of the nugget interface fracture, and S11 is the driving force of the pull-out fracture. When the finite element stress S11 of the weldment reaches the critical driving force before S12, the spot welded joint is pull-out fracture, and otherwise interface fracture occurs. Fracture mode finite element analysis was performed on Specimen 2 and critical nugget dQ235B=7.12 mm.
The stress distribution of 2.0 mm+2.0 mm critical nugget diameter spot welded joints S11 and S12 is shown in Fig. 7. S11 is the critical driving force for the pull-out fracture, and S12 is the critical driving force for the interface fracture. The stress distributions of welded joints S11 and S12 in Specimen 2 are presented in Fig. 8. By comparing the stress values in Fig. 7 and Fig. 8, it can be seen that the value of the pull-out fracture driving force S11 of Specimen 2 spot welded joints was greater than that of the critical driving force S11, and the value of the interface fracture driving force S12 was smaller than that of the critical driving force S12. Simulation results show that the driving force of the pull-out fracture of Specimen 2 was prior to that of the interface fracture to reach the corresponding critical driving force. The spot welded joint was pull-out fracture failure mode, which was consistent with the static tensile test failure mode. Therefore, this model can be used to determine the fracture failure mode of the 2.0 mm+2.0 mm spot welded joint static tensile test.

|
Fig.7 Critical driving force of the 2.0 mm+2.0 mm spot welded joint |

|
Fig.8 Driving force of the 2.0 mm+2.0 mm spot welded joint |
4.3 Equivalent Stress and Strain Analysis
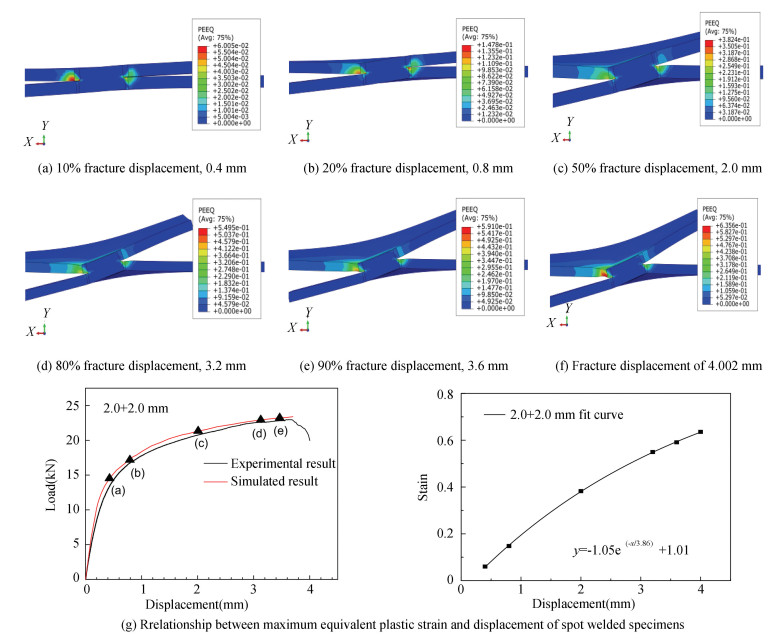
Specimen 2 was subjected to a tensile process analysis. Figs. 9(a)-(f) show the equivalent plastic strain of Specimen 2 under different loads during the stretching process, in which the upper plate is Q235B and the lower plate is 301L, and the final fracture position of the specimen is presented in Fig. 9(f). The fracture displacement and the maximum Q235B equivalent plastic strain were 4.002 mm and 0.635, respectively. When 10% fracture displacement (0.4 mm) was applied as shown in Fig. 9(a), the specimen was in the transitional stage from elastic deformation to plastic deformation. The equivalent plastic strain was mainly concentrated in the gap region of the Q235B plate lap joint, and the plastic strain was 0.060, which was about 9% of the equivalent strain of the fracture. When the displacement increased to 20% fracture displacement (0.8 mm) as shown in Fig. 9(b), the specimen entered the plastic deformation stage, and the equivalent plastic strain began to expand along the lap joint into the nugget. When the displacement increased to 50% fracture displacement (2.0 mm) as shown in Fig. 9(c), the plastic deformation region of the Q235B plate was obviously increased, the strain region in the 301L plate and the interface nugget did not change significantly, while the strain and the opening angle of the two plates both increased. When the displacement continued to increase to 80% fracture displacement (3.2 mm) as shown in Fig. 9(d), the necking of the Q235B base material began to appear, and a small amount of necking occurred at the junction of the 301L plate heat affected zone and the base metal. When the displacement increased to 90% fracture displacement (3.6 mm) as shown in Fig. 9(e), the tensile deformation of the Q235B plate occurred in a large area through the thickness of the plate. The plastic deformation zone of the heat affected zone did not penetrate the plate thickness due to its high hardness value. The plastic deformation region of the 301L plate did not change significantly. When the displacement increased to the fracture displacement value of 4.002 mm as shown in Fig. 9(f), the plastic strain value was the largest at the junction of the Q235B base material and the heat affected zone, and the Q235B plate base material was significantly necked. Fig. 9(g) shows the relationship between the maximum equivalent plastic strain and the tensile displacement of Q235B during tensile evolution. The maximum equivalent plastic strain increased exponentially with the increase of tensile displacement.

|
Fig.9 Equivalent plastic strain distribution of 2.0 mm+2.0 mm specimen tensile process |
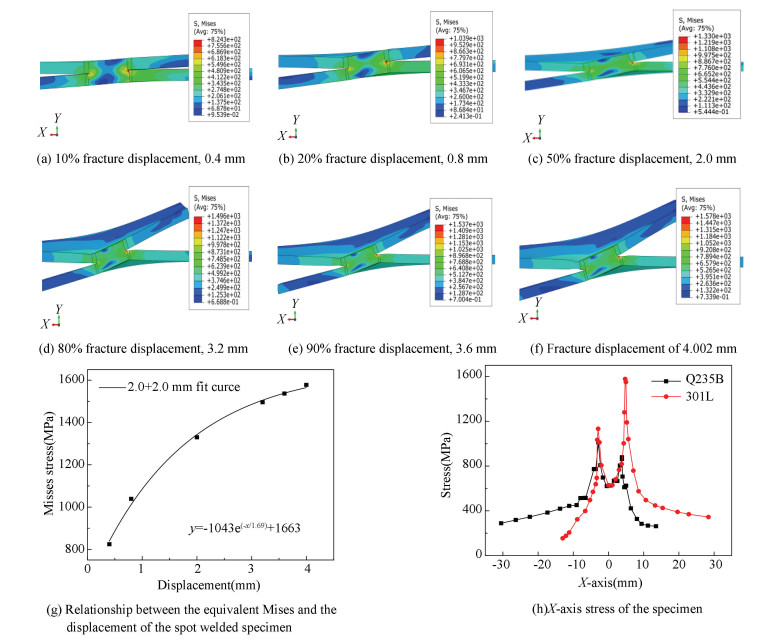
The equivalent Mises stress evolution processes of the spot welded specimens are displayed in Figs. 10(a)-(f), and the final fracture under tensile shear load is shown in Fig. 10(f). The Mises stress value was 1578 MPa, and the maximum value occurred at the edge of the nugget on the displacement side of the 301L stainless steel. The Mises stress of the specimen increased with increasing tensile displacement (Figs. 10(a)-(f)), and the deformation angle of the lap joint surface of the two plates also increased. These factors led to the rotational deformation, and stress concentration and large plastic deformation occurred in the nugget. The ability of the nugget to bear the load was reduced, so that the edge of the stainless steel nugget became a dangerous part and the pull-out fracture occurred, which was consistent with the test results. Stress evolution mainly depends on two factors: displacement load and bending stress. Displacement load caused the necking deformation of the specimen, whereas bending stress led to the rotational deformation of the nugget. The fracture mode of the specimen was affected by two kinds of stresses. Fig. 10(g) shows the relationship between the maximum equivalent Mises stress of the nugget edge of the 301L plate and the displacement during the stretching process. The equivalent Mises stress increased exponentially with increasing tensile displacement. The stress distribution along the X-axis (plate length) of the lap joint surface of the specimen is shown in Fig. 10(h). The stress value of the nugget on the left side in the Q235B plate was greater than that on the right side, and the stress value of the nugget on the right side in the 301L plate was greater than that on the left side. The maximum stress on the 301L side was greater than that on the Q235B side, whose stress concentration phenomenon was more serious. Therefore, failure always occurs from the side where the displacement load is applied. Fracture first occurred at the edge of the nugget of the 301L plate, and then the nugget was pulled out along the fusion line.

|
Fig.10 Evolution of Mises stress in spot welded specimen |
5 Conclusions
1) The nugget shape of the 301L/Q235B dissimilar steel was asymmetric. The stainless steel sheet generated more resistance heat than the carbon steel side, but its heat dissipation was slow. The nugget diameter of the 301L side was larger than that of the carbon steel. The Micro Vickers hardness test showed that the hardness value of the nugget zone was the highest, the hardness of the heat affected zone was the second, and the hardness of the base material zone was the lowest.
2) Two kinds of failure mode of the 301L/Q235B dissimilar steel resistance spot welded specimens were studied, i.e., interface fracture and 301L side nugget pull-out fracture. The critical nugget sizes of different failure mode transitions were 7.12 mm and 7.81 mm in the carbon steel side and the stainless steel side, respectively. Specimens of the pull-out fracture failure mode had high load-bearing capacity, good plastic deformation ability, and good nugget mechanical performance, which can improve the mechanical properties of the welding structure. In engineering applications, it is desirable that the nugget diameter on the Q235B side is greater than 7.12 mm, and that of the 301L side is greater than 7.81 mm.
3) According to the finite element simulation analysis, the driving force S11 of the spot welding head pull-out fracture mode reached the corresponding critical driving force before the driving force S12 of the interface fracture, which resulted in the spot welded joint being pulled out with fracture failure. The elastic phase accounted for about 10% of the tensile failure process of the specimen, and the plastic strengthening phase accounted for about 90% of the failure process of the specimen, which was the main stage of the failure process of the specimen. The stress and strain of the specimen failure process increased exponentially with the increase of displacement. The stress value at the edge of the nugget on the displacement load side of the 301L stainless steel was the largest, and the stress concentration was obvious. References
| [1] |
Jaxa-Rozen W. Cold-worked austenitic stainless steels in passenger railcars and in other applications. Thin-Walled Structures, 2014, 83: 190-199. DOI:10.1016/j.tws.2014.01.027 (  0) 0) |
| [2] |
Zhan L, Shi C Y. Mechanical properties of SUS301L stainless steel welded joints for railway vehicles. Advanced Materials Research, 2012, 503-504: 441-445. DOI:10.4028/www.scientific.net/amr.503-504.441 (  0) 0) |
| [3] |
Martín Ó, De Tiedra P, López M, et al. Quality prediction of resistance spot welding joints of 304 austenitic stainless steel. Materials & Design, 2009, 30(1): 68-77. DOI:10.1016/j.matdes.2008.04.050 (  0) 0) |
| [4] |
Liu W, Sun C, Xu X, et al. The influences of nugget diameter on the mechanical properties and the failure mode of resistance spot-welded metastable austenitic stainless steel. Materials & Design, 2012, 33(1): 292-299. DOI:10.1016/j.matdes.2011.06.071 (  0) 0) |
| [5] |
Shi C Y, Li L, Wang H X, et al. Numerical analysis for the characteristics of stress distribution on lap laser welding joint of stainless sheet steel. Advanced Materials Research, 2012, 472-475: 1192-1196. DOI:10.4028/www.scientific.net/AMR.472-475.1192 (  0) 0) |
| [6] |
Liu W, Fan H, Guo X, et al. Mechanical properties of resistance spot welded components of high strength austenitic stainless steel. Journal of Materials Science & Technology, 2016, 32(6): 561-565. DOI:10.1016/j.jmst.2015.11.023 (  0) 0) |
| [7] |
Fujii T, Tohgo K, Suzuki Y, et al. Fatigue strength and fatigue fracture mechanism of three-sheet spot weld-bonded joints under tensile-shear loading. International Journal of Fatigue, 2016, 87(6): 424-434. DOI:10.1016/j.ijfatigue.2016.02.023 (  0) 0) |
| [8] |
Behravesh S B, Jahed H, Lambert S. Fatigue characterization and modeling of AZ31B magnesium alloy spot-welds. International Journal of Fatigue, 2014, 64(6): 1-13. DOI:10.1016/j.ijfatigue.2014.01.026 (  0) 0) |
| [9] |
Liu Y L, Sun Y B, Sun Y, et al. Rapid fatigue life prediction for spot-welded joint of SUS301L-DLT stainless steel and Q235B carbon steel based on energy dissipation. Advances in Mechanical Engineering, 2018, 10(11): 1-11. DOI:10.1177/1687814018811013 (  0) 0) |
| [10] |
Martinsen K, Hu S J, Carlson B E. Joining of dissimilar materials. CIRP Annals - Manufacturing Technology, 2015, 64(2): 679-699. DOI:10.1016/j.cirp.2015.05.006 (  0) 0) |
| [11] |
Kang J D, Rao H M, Sigler D R, et al. Tensile and fatigue behavior of AA6022-T4 to IF steel resistance spot welds. Procedia Structural Integrity, 2017, 5: 1425-1432. DOI:10.1016/j.prostr.2017.07.207 (  0) 0) |
| [12] |
Hasanbaşgǧlu A, Kaçar R. Resistance spot weldability of dissimilar materials (AISI 316L-DIN EN 10130-99 steels). Materials & Design, 2007, 28(6): 1794-1800. DOI:10.1016/j.matdes.2006.05.013 (  0) 0) |
| [13] |
Marashi P, Pouranvari M, Amirabdollahian S, et al. Microstructure and failure behavior of dissimilar resistance spot welds between low carbon galvanized and austenitic stainless steels. Materials Science and Engineering: A, 2008, 480(1-2): 175-180. DOI:10.1016/j.msea.2007.07.007 (  0) 0) |
| [14] |
Chuko W, Gould J. AISI/DOE Technology roadmap program: Development of appropriate resistance spot welding practice for transformation-hardened steels. Welding Journal, 2002, 81(1): 1-7. DOI:10.2172/797407 (  0) 0) |
| [15] |
Sun X, Stephens E V, Khaleel M A. Effects of fusion zone size and failure mode on peak load and energy absorption of advanced high strength steel spot welds under lap shear loading conditions. Engineering Failure Analysis, 2008, 15(4): 356-367. DOI:10.1016/j.engfailanal.2007.01.018 (  0) 0) |
| [16] |
Yuan X, Li C, Chen J, et al. Resistance spot welding of dissimilar DP600 and DC54D steels. Journal of Materials Processing Technology, 2017, 239: 31-41. DOI:10.1016/j.jmatprotec.2016.08.012 (  0) 0) |
| [17] |
Alizadeh-Sh M, Marashi S P H. Resistance spot welding of dissimilar austenitic/duplex stainless steels: Microstructural evolution and failure mode analysis. Journal of Manufacturing Processes, 2017, 28(Part 1): 186-196. DOI:10.1016/j.jmapro.2017.06.005 (  0) 0) |
| [18] |
Adib H, Jeong J, Pluvinage G. Three-dimensional finite element analysis of tensile-shear spot-welded joints in tensile and compressive loading conditions. Strength of Materials, 2004, 36(4): 353-364. DOI:10.1023/B:STOM.0000041536.03924.d4 (  0) 0) |
| [19] |
Deng X, Chen W, Shi G. Three-dimensional finite element analysis of the mechanical behavior of spot welds. Finite Elements in Analysis & Design, 2000, 35(1): 17-39. DOI:10.1016/s0168-874x(99)00053-0 (  0) 0) |
| [20] |
Chao Y J. Failure mode of spot welds: Interfacial versus pullout. Science and Technology Weld & Joining, 2003, 8(2): 133-137. DOI:10.1179/174329313X13789830157267 (  0) 0) |
| [21] |
Lee J, Asim K, Pan J. Modeling of failure mode of laser welds in lap-shear specimens of HSLA steel sheets. Engineering Fracture Mechanics, 2011, 78(2): 374-396. DOI:10.1016/j.engfracmech.2010.10.011 (  0) 0) |
 2020, Vol. 27


