After Kobe Earthquake and Northridge Earthquake occurred in the 1990s, scholars from all over the world have launched a series of research on composite beam-concrete column frame[1-2]. Compared with traditional concrete column, compound spiral hoop reinforced concrete (CSHRC) column has the advantages of constructional convenience, higher strength, and better ductility[3]. The structure form consisting of steel-concrete composite beam-CSHRC column can take full advantages of steel and concrete material. The frame of this structure form already found applications in luggage Baigou international city building in Gao Beidian city, China. Moreover, in order to reduce the story height of building, composite beam with web opening is used in real conditions with the goal to let pipes of equipment easily pass beam[4-5]. A new hybrid structure form, consisting of castellated composite beam and CSHRC column, has good seismic performance and broad future prospects. To popularize structural form in real conditions, the castellated composite beam-CSHRC column connection should be investigated.
At present, there is less study on castellated composite beam-CSHRC column connection. The research findings from the related connection, such as composite beam-concrete column connection, castellated composite beam-concrete column connection, and steel beam-concrete column connection, offer the references[6-9]. Li and Han[10] conducted experimental study on the seismic behavior of the circular concrete filled steel tubular column-steel beam connection. Moreover, based on the test results, Li and Han[11] set up finite element models of the connection. The parametric analysis on the composite connection was conducted, and the results showed that both the slab thickness and steel ratio of the column have significant influence on the failure mode of the connection, while the slenderness ratio and the external diaphragm plate dimension have minor influence. Parra-Montesinos and Wight conducted experiments on the steel beam-reinforced concrete column connections consisting of core zone concrete, U shaped stirrups, and facing bearing plates[12]. The results show that the connection can maintain their strength at large levels of story drift and is suitable for use in high seismic area. Nie et al.[13] conducted experimental studies on flexural capacity of steel beam-concrete-filled steel square tubular columns with inner diaphragms connections. Nie et al.[14] performed finite element analysis (FEA) on seismic behavior of concrete-filled square steel tubular columns and composite beams connections. Fan et al.[15] tested the three-dimensional composite beams-concrete filled square steel tubular column connection. Shen and Gu[16] performed numerical simulation on steel beam-concrete column connection in ANSYS environments. Both material nonlinear constitutive relations and concrete behavior of cracking and crushing were taken into account.
Based on the research findings from the related connection, the following castellated composite beam-CSHRC column connection is presented. In the core zone of the connection, the U-shaped stirrups crossed the beam-web to ensure the shear capacity of the core zone, while the short steel plate hoops of column were set at the beam top and bottom flanges position. Both I-steel beam and beam reinforcements crossed the column. In order to study the mechanical properties of the connection, two reduced scale connection specimens were tested. Then the nonlinear FEA under cyclic loading was conducted in ANSYS environments.
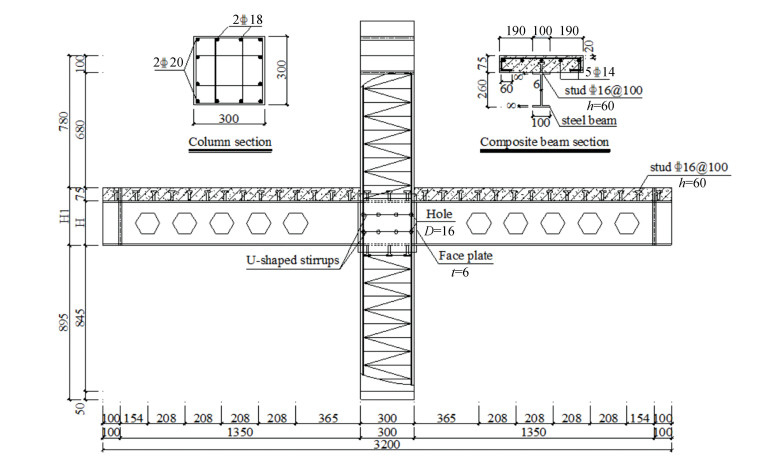
1 Test Overview 1.1 Test SpecimensLJD01 and LJD02 were designed to carry out the work. Member design and joint detailing was made in accordance with current design code GB50017-2017. Two steel beams of specimens were H240×100×6×8 and H260×100×6×8, with an expansion ratio of 1.2 and 1.3, respectively. According to China Code GB50017 (2017), the concrete strength grade for column and beam was C50 and C35, respectively, and the corresponding axial compressive strength were equal to 35.55 and 27.63 MPa, respectively. The strength grade of steel beam was Q235. The yield strength of the 5 mm-diameter spiral stirrups was equal to 1181.57 MPa. In order to avoid bond slippage between concrete slab and steel beam, the grade 4.6 headed stud shear connectors with 16 mm diameter and 60 mm height were used. The shear capacity of a single stud based on GB code was equal to 50.5 kN. The strength grade of longitudinal reinforcements was HRB400. Fig. 1 shows the detailing arrangements for LJD01 and LJD02.
|
Fig.1 Detail of specimens (unit: mm) |
1.2 Test Set Up and Loading Law
The loading devices include reaction wall, actuator, sensor, hydraulic jack, spherical hinge, and so on. The beam end was supported by steel tube which was pinned on the ground. In the test, axial compression load of 1130 kN was applied at the top of the column, then low-cycle reversed horizontal loads were imposed. Before the connection specimens yielded, force-controlled loading method was used, while displacement-controlled loading was adopted after the specimens' yield.
2 Modeling TechniquesThe geometrical and physical parameters of the models were consistent with those of the experimental specimens. The expansion ratio K was defined as the ratio of the castellated beam height H to the original steel beam height h, the first web opening L was defined as the distance between the center of the first web opening and the edge of the column. h in two models was equal to 200 mm. L was equal to 300 and 365 mm, respectively, corresponding to K of 1.2 and 1.3, respectively. The beam length and column height were 3200 and 2200 mm, respectively. The width of the composite beam was 480 mm. The strength grade of composite beam concrete was C35. The section area of column longitudinal reinforcements, stirrups, and longitudinal reinforcements of composite beam, denoted as As1, Asv, and As2, were equal to 3290.7, 981.3, and 769.3 mm2, respectively. The main dimensions and configurations of the finite element models are listed in Table 1.
| Table 1 Finite element models of the connection method |
2.1 Stress-Strain Relationship of Materials
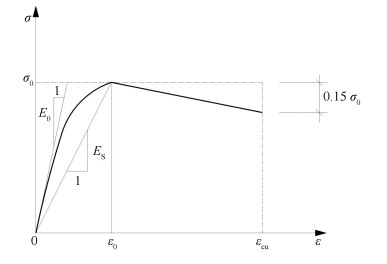
Concrete axial compressive strength was determined by cubic specimen test, while the yield strength and tensile strength for steel plate come from material tensile test. Stress-strain relationship behavior of concrete was defined by Eq. (1) and Eq. (2). The rising stage of uniaxial stress-strain curve of concrete was based on the formula according to China Code GB50010(2010), while the decline stage was calculated by using Hongnestad's method.
| $ \begin{array}{c} \text { If } \varepsilon_{\mathrm{c}} \leqslant \varepsilon_{0}, \sigma_{\mathrm{c}}=f_{\mathrm{c}}\left[1-\left(1-\frac{\varepsilon_{\mathrm{c}}}{\varepsilon_{0}}\right)^{n}\right] \end{array} $ | (1) |
| $ \text { If } \varepsilon_{0} \leqslant \varepsilon_{\mathrm{c}} \leqslant \varepsilon_{\mathrm{cu}}, \sigma_{\mathrm{c}}=f_{\mathrm{c}}\left[1-0.15\left(\frac{\varepsilon_{\mathrm{c}}-\varepsilon_{0}}{\varepsilon_{\mathrm{cu}}-\varepsilon_{0}}\right)\right] $ | (2) |
where fc denotes design compressive strength of concrete, σc denotes compressive stress of concrete, εc denotes compressive strain of concrete, ε0 denotes compressive strain when concrete compressive stress reaches fc, εcu denotes ultimate compressive strain of concrete, n= 2, ε0 = 0.002, and εcu = 0.0033.
William-Wamke failure criteria for concrete were chosen to simulate cracking of the concrete. In order to get converged results, open crack shear transfer coefficient βt, close crack shear transfer coefficient βc, and stress release coefficient Tc were taken as 0.35, 0.95, and 0.6, respectively. Parameter uniaxial compressive strength was taken as -1 without considering the crushing behaviour of concrete.
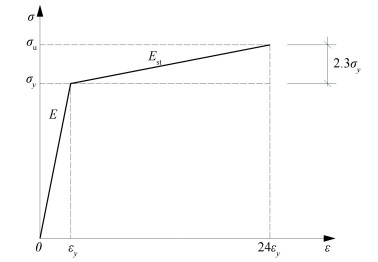
As for steel, the von Mises criterion was chosen to simulate the yielding of steel. The bilinear kinematic hardening model was used, which could consider the Bauschinger effect. The stress-strain curves of concrete and steel are shown in Figs. 2 and 3, respectively. In the figures, σ0 denotes compression strength of concrete, E0 denotes elastic modulus of concrete, Es denotes tangent modulus of concrete, εy denotes yield strain of steel, σy denotes yield stress of steel, σu denotes ultimate stress of steel, E denotes elastic modulus of steel, and Est denotes plastic modulus of steel. The material parameters of the steel used in the finite element model are listed in Table 2.
|
Fig.2 Stress-strain curve of the concrete |
|
Fig.3 Stress-strain curve of the steel |
| Table 2 Material parameters of the steel |
2.2 Element Type and Mesh Generation
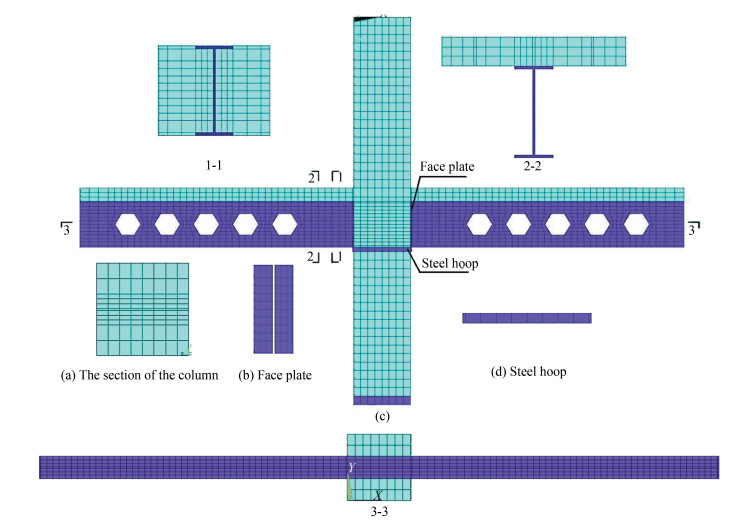
Solid 65 element is capable to consider cracking, crushing of the concrete, and the restraint of stirrup. The confined concrete behaviour can be predicted by the weight percentage and material constitutive model of stirrup. It was used to simulate column and beam concrete. For core zone concrete confined by U shaped stirrups, solid 65 elements with different parameters of stirrup weight percentage were used to simulate the concrete behaviour. Solid 45 element was used to section steel. In order to clearly figure out the stress distribution of beam longitudinal reinforcements, Link 8 element was used to simulate the longitudinal reinforcements. Connection components, including short steel plate hoop, stiffened plate, and steel beam with web opening, must be divided into certain layers in order to get mapped meshing, as listed in Table 3. The meshing size was taken as 50 mm, and the element size of connection core zone was taken as 30 mm. The connection finite element model is shown in Fig. 4.
| Table 3 Number of elements |
|
Fig.4 Meshing of finite element model |
2.3 Boundary Conditions and Load Applications
The constraint conditions of finite element models are as follows. Translational constraints in X, Y, and Z directions were applied to a row of nodes at center line of column bottom in order that the column bottom was maintained to rotate around the midline. To prevent column from translational motions out of plane, Y direction translational constraints were applied to the nodes at the top of the column. Displacement constraints along Y and Z directions were applied to the nodes at beam end, allowing the rotation of the beam ends.
Axial compression load of 1130 kN was applied at the top of the column, then X direction displacement was applied to the nodes at column top. The displacement value should be the same as the value from the test. The yielding deformation Δy for LJD01 and LJD02 were equal to 14.98 and 15.49 mm, respectively. Before solving the results, the analytical type was set to be static analysis, the automatic time step was opened, and the large deformation effect of the structure should be considered.
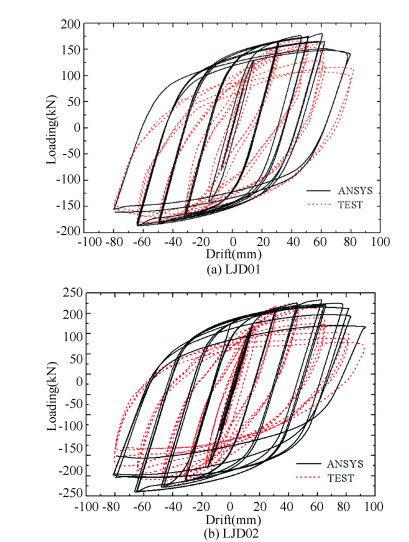
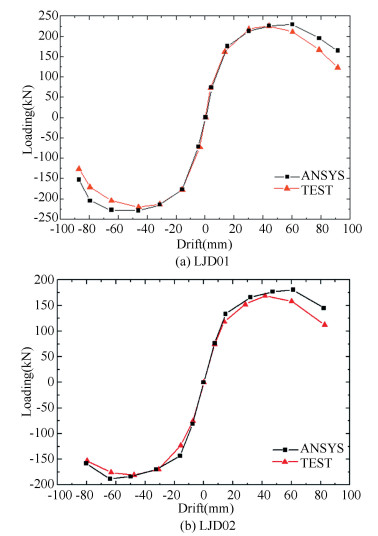
3 Finite Element Model Analysis 3.1 Comparison of Hysteretic and Skeleton Curves of ConnectionNonlinear FEA on the connection models was conducted in ANSYS environment. The hysteretic and skeleton curves from both test and numerical simulations of specimen LJD01 and LJD02 are shown in Figs. 5 and 6, respectively. As for specimen LJD01, when the horizontal load on the column top reached 182 kN, the corresponding displacement on the column top was 44.9 mm, while the horizontal load and displacement of model LJD01 from the numerical simulation was equal to 194.52 kN and 64.8 mm. As for specimen LJD02, when the horizontal load on the column top reached 227 kN, the corresponding displacement on the column top was 47.7 mm, while the horizontal load and displacement of model LJD02 from the numerical simulation was equal to 229.13 kN and 65.2 mm. Obviously, hysteretic curves from simulation show an ideal spindle shape and agree well with those from the test. Skeleton curves from simulation coincide well with those from the test.
|
Fig.5 Comparison of hysteretic curves from the test and the simulation |
|
Fig.6 Comparison of skeleton curves from the test and the simulation |
In order to clearly find the difference between test and numerical simulation, skeleton curves were used to determine the yield point. Besides, yield moment method was adopted for the curves without clear yield point. According to China Code GB50017- 2017, the design value of ultimate bending moment of concrete composite beams is as follows:
| $ \begin{aligned} M_{\mathrm{u}}=M_{\mathrm{s}} +A_{\mathrm{s}} f_{\mathrm{st}}\left(y_{3}+y_{4} / 2\right) \end{aligned} $ | (3) |
| $ M_{\mathrm{s}} =\left(S_{1}+S_{2}\right) f $ | (4) |
where Ms is the bearing capacity of the steel beam, S1 and S2 are the area moments of the steel beam at the interface above and below the neutral axis, Ast is the section area of the longitudinal reinforcement within the effective width of the concrete flange in the negative bending moment section, fst is the design value of the tensile strength of the reinforcement, y3 is the distance from the centroid of the longitudinal reinforcement section to the plastic neutral axis of the composite beam, and y4 is the distance from the plastic neutral axis of the composite beam to the plastic neutral axis of the steel beam.
In the test, the strain values of supporting steel tube at beam ends were recorded, and the reaction forces applied to beam ends can be calculated accordingly. Then the bending moments at the beam cross section near column face can be obtained by multiplying the reaction forces by the outstanding beam length. In the numerical simulation, the reaction forces of the beam end were read directly, then the reaction forces were multiplied by the outstanding beam length and the beam moment at column face can be figured out. As for specimen LJD01, the bearing capacity of the positive moment and negative moment at the support were 106.2 kN·m and 92.5 kN·m, respectively; the bearing capacity of the positive moment and negative moment at the first web opening were 82.0 kN·m and 71.4 kN·m, respectively. As for LJD02, the bearing capacity of the positive moment and negative moment at the support were 116.2 kN·m and 101.5 kN·m, respectively; the bearing capacity of the positive moment and negative moment at the first web opening were 89.7 kN·m and 78.3 kN·m, respectively. The yield bending moment My and ultimate bending moment Mu from test, design code, and FEA are listed in Tables 4-5 (θu denotes the ultimate angle at the edge of beam, K0 denotes the elastic stiffness). As for LJD01, the yield bending moment from the test was equal to 112.6 kN·m, while that from the numerical simulation and design code were equal to 121.5 and 92.5 kN·m, respectively. Different from the test result, the deviation of the numerical simulation and design value were 7.9% and 17.9%, respectively. When the drift was larger than 3Δy, which was referred to as 45 mm, the deviation between test and numerical simulation started to increase. The reason is that concrete crushing is neglected during numerical simulation. Besides, it is found that the test value is much greater than the value based on design code, indicating that the design code is relatively safe.
| Table 4 Comparison of loads from the test and the simulation |
| Table 5 Comparison of deviation from the test and the simulation |
3.2 Comparison of Von Mises Strain Values
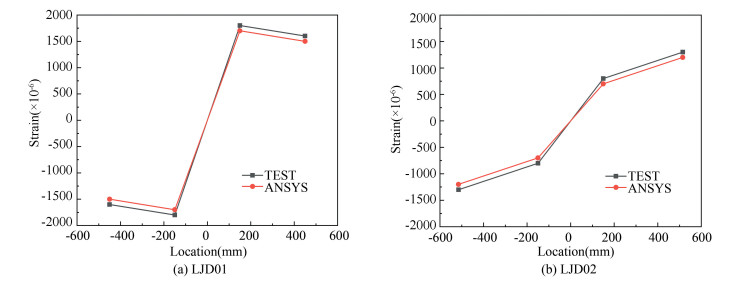
For specimen LJD01 at the beam cross section with 150 mm and 450 mm away from the column center line and specimen LJD02 at the beam cross section with 150 mm and 515 mm far away from the column center line, strain gauge rosettes were set and located at beam web with 8 mm away from beam bottom flange. With 16 mm lateral displacement applied on the column top, the von Mises strain values of steel web from both test and FEA are shown in Fig. 7. Obviously, the von Mises strain values of beam web from FEA coincide well with those from the test.
|
Fig.7 Comparison of strain from the test and simulation |
3.3 Deformation and Failure Mode
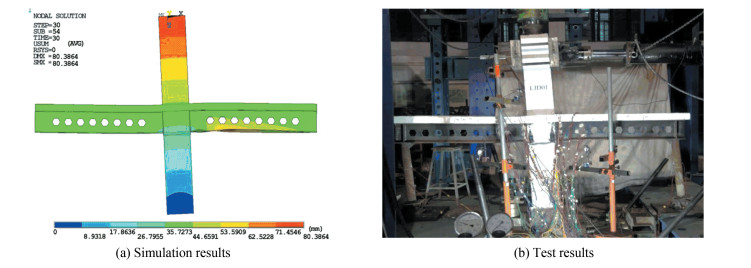
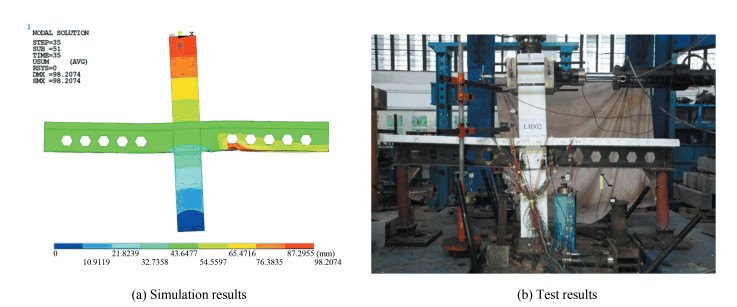
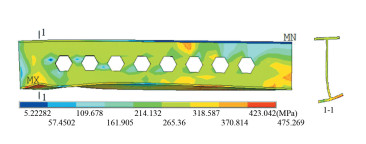
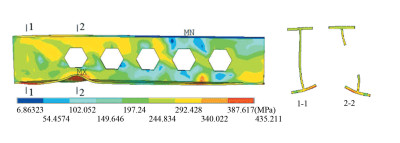
When the displacement at the top of column LJD01 and LJD02 reached 80.4 mm and 98.2 mm, deformation diagrams of LJD01 and LJD02 from simulation are shown in Figs. 8(a) and 9(a), while the deformation diagrams from the test are shown in Figs. 8(b) and 9(b) near the column face and first web opening. These coincide with the test results. The von Mises stress diagram of steel beam in connection model LJD01 and LJD02 are shown in Figs. 10 and 11. The maximum stress was equal to 475 MPa for connection model LJD01 on cross-sections near the column face and 435 MPa for connection model LJD02 on the first web opening. This indicates that the bending failures on the above-mentioned cross section occurred.
|
Fig.8 Deformation of specimens LJD01 |
|
Fig.9 Deformations of specimen LJD02 |
|
Fig.10 Mises stress diagram of the steel beam in LJD0 |
|
Fig.11 Mises stress diagram of the steel beam in LJD02 |
4 Parametric Analysis
According to the seismic design principle of strong column weak beam and strong connection weak component[17-19], it is necessary to ensure that castellated steel beam near the connection core zone is not damaged at the castellated hole, and shear failure does not occur to the connection core zone. The expansion ratio will affect the stiffness and beading capacity of the beam. A large expansion ratio will increase the beam bending capacity while result in large web opening. The web opening in beam plastic hinge zone will decrease the deformation capability of beam, even resulting in shearing failure instead of bending failure of beam. Therefore, the location of first web opening determines the failure mode of the beam. For a given expansion ratio and location of first web opening, the original height of steel beam greatly affects the flexural strength of castellated composite beam. Hence, 18 three-dimensional finite element models were established for parametric analysis. The parameters such as expansion ratio, location of web opening, and original height of steel beam were taken into consideration, as listed in Table 6.
| Table 6 Different parameters |
4.1 Expansion Ratio Effect
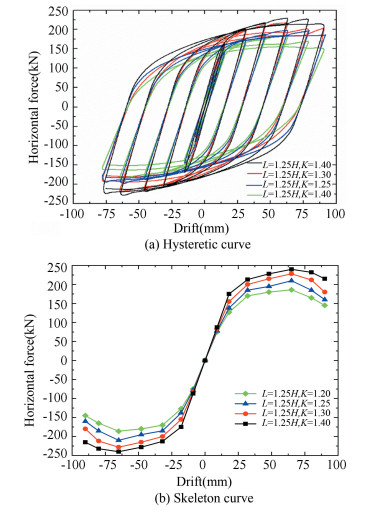
In order to study the effect of expansion ratio K on connection performance, the models of the castellated composite beam-CSHRC column connection with different expansion ratios were simulated under low cyclic loading with other parameters remaining unchanged. The load-displacement hysteretic curves and skeleton curves of the connection are shown in Fig. 12. When other conditions remained unchanged and the local buckling did not occur at the cross section near the web opening, the bending capacity and stiffness of the connection increased with the increment of expansion ratio.
|
Fig.12 Hysteretic and skeleton curves under different expansion ratios |
Suppose L denotes the distance between the center of the first web opening to the column face, while H denotes the height of castellated beam. When L is equal to 1.25H and K equal to 1.2, the applied horizontal force reaches 143.8 kN when the drift is equal to 20 mm. When K increases to 1.3 with other parameters remaining unchanged, the applied horizontal force reaches 150 kN when the drift is equal to 20 mm. Due to the increment in the expansion ratio, the cross-sectional height of the castellated composite beam increases and this results in improvement of the bending capacity of the connection. For the connection model with the expansion ratio of 1.3 and 1.4, the maximum applied horizontal loads are 220 and 230 kN, respectively. As inter-story drift increases and reaches 90 mm, the applied loads decrease to 206 and 216 kN, respectively. They are very close. For the connection model with an expansion ratio beyond 1.3, the bearing capacity show drastic decrease at the maximum drift. The decrease in the bearing capacity is the weakening effect of the web opening on the beam. It is recommended that the expansion ratio of castellated composite beam should not exceed 1.3.
With the increment of expansion ratio, early stiffness, yielding load, and ultimate bearing capacity of the connection model increase gradually. When L is equal to 1.25 H and K equal to 1.2, the ultimate bearing capacity of connection model reaches 185.4 kN. When K increases to 1.4 with other parameters remaining unchanged, the ultimate bearing capacity of connection model reaches 238.8 kN. The maximum increase of the ultimate bearing capacity can reach 28% with the increment of expansion ratio. The numerical results show that the failure mode of the connection changes to be the local buckling of the beam bottom flange on the cross section near the web opening.
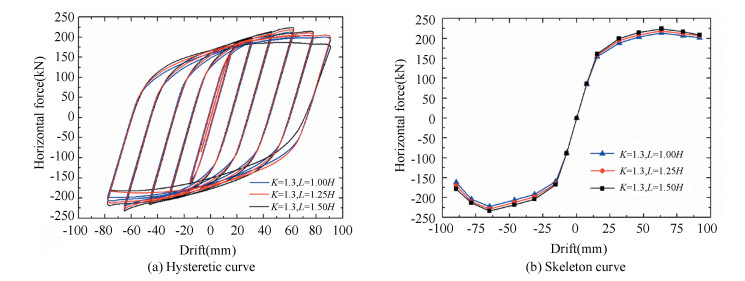
4.2 Location of First Web Opening EffectFig. 13 shows the hysteretic and skeleton curves when L changes. When L is equal to 1.25 H and K equal to 1.3, the applied horizontal force is equal to 180 kN with 25 mm horizontal drift. When L is 1.5 H with other parameters remaining unchanged, the applied horizontal force reaches 190 kN with 25 mm horizontal drift. When L is equal to 1.0 H and K equal to 1.3, the ultimate bearing capacity reaches 222.1 kN. When L increases to 1.5 H with other parameters remaining unchanged, the ultimate bearing capacity reaches 235.5 kN. With the increment of parameter L, the ultimate bearing capacity of the connection model increase gradually. The maximum increment of the ultimate bearing capacity of connection model reaches about 7%.
|
Fig.13 Hysteretic and skeleton curves under different locations of first web opening |
4.3 Original Height of Steel Beam
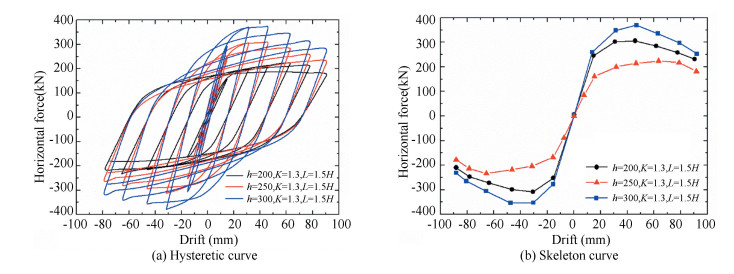
Fig. 14 shows the hysteretic and skeleton curves when original height of steel beam (h) changes. When h is 200 mm, L is 1.5H, and K is 1.3, the applied horizontal force is equal to 230 kN with 50 mm horizontal drift. When h is 300 mm with other parameters remaining unchanged, the applied horizontal force reaches 366 kN with 50 mm horizontal drift; the maximum increment of applied horizontal force of connection model reaches 60%. The larger the beam height is, the larger the bearing capacity of the connection is. Furthermore, the weakening effect of the web opening on connection bearing capacity is more obvious and the applied horizontal force of the connection declines significantly in the later loading.
|
Fig.14 Hysteretic and skeleton curves under different original heights of steel beam |
4.4 Ultimate Bending Moment Bearing Capacity
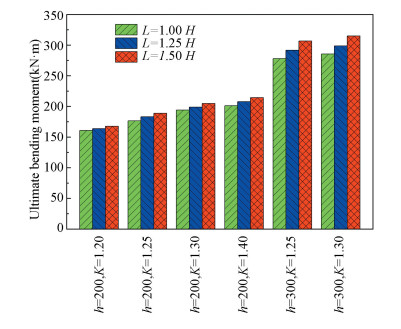
Fig. 15 shows the ultimate bending moment at the beam cross section near the column face of each specimen. For finite element models with h equal to 200 mm and L equal to 1.25H, the ultimate bending moment of the connection will increase with the increment of expansion ratio K. For the models with K changing from 1.2 to 1.4, the ultimate bending moment of the connection models changes from 163.9 to 207.8 kN·m; the increment of the ultimate bending moment reaches 23.9%. For finite element models with h equal to 200 mm and expansion ratio K equal to 1.2, L shows little influence on the ultimate bending moment. For the models with L changing from 1H to 1.5H, the corresponding ultimate bending moment is equal to 160.9 and 167.8 kN·m, and the increment of the ultimate bending moment is 4.3%. This indicates that first web opening L will not influence the failure modes of the connection. For finite element models with h equal to 300 mm and K equal to 1.3, L shows large influence on the ultimate bending moment. For the models with L changing from 1H to 1.5H, the corresponding ultimate bending moment is equal to 285.5 and 315.0 kN·m, and the increment of the ultimate bending moment reaches 10.3%. This indicates that the beam failure plane occurs near the first web opening.
|
Fig.15 Ultimate bending moment bearing capacity |
4.5 Joint Stiffness
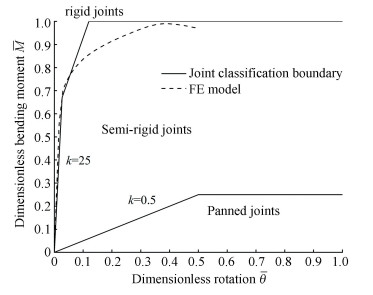
Based on EC3[20], joints can be typically divided into panned joints, semi-rigid joints, and rigid joints according to their rotational stiffness. Joint stiffness is determined by the slope of the curve of dimensionless bending moment
For finite element models in Fig. 16, the model with parameters h=250, K=1.3, and L=1.5H possess the lowest initial rigidity, and this model was chosen for analysis. Fig. 16 shows the dimensionless bending moment and rotation curve of the model. At the beginning of horizontal loading, the rotation of the joint is small and the slope of the curve is greater than 25. As the rotation continues to increase, the stiffness of the joint begins to decrease. According to the joint classification criteria, the joint is rigid in elastic stage.
|
Fig.16 Classification of castellated composite beam and RC column connection |
5 Conclusions
A new type of castellated composite beam and compound spiral hoop reinforced concrete column connection is presented. Two 1/2 scaled connection specimens were tested. Then three-dimensional nonlinear finite element models were used to analyze the mechanical properties of this type of connection. Comparison results indicated that predictions based on the proposed analytical model agree well with the experiments. This verified the rationality and accuracy of the model as well. The results show that the connections possessed high initial rigidity. The influences of the parameters such as expansion ratio, location of web opening, and original height of steel beam were studied during the FEA. Main conclusions are as follows:
Expansion ratio has significant effect on the mechanical properties of the connection. With the increment of expansion ratio, early stiffness, yielding load, and ultimate bearing capacity of connection model increased gradually. The maximum increase of the ultimate bearing capacity could reach 28% for connection model with an expansion ratio of 1.4. In order to prevent the buckling of steel beam from occurring near web opening, the expansion ratio of steel beam should not be greater than 1.3.
Ultimate bearing capacity of the connection model increased gradually with the increment of the distance between the center of the first web opening to the face of the column. The maximum increment of the ultimate bearing capacity of connection model reached about 7% for the distance between the center of the first web opening to the column face, which is equal to 1.5 times of the height of castellated steel beam.
The original height of steel beam had great influence on the ultimate bearing capacity of connection model. The maximum increment of the applied horizontal force could reach 60% for connection model with original height of steel beam of 300 mm. Moreover, the weakening effect of the web opening on connection bearing capacity was more obvious and the applied horizontal force of the connection declined significantly in the later loading.
| [1] |
Fan J S, Zhou H, Nie J G, et al. Experimental study on seismic performance of three-dimensional composite beam-to-column joints. China Civil Engineering Journal, 2014, 47(4): 47-55. (  0) 0) |
| [2] |
Jeddi M Z, Sulong N H R, Khanouki M M A. Seismic performance of a new through rib stiffener beam connection to concrete-filled steel tubular columns: an experimental study. Engineering Structures, 2017, 131: 477-491. DOI:10.1016/j.engstruct.2016.10.038 (  0) 0) |
| [3] |
Li W, Li Q N, Jiang W S. Nonlinear finite element analysis of behaviors of steel beam-continuous compound spiral stirrups reinforced concrete column frame structures. The Structural Design of Tall and Special Buildings, 2013, 22: 1119-1138. DOI:10.1002/tal.758 (  0) 0) |
| [4] |
Redwood R, Cho S H. Design of steel and composite beams with web openings. Journal of Constructional Steel Research, 1993, 25(1-2): 23-41. DOI:10.1016/0143-974X(93)90050-3 (  0) 0) |
| [5] |
Chung K F, Lawson R M. Simplified design of composite beams with large web openings to Eurocode 4. Journal of Constructional Steel Research, 2001, 57(2): 135-164. DOI:10.1016/S0143-974X(00)00011-0 (  0) 0) |
| [6] |
Cheng C T, Chen C C. Seismic behavior of steel beam and reinforced concrete column connections. Journal of Constructional Steel Research, 2005, 61(5): 587-606. DOI:10.1016/j.jcsr.2004.09.003 (  0) 0) |
| [7] |
Odrobiňǎk J, Idunk R, Bačinský T. Study on stiffness of composite beam-to-column joints. Procedia Engineering, 2014, 91: 268-273. DOI:10.1016/j.proeng.2014.12.058 (  0) 0) |
| [8] |
Li G Q, Gu F L, Sun F F. Mechanical behaviors of embedded steel column connections between steel coupling beams and concrete shear walls-experimental study. China Civil Engineering Journal, 2017, 50(2): 44-54. DOI:10.15951/j.tmgcxb.2017.02.006 (  0) 0) |
| [9] |
Toh W, Tan L B, Tse K M, et al. Numerical evaluation of buried composite and steel pipe structures under the effects of gravity. Steel and Composite Structures, 2018, 26(1): 55-66. DOI:10.12989/scs.2018.26.1.055 (  0) 0) |
| [10] |
Li W, Han L H. Seismic performance of CFST column to steel beam joint with RC slab: experiments. Steel Construction, 2012, 73(11): 66-79. DOI:10.1016/j.jcsr.2012.01.011 (  0) 0) |
| [11] |
Li W, Han L H. Seismic performance of CFST column to steel beam joints with RC slab: analysis. Journal of Constructional Steel Research, 2011, 67(1): 127-139. DOI:10.1016/j.jcsr.2010.07.002 (  0) 0) |
| [12] |
Parra-Montesinos G, Wight J K. Seismic response of exterior RC column-to-steel beam connections. Journal of Structural Engineering, 2000, 126(10): 1113-1121. DOI:10.1061/(ASCE)0733-9445(2000)126:10(1113) (  0) 0) |
| [13] |
Nie J G, Cai C S, Wang T. Stiffness and capacity of steel-concrete composite beams with profiled sheeting. Engineering Structures, 2005, 27(7): 1074-1085. DOI:10.1016/j.engstruct.2005.02.016 (  0) 0) |
| [14] |
Nie J G, Qin K, Cai S. Seismic behavior of connections composed of CFSSTCs and steel-concrete composite beams-experimental study. Journal of Constructional Steel Research, 2008, 64(10): 1178-1191. DOI:10.1016/j.jcsr.2007.12.004 (  0) 0) |
| [15] |
Fan J S, Li Q W, Nie J G, et al. Experimental study on the seismic performance of 3D joints between concrete-filled square steel tubular columns and composite beams. Journal of Structural Engineering, 2014, 140(12): 04014094. DOI:10.1061/(ASCE)ST.1943-541X.0001013 (  0) 0) |
| [16] |
Shen H, Gu Q. Nonlinear finite element modeling of interior RCS beam-column connections. Engineering Mechanics, 2009, 26(1): 37-43. (  0) 0) |
| [17] |
Ye L P, Ma Q L, Miao Z W. Study on weak beam-strong column design method of RC frame structures. Engineering Mechanics, 2010, 27(12): 102-113. (  0) 0) |
| [18] |
Kataoka M N, de Cresce El Debs A L H. Beam-column composite connections under cyclic loading: an experimental study. Materials & Structures, 2015, 48(4): 929-946. DOI:10.1617/s11527-013-0204-4 (  0) 0) |
| [19] |
Zhang Y T, Yang L, Zhang J, et al. Study on design method of strong column and weak beam based on fragility for prestressed concrete frame structures. Engineering Mechanics, 2018, 35(7): 104-116. DOI:10.6052/j.issn.1000-4750.2017.03.0200 (  0) 0) |
| [20] |
European Committee for Standardization. Eurocode 3: Design of steel structures (EN 1993-1-8). Belgium: European Committee for Standardization, 2005.
(  0) 0) |
 2021, Vol. 28


