2. Shanghai Cable Research Institute, Shanghai 200093, China
As an important medium for data transmission, optical fiber has been used in various fields, such as communication and medical device industry. A number of considerations that govern the dimensional specifications are required in manufacturing communication optical fibers[1]. Geometry parameters of optical fiber are important factors that affect performances of fibers, such as transmission, optoelectronics, integrated optics, semiconductor technologies, and especially for optical sensors[2-3]. Geometry parameters mainly refer to diameters of core and cladding, non-circularity of core and cladding, and concentricity of core and cladding[4]. It is critical to measure these factors efficiently and accurately during the manufacture process of fibers.
To measure the geometry parameters of optical fiber in the optical communication industry, optical methods including scattering and diffraction patterns, shadowing techniques, refracted near field, transverse interference, near-field light distribution method, mechanical diameter method, and spectral interferometry have been adopted[5-11]. The near-field light distribution method recommended by the nation standard GB15972.20-2008[12] requires the optical fiber to be illuminated during the measurement, so the end face of the optical fiber is a blurry spot in the image. The measurement of the geometry parameters of optical fiber has great influence on the edge extraction of optical fiber. Fourteen different unused laser fibers from 6 leading manufacturers with advertised diameters of 200, 270, 272, 273, 365, and 400 μm were measured by light microscopy[13]. The outer diameter (including the fiber coating, cladding, and core), cladding diameter (including the cladding and the fiber core), and core diameter were measured. Xi et al.[14] designed a geometry optical and suface parameter measurement algorithm based on machine vision and image process. Edge operator was used to detect the image edges, and noise was removed by required contour feature. The algorithm fits with the contours and can calculate the geometry parameters. Gisin et al.[15] proposed an experimental setup which permits, in a routine way for R & D purposes, simultaneous measurement of the transmitted near field at 1300 nm and 1550 nm and the refracted near field at 820 nm to measure geometry parameters. Measurements of the mode field in the function of polarization state for four different hi-bi fibers were also presented. Lim et al.[16] demonstrated a high-accuracy measurement method for the non-circularity of silica glass fibers. A formula which converts the measured phase difference to the fiber ellipticity was devised based on the acoustic dispersion relation. Ellipticity measurements were performed for three different types of optical fibers: photonic crystal fiber (PCF), elliptical-core fiber, and standard single-mode fiber (SMF). According to the above analysis, the measurable parameters of transverse interference are lacked. The mechanical diameter method can damage the fiber. Compared with these methods, the near-field light distribution method has been widely used due to fast measurement speed, high measurement accuracy, and non-contact measurement.
Li et al.[17] utilized a method to precisely measure fiber geometry parameters with Canny operator and binaryzation filtering. The end face image of the optical fiber was received by CCD camera and was filtered to make noise reduction. After the Canny operator was used to extract the edge of the fiber, the edge data were fitted with the inner circle and the outer circle to obtain the high-precision geometry parameters of the fiber. However, it was noted that the boundary between the core and the cladding is blurred. The reason is that when light is transmitted in optical fiber, the energy transmission is not completely concentrated in the core part, and some energy will be transmitted in the cladding[18]. Therefore, when the geometry parameters of optical fiber are measured by near-field light distribution method (microscopic amplification imaging method), it is easy to cause errors during edge detection, which can lead to the inaccuracy of the parameters.
In this paper, a method of determining the edge of optical fiber core is proposed. The optical fiber end face was amplified by the microscopic optical system and received by CCD. The distribution characteristics of the output mode field of the fiber could be described by Bessel function method, which was used to fit with the output mode field of the fiber. The boundary points of the fiber core and the cladding were determined by Bessel function fitting, and the edge of the fiber core could be extracted accurately. Canny operator was used to extract edges of fiber cladding. Finally, elliptical curve fitting was performed on the extracted edge data by least square method, and the geometry parameters of optical fiber core and cladding were obtained.
1 Measuring Principle 1.1 Helmholtz Equation and Bessel FunctionSince the axial mode field component is much larger than the radial mode field component when light propagates in fiber, other radial components can be obtained with Maxwell equations by calculating the axial mode field component of the light wave. The Helmholtz equation of the axial mode field component of fiber is
| $ \left\{\begin{array}{l} \nabla^{2} \boldsymbol{E}+\boldsymbol{K}_{0}^{2} n^{2} \boldsymbol{E}=0 \\ \nabla^{2} \boldsymbol{H}+K_{0}^{2} n^{2} \boldsymbol{H}=0 \end{array}\right. $ | (1) |
where E is the electric vector of light wave, H is the magnetic vector of light wave, K is the number of the waves, and n is the refractive index of the medium.
According to the axial symmetry of the fiber, Eq.(1) can be expressed in the form of cylindrical coordinates as follows:
| $ \left\{\begin{array}{l} \frac{\partial^{2} \boldsymbol{E}}{\partial r^{2}}+\frac{1}{r} \frac{\partial \boldsymbol{E}}{\partial r}+\frac{1}{r^{2}} \frac{\partial^{2} \boldsymbol{E}}{\partial \varphi^{2}}+\frac{\partial^{2} \boldsymbol{E}}{\partial z^{2}}+k_{0}^{2} n^{2} \boldsymbol{E}=0 \\ \frac{\partial^{2} \boldsymbol{H}}{\partial r^{2}}+\frac{1}{r} \frac{\partial \boldsymbol{H}}{\partial r}+\frac{1}{r^{2}} \frac{\partial^{2} \boldsymbol{H}}{\partial \varphi^{2}}+\frac{\partial^{2} \boldsymbol{H}}{\partial z^{2}}+k_{0}^{2} n^{2} \boldsymbol{H}=0 \end{array}\right. $ | (2) |
where r is the distance between the end point of the optical fiber and the central point. k0 is defined as k0=π/λ, where λ is the wavelength of light in vacuum.
The light intensity of the light inside the fiber is the square of the electric field modulus and can be defined as
| $ \boldsymbol{I}(r)=\boldsymbol{E}^{2}(r) $ | (3) |
Therefore, only the electric field modulus inside the fiber can be solved in the subsequent derivation. According to Eq.(2), the equation about r in fiber core and cladding is expressed as
| $ \begin{array}{c} \frac{{{{\rm{d}}^2}\mathit{\boldsymbol{E}}(r)}}{{{\rm{d}}{r^2}}} + \frac{1}{r}\frac{{{\rm{d}}\mathit{\boldsymbol{E}}(r)}}{{{\rm{d}}r}} + \left[ {\left( {k_0^2n_1^2 - {\beta ^2}} \right) - \frac{{{m^2}}}{{{r^2}}}} \right] \cdot \\ {\mathit{\boldsymbol{E}}(r) = 0,r \le a}\\ {\frac{{{{\rm{d}}^2}\mathit{\boldsymbol{E}}(r)}}{{{\rm{d}}{r^2}}} + \frac{1}{r}\frac{{{\rm{d}}\mathit{\boldsymbol{E}}(r)}}{{{\rm{d}}r}} + \left[ {\left( {k_0^2n_2^2 - {\beta ^2}} \right) - \frac{{{m^2}}}{{{r^2}}}} \right].}\\ {\mathit{\boldsymbol{E}}(r) = 0,r > a} \end{array} $ | (4) |
where a is the transverse characteristic size of the fiber. For the single-mode fiber circular at the cross-section step, a is the core radius, β is the longitudinal propagation constant of optical fiber, and n1 and n2 are the refractive indexes of fiber core and cladding.
Eq.(4) is a typical Bessel equation. Since the output mode field amplitude of the fiber reached the maximum value at the center of the fiber core, the first kind of Bessel function was chosen as the solution of the fiber core. In the cladding region, when the diameter approached infinity, the amplitude of the mode field should approach zero, so the second type of Bessel function (Neumann function) was selected as the solution for the cladding part. Since the attenuation of the mode field from the fiber core to the cladding changed continuously, the boundary should meet the condition of tangential continuity. Therefore, it can be calculated as
| $ E=A e^{-i \beta z} \cos (m \varphi)\left\{\begin{array}{ll} \frac{J_{m}\left(U R_{a}\right)}{J_{m}(U)}, & R_{a} \leqslant 1 \\ \frac{K_{m}\left(W R_{a}\right)}{K_{m}(W)}, & R_{a} \geqslant 1 \end{array}\right. $ | (5) |
where Jm is the first type of Bessel function, Km is the second type of Bessel function, m is the order of the Bessel function, and A is the amplitude of mode field. The normalized radius is defined as Ra=r/a, z is the radial propagation length, U is the normalized transverse phase parameter, and W is the normalized transverse attenuation parameter.
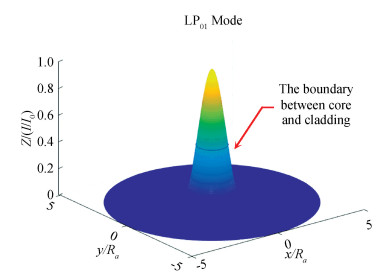
Since the electric field modulus has been normalized, according to Eq.(5), the relative normalized radius Ra of light intensity I for the LP01 mode in a single-mode fiber can be expressed as
| $ I\left(R_{a}\right)=\left\{\begin{array}{c} J_{0}^{2}\left(U R_{a}\right), \quad R_{a} \leqslant 1 \\ J_{0}^{2}(U) \frac{K_{0}^{2}\left(W R_{a}\right)}{K_{0}^{2}(W)}, R_{a}>1 \end{array}\right. $ | (6) |
where J0 is the first type of Bessel function at zero order, K0 is the second type of Bessel function at zero order, and Ra=1 corresponds to the boundary point between fiber core and cladding.
According to Eq.(6), the normalized light intensity and radius 3D diagram is shown in Fig. 1.
|
Fig.1 Intensity distribution diagram under normalized radius |
1.2 Normalization of Fiber Gray Data and Curves Fitting
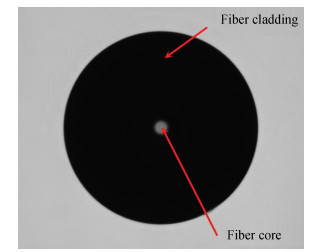
The optical fiber end face image is shown in Fig. 2.
|
Fig.2 Fiber end face image |
It can be seen from Fig. 2 that the end face of the core is a bright spot with unclear edge, so the true edge of the core and the cladding cannot be accurately judged. The traditional algorithm (used by FGM-5) applied the edge extraction operator to get the edge of the fiber core, and the geometry parameters were measured. Traditional algorithms will inevitably bring measurement errors due to the inconsistency of the image quality. Bessel function fitting method can describe the distribution of the bright spot with the accurate function by analyzing the internal mode field, so the position of the real edge can be accurately judged and the measurement accuracy can be improved by fitting.
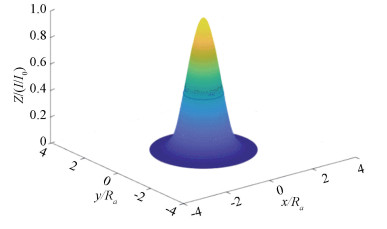
The optical intensity data of the optical fiber is presented with gray value, and its variation trend should conform to the relation of Eq.(6). Before function fitting, the first step is to normalize the gray data. Then, the obtained optical intensity of the fiber end face represented by grayscale and the radius of the optical intensity distribution will be normalized. The 3D distribution diagram of optical intensity was obtained, as shown in Fig. 3. The gray data fitted by the Bessel function method is presented in Fig. 4.

|
Fig.3 3D distribution of normalized light intensity |
|
Fig.4 3D distribution after Bessel function fitting |
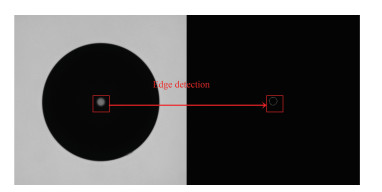
The value of U or W defined by Eq.(6) can be obtained by fitting with the least square method, which can determine the edge of the fiber core accordingly, as shown in Fig. 5.
|
Fig.5 Edge of fiber core |
The geometry parameters of the fiber core and the cladding can be obtained by elliptical curve fitting after edge extraction, and each geometry parameter was finally obtained[19-21].
The geometry parameters of the optical fiber, which can be measured by microscopic amplification imaging method, include diameters, non-circularity, and concentricity of cladding and core. After the elliptical curves fitting of the edge of the core and cladding, the length, diameter, and center coordinates of the ellipse can be obtained. Then, the geometry parameters can be calculated from the following formula:
| $ \gamma=\sqrt{\left(x_{\text {core }}-y_{\text {core }}\right)^{2}+\left(x_{\text {core }}-y_{\text {clad }}\right)^{2}} $ | (7) |
| $ R=\sqrt{R_{\min } \cdot R_{\max }} $ | (8) |
| $ \delta=\left(R_{\max }-R_{\min }\right) / R $ | (9) |
where γ is the concentricity of the fiber, Rmin and Rmax are the short diameter and long diameter of the fitted ellipse, R is the equivalent radius of the fiber cladding or core, and δ is the roundness of the fiber cladding or core.
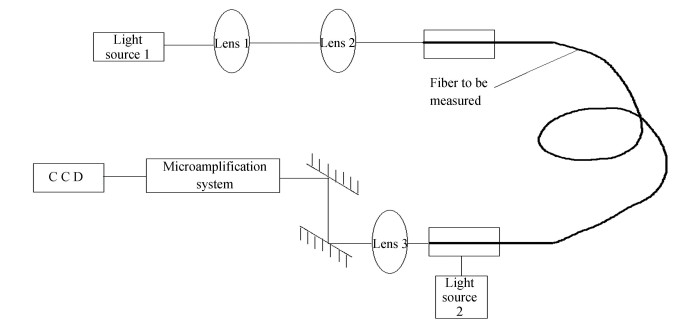
1.3 Experimental Principle and DevicesThe experimental devices of the Bessel fucntion fitting method is shown in Fig. 6.
|
Fig.6 Schematic diagram of the experiment |
To get a clear image of the end of the optical fiber, the optical fiber needs to be illuminated in two places. The boundary between fiber cladding and fiber core can be distinguished by the illuminated fiber core, and the outer edge of the fiber can be clearly distinguished by lighting the end face of the fiber. The microamplification system was used to magnify the end face of the optical fiber. The end face of the illuminated optical fiber was received by CCD through lens, and grayscale image was generated. The distribution characteristics of the output mode field of the fiber can be described by Bessel function method, which was used to fit with the output mode field of the fiber. The boundary points of the fiber core and cladding were determined by Bessel function fitting, and the edge of the fiber core could be extracted accurately. The geometry parameters to be measured can be obtained by elliptical curve to fit with Eqs.(7)-(9).
2 Measurement Data and Analysis 2.1 Geometry Parameter Measurement Under Normal Cutting Condition of Fiber End FaceThe FGM-5 Fiber Geometry Measurement System, produced by Shanghai Cable Research Institute, follows the test method of IEC 60793. It is a high-precision test equipment for automatic measurement of fiber geometry parameters, and has been applied by many fiber manufacturers in the world. The repeatability accuracy of single mode optical fiber core and cladding are both less than 0.05 μm, the repeatability accuracy of non-roundness is less than 0.1%, and the concentricity error of the core package is less than 0.04 μm. G652 fiber is a common single-mode communication fiber. The nominal value of the cladding diameter is 125 μm, and the core diameter is about 8-10 μm. In this paper, to verify the accuracy of the Bessel function fitting method, data measured by FGM-5 (using traditional algorithm) and data measured by Bessel function fitting method are compared.
In the case of good fiber end face cutting, the average values of 5 groups of experimental data measured by FGM-5 are presented in Table 1. The accuracy of the data was judged by the average value, and the repeatability of the data was determined by the maximum deviation.
| Table 1 Geometry parameter measurement data of FGM-5 |
The geometry parameters of the optical fiber can be calculated from the acquired edge. The measured data are shown in Table 2, which were fitted by elliptical curves and measured by Eqs.(7)-(9).
| Table 2 Geometry parameter data measured by Bessel function fitting |
The data in Table 1 and Table 2 were measured under the condition that the optical fiber end face is cut neatly and the lighting condition is well. According to the data, the measurement accuracies of the diameters of the cladding and core were improved by 4.2% and 18.8% respectively, the measurement accuracies of non-circularity of the cladding and core were increased by 33.3% and 15.2% respectively, and the concentricity of the cladding and core was rised by 58.8%.
Comparison of Table 1 and Table 2 shows the average of the geometry parameters was basically consistent with the data measured by FGM-5, and the maximum deviation of the measured data was reduced. Repeatability measurement accuracy was obviously enhanced.
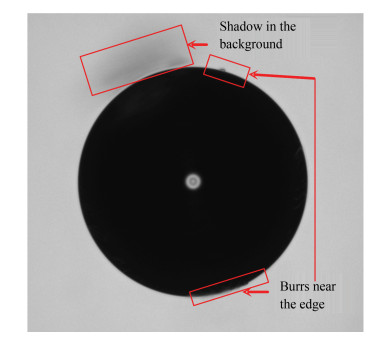
2.2 Measurement of Geometry Parameters under Abnormal Cutting Condition of Fiber End FaceMeasurement of optical fiber geometry parameters is based on the gray data of fiber end face, so the accuracy and repeatability of the measurement largely depend on the imaging quality. When the light condition fluctuates or the cutting knife passivates, the imaging quality will become worse. The measured geometry parameters were usually deviated from the measured values under normal conditions, and the repeatability error was large. The fiber end face images were obtained under abnormal conditions, as shown in Fig. 7.
|
Fig.7 Fiber end face under abnormal conditions |
The geometry parameters in Fig. 7 were measured by FGM-5 instrument. The measurement results are presented in Table 3.
| Table 3 Geometry parameter measurement data of FGM-5 under abnormal conditions |
The geometry parameters measured by Bessel function fitting are shown in Table 4, which were fitted by elliptical curves and measured by Eqs.(7)-(9).
| Table 4 Geometry parameter data measured by Bessel function fitting under abnormal conditions |
By comparing Table 3 and Table 4, it can be found that the geometry parameters measured by Bessel function fitting were maintained with the same accuracy as those of the FGM-5 under abnormal conditions. Furthermore, the repeatability of some parameters was higher than that of the FGM-5. In particular, the core diameter accuracy was improved by 75%.
The differences of the averages between normal and abnormal conditions are listed in Table 5.
| Table 5 Average differences of geometry parameters between normal and abnormal conditions |
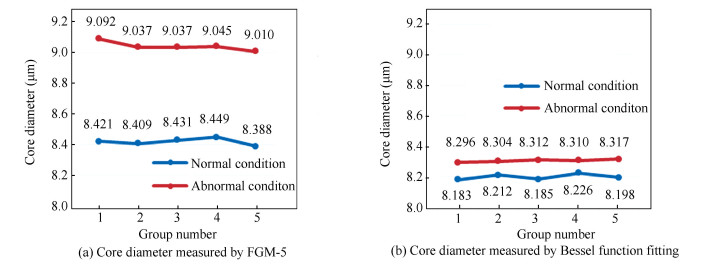
As shown in Table 5, the diameters of fiber core and cladding could be measured by Bessel function to fit with the gray scale data of fiber core image and were closer to the true values in Table 1 and Table 2. The advantage of this method is to determine the edge of the fiber core with a reasonable and theoretical basis. For the sake of intuition, the data of the core diameter measured by the FGM-5 instrument and the proposed method in this paper are shown in Fig. 8. For fiber core diameter and core non-circularity, the average differences were decreased by 82.9% and 14.7% respectively.
|
Fig.8 Comparison of core diameters of the two methods under different conditions |
Experiment results suggest that the Bessel function fitting method could maintain a high accuracy and stability when the measuring conditions of optical fiber were changed. Comparison with the geometry parameters obtained under normal conditions indicated that Bessel function fitting could guarantee higher measurement repeatability under good measurement conditions. When the measurement was under abnormal conditions, it showed that Bessel function fitting method also greatly improved the repeatability of the parameter measurement. As shown in Table 5, when the measuring conditions were changed, the average differences of the Bessel function fitting method between normal and abnormal were much smaller, and the diameters of the fiber could maintain a high stability. Therefore, the proposed method is an effective improvement for the measurement method of optical fiber geometry parameters with good and practical significance.
3 Conclusions and DiscussionAccording to the previous measurement of optical fiber geometry parameters, the common near-field light distribution method is unable to determine the boundary point between core and cladding. When the measuring conditions are changed, the accuracy and precision of geometry parameters will be affected, indicating that the measured value will deviate greatly from the normal value and the repeatability will become worse.
In this paper, a Bessel function fitting method for measuring geometry parameters of the optical fiber core is proposed. By analyzing the distribution of mode field in the fiber, the boundary points of two kinds of Bessel functions were taken as the interface between the fiber core and the fiber cladding, and the high-precision geometry parameters of the fiber would be obtained. Single mode fiber was measured, and good results were obtained. Although the mode field distribution inside the multi-mode fiber was more complex, the position of the fiber core could still be obtained and measured according to the mode field distribution of the fiber.
| [1] |
Smithgall D H, Watkins L S, Frazee R E. High-speed noncontact fiber-diameter measurement using forward light scattering. Applied Optics, 1977, 16(9): 2395-2402. DOI:10.1364/AO.16.002395 (  0) 0) |
| [2] |
Ekici Ç, Dinleyici M S. A practical approach for optical characterization of a film coated on the optical fiber. Optical Fiber Technology, 2017, 36: 382-386. DOI:10.1016/j.yofte.2017.05.015 (  0) 0) |
| [3] |
Zhang H, Kuschmierz R, Czarske J. Miniaturized interferometric 3-D shape sensor using coherent fiber bundles. Optics and Lasers in Engineering, 2018, 107: 364-369. DOI:10.1016/j.optlaseng.2018.04.011 (  0) 0) |
| [4] |
Chang Z, Huang S J, Wen J X, et al. Multi-parameters of spun optical fibers measured by digital holographic tomography. Optik, 2019, 178: 850-857. DOI:10.1016/j.ijleo.2018.09.119 (  0) 0) |
| [5] |
Presby H M. Ellipticity measurement of optical fibers. Applied Optics, 1976, 15(2): 492-494. DOI:10.1364/AO.15.000492 (  0) 0) |
| [6] |
Wang H. Theory and experiments on diffraction patterns of an optical fiber with slight ellipticity: A perturbation method. Journal of the Optical Society of America A, 1996, 13(6): 1199-1203. DOI:10.1364/JOSAA.13.001199 (  0) 0) |
| [7] |
Presby H M. Refractive index and diameter measurements of unclad optical fibers. Journal of the Optical Society of America, 1974, 64(3): 280-284. DOI:10.1364/JOSA.64.000280 (  0) 0) |
| [8] |
Jasapara J, Monberg E, DiMarcello F, et al. Accurate noncontact optical fiber diameter measurement with spectral interferometry. Optics Letters, 2003, 28(8): 601-603. DOI:10.1364/OL.28.000601 (  0) 0) |
| [9] |
Kowal D, Statkiewicz-Barabach G, Napiorkowski M, et al. Measurement of birefringence and ellipticity of polarization eigenmodes in spun highly birefringent fibers using spectral interferometry and lateral point-force method. Optics Express, 2018, 26(26): 34185-34199. DOI:10.1364/OE.26.034185 (  0) 0) |
| [10] |
Ohashi M, Miyoshi Y, Kubota H, et al. Longitudinal fiber parameter measurements of multi-core fiber using OTDR. Optics Express, 2014, 22(24): 30137-30147. DOI:10.1364/OE.22.030137 (  0) 0) |
| [11] |
Bukhtiarova T V, Dyachenko A A, Zhabotinski M E, et al. Laser method for transparent fiber geometrical and optical parameter measurements. IEEE Transactions on Instrumentation and Measurement, 1976, IM-25(4): 441-444. DOI:10.1109/TIM.1976.6312259 (  0) 0) |
| [12] |
General Administration of Quality Supervision, Inspection and Quarantine of the People's Republic of China. Specifications for Optical Fiber Test Methods Art 20: Measurement Methods and Test Procedures for Dimensions-Fiber Geometry. Beijing: China Standard Press, 2008.
(  0) 0) |
| [13] |
Kronenberg P, Traxer O. The truth about laser fiber diameters. Urology, 2014, 84(6): 1301-1307. DOI:10.1016/j.urology.2014.08.017 (  0) 0) |
| [14] |
Xi C L, Chen X R, Cong Y. Halcon-based optical fiber geometry parameters measurement algorithm. Advanced Materials Research, 2103, 805-806: 1929-1932. DOI:10.4028/www.scientific.net/AMR.805-806.1929 (  0) 0) |
| [15] |
Gisin N, Passy R, Perny B. Optical fiber characterization by simultaneous measurement of the transmitted and refracted near field. Journal of Lightwave Technology, 1993, 11(11): 1875-1883. DOI:10.1109/50.251187 (  0) 0) |
| [16] |
Lim S D, Park H C, Lee K, et al. High-accuracy measurement of cladding noncircularity based on phase velocity difference between acoustic polarization modes. Optics Express, 2010, 18(4): 3574-3581. DOI:10.1364/OE.18.003574 (  0) 0) |
| [17] |
Li Y M, Tu J K, Xiang H Z, et al. Measurement of optical fiber geometric parameters with Canny operator and binaryzation filtering. Optical Technique, 2018, 44(5): 513-518. DOI:10.13741/j.cnki.11-1879/o4.2018.05.001 (  0) 0) |
| [18] |
De Angelis G, Panariello G, Scaglione A. A variational method to approximate the field of weakly guiding optical fibers by Laguerre-Gauss/Bessel expansion. Journal of Lightwave Technology, 1999, 17(12): 2665-2674. DOI:10.1109/50.809688 (  0) 0) |
| [19] |
Kanatani K, Rangarajan P. Hyper least squares fitting of circles and ellipses. Computational Statistics and Data Analysis, 2011, 55(6): 2197-2208. DOI:10.1016/j.csda.2010.12.012 (  0) 0) |
| [20] |
Chaudhuri D. A simple least squares method for fitting of ellipses and circles depends on border points of a two-tone image and their 3-D extensions. Pattern Recognition Letters, 2010, 31(9): 818-829. DOI:10.1016/j.patrec.2010.01.009 (  0) 0) |
| [21] |
Lin S, Jusko O, Härtig F, et al. A least squares algorithm for fitting data points to a circular arc cam. Measurement, 2017, 102: 170-178. DOI:10.1016/j.measurement.2017.01.059 (  0) 0) |
 2021, Vol. 28


