2. Department of Chemical Engineering and Safety, Binzhou University, Binzhou 256600, Shandong, China
As the awareness of energy-saving in building design is rising, more and more architects now focus on the high-performance building design, which is a highly complex and labor-intensive process. There are many technologies that can help architects develop high-performance building design, including building performance simulation (BPS), building performance multiple objective optimizations (MOO), and design parameters sensitivity analysis (SA).
As for the BPS technology, it can assist designers to operate all kinds of building performances to help enhance the human indoor comfort, such as energy consumption, natural daylighting, ventilation situation, and thermal comfort. This simulation often occurs in the preliminary stage of the architectural design process, which is helpful to find suitable building formation. The MOO technology can also contribute to enhancement of a variety of building performances. Based on the optimization objective and objective functionet by the designers, the MOO process can output the Pareto solutions[1] that satisfy the design request. This process is often operated in the later stage of the architectural design process. The SA of design parameters can select the building design parameters which are more sensitive to the building performance so that designers can focus on adjusting these parameters to obtain the excellent building performance. The selection of these sensitive parameters can raise the standard of the building performance.
However, although there are many efficient tools to explore the high-performance building design scheme, none of the tools reported in the existing studies can combine the SA method and the MOO method, which can lead to the SA design parameters exploration and the high-performance building design scheme. Therefore, this paper proposes a decision support model (DSM) named HPBuildingDSM, which integrates the parametric model development, the BPS, the Latin Hypercube Sampling (LHS), and the MOO into the Grasshopper (GH) interface to help design high-performance office buildings and obtain the design scheme with low-energy and high-daylighting performances.
1 BackgroundThe high-performance building design process involves many complex problems that can affect building performance, while architects usually do not have enough expertise to solve them. Meanwhile, high-performance building design requires architects to have access to the evaluation of building performance and the enhancement of building performance. Therefore, the introduction of an efficient method and technology to the building design process can be helpful for architects to find the design scheme considering building performance design. There are many technologies to assist the high-performance building design methods, such as parametric modeling, BPS, LHS, SA, and MOO technology.
1.1 Parametric ModelingThe parametric building modeling can help designers construct the basic building prototype and provide dynamic control over geometry and components made up of parametric building models, which allows designers to evaluate multiple building design parameters at the same time[2]. The model contains various building information like site location, building mass and envelope, building orientation, and alternative energy sources, which can be evaluated based on the energy modeling and the final design decisions[3]. In this paper, the parametric modeling module in the HPBuildingDSM is mainly composed of 4 parts, including objective modeling, associate modeling, dataflow modeling, and procedural modeling. The basic functions and their relationships are listed as follows:
1) Objective modeling: this module includes the building formation design parameters, the building materials design parameters, the building generation of the building formation components, and the building material components.
2) Associative modeling: this module includes the dynamic relationships between the design parameters and the building formation, as well as the design parameters and the thermal properties of enclosure structures.
3) Dataflow modeling: this module includes the data stream between building formation, building material, and primitive data.
4) Procedural modeling: this module includes building formation and material generation principles, which involves the generation of the building plane, the enclosure structure generation of the building, opening windows for building envelope, and defining the material of building geometry.
1.2 Building Performance SimulationWith the current emphasis on sustainability such as building energy and indoor environment, design requirements have been increasingly important in the early design stages. BPS has become the main method to design sustainable buildings focusing on the building performance responding to the external or the internal environment. Correspondingly, the simulated tools vary from different building performances, such as EnergyPlus, TRNSYS, and DOE-2[4]. Purup and Petersen[5] proposed a research framework for research-based BPS tools to fit the common design practice in the early design stage, which is based on a review of methods used in the research of BPS in the early stage design support. Gaspari et al.[6] operated a design scheme to test if the BPS method could support architectural design in the early stage, and they proved that the BPS method can maximize the benefits derived by using natural phenomena and passive strategies.
With the assistance of many kinds of software, designers can build a model and run the performance simulation, some of which lack of an interface to transmit the model parameters. With the development of digital architecture, Rhinoceros and GH are playing increasingly important roles in constructing the design process, which can be applied to operating many kinds of BPS[7]. With the placement of the building performance simulation engine into GH like Radiance, Daysim, and EnergyPlus, architects can import the building design parameters into relevant BPS software[8]. Therefore, the building performance can be improved by simulation or comparison rather than depending on the green building technology. A common feature of this kind of building design tool is using visual programming in GH to import the parametric model into relevant BPS tools.
1.3 Parameters Sensitivity AnalysisThe SA technique can operate the BPS based on the input variables to find more significant variables, and those selected variables should be paid more attention to. Recently, the variable SA technique has attracted a lot of attention in identifying the most influential design variables. The SA of the design variables is an important action for the further building performance MOO, which can provide basic information about the sensitive variables in the design phase. Furthermore, there are many methods that can operate SA such as single factor SA[9], multivariate SA[10], and one-factor-at-a-time (OFAT)[11]. To choose suitable indicators and identify the most important design parameters for the efficient design solutions, Guo et al.[12] proposed a holistic approach integrating sensitivity analysis and parametric simulation analysis to explore the key design parameters on night cooling performance indicators and evaluate the applicability and limitations of those indicators. However, the current building performance design variables SA methods often include the BPS process which is difficult and complex. The analysis results demonstrated in charts and selected based on the designer's subjective experience often cannot reach the SA results accurately. Besides, the SA process usually involves the data exchanging between different tools which can bring about a lot of trouble during the design variables SA process.
1.4 Building Performance Multiple Objective OptimizationThe development of computational generative design and parametric algorithmic modeling provides opportunities to add building performance optimization during the process of performance simulation. This method enables architects to seek appropriate solutions to complex problems by accessing multiple variants. The first building performance optimization method was proposed by Bouchlaghem and Letterman, which is a numerical method that can be applied to the thermal design of non-air-condition buildings[13]. Then, it was developed into the MOO method which can be applied to a more complex building performance analysis to simulate and access multiple variables and objectives to find the Pareto optimal (non-domain) solutions. To obtain a remarkable impact on the building performance that satisfies the conflicting criteria, Yiǧit and Özorhon[14] proposed a software package combining a tailor-made thermal simulation software and the Matlab Optimtool. The developed software package provides an effective method to perform a large number of simulations to find optimal building configuration. To make an ideal decision on sustainable design and green building scheme, Fang and Cho[15] proposed a building performance optimization process that can help designers simultaneously evaluate the daylighting and energy performance of numerous design options and generate optimized design, including parametric design, building simulation modeling, and genetic algorithms. Among the MOO search algorithm, Evolutionary Algorithm (EA), which can be used to operate MOO, simulates the systems and techniques to encounter in evolutionary biology. The algorithm has the concepts like inheritance, mutation, natural selection, and crossover, which are similar to the natural law of the "survival of the fittest", where the excellent architectural parameters can be filtered through EA to form excellent performance architectures. With the development of the software such as Galapagos Evolutionary Solver[16], the algorithm can be applied to the building model to explore the ideal variables during the performance simulation process.
2 MethodsIn order to operate the high-performance building design, this paper proposes a designed DSM in GH named HPBuildingDSM, which combines the BPS, the LHS, the SA, and the MOO technologies to help architects design office buildings with high-performance building design. The development of the HPBuildingDSM is mainly composed of the GH plugin of HUMAN UI, GH_Cpython, and Ladybug & Honeybee to generate the interface in front of GH, which can link the parametric model with the building simulated plugin like Daysim and EnergyPlus in Honeybee & Ladybug to operate the BPS process. The Octopus plugin in HPBuildingDSM can assist designers to operate the building performance MOO process.
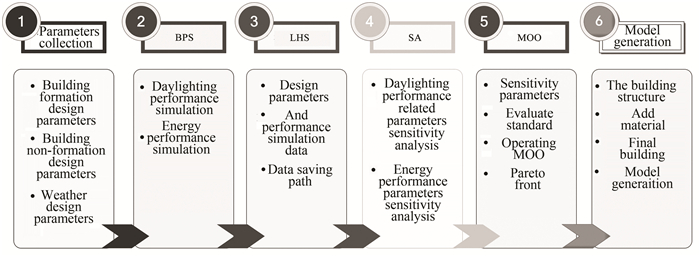
On the basis of the GH plugin and the Python programming, the BPS and the MOO modules were developed based on the existing battery. The LHS and the SA modules were developed based on the Python programming. This paper develops 6 steps in the HPBuildingDSM to obtain the final high-performance building design scheme, which can be listed as follows (Fig. 1):
|
Fig.1 Process of the HPBuildingDSM |
1) The collection of building design parameters: in this step, designers should collect the building design parameters and the statistic domain of the building design parameters like the total width of the building, the total depth of the building, the height of the building, the number of the building floors, and the ratio of the window to walls. The common features of these parameters are that they can affect the building performance and are easy to control in the parametric model. After collecting the design parameters, designers can input the value of the parameters into the HPBuildingDSM for the performance simulation in the next step.
2) The performance simulation of the building: in this step, the parametric building model is transferred into the building performance simulated model and the MOO model, which are mainly used to operate the building natural daylighting, energy performance, and MOO process. The model needs architects to input the basic simulation settings, such as simulation plane height, simulation plane grid size, simulation date, human activity schedule, and regional climate parameters. Then, designers can operate the performance simulation to assess the UDI100-2000 and the Building Annual Energy Consumption per area (AEC).
3) The performance simulated data sampling: based on the Python programming and the GH_Cpython plugin, the LHS module is developed to realize the simulated data sampling. This step can help to disturb the regularity of the simulated data and obtain the random performance simulated data which can be used to analyze the sensitivity of the building design parameters in the next step.
4) The SA of the building design parameters: in this step, the SA of the building design parameters is developed based on the Gradient Boosting Regression Tree (GBRT) algorithm and the Python programming. After inputting the building performance sampling data, the Matplotlib in the Python library can output the sensitivity ranking of the design parameters shown on the python figure, and designers can select the sensitive design parameters to operate the MOO in the next step.
5) The building performance MOO: on the basis of the sensitive design parameters, designers can operate the building energy and natural daylighting performance MOO based on the Octopus plugin in GH. When the iteration number meets the set value, the calculation will stop and output the final Pareto frontier for designers to search for the optimized solution.
6) The deepening design of building scheme: in the final step, designers can add the detailed building structure information (e.g., column, beam, stairs, and roof) onto the optimized high-performance basic building model using VISUAL ARQ plugin in GH. Then, designers can transfer the detailed model to sketch up and add the material. Finally, based on the finished design scheme model, designers can output the render and CAD drawings.
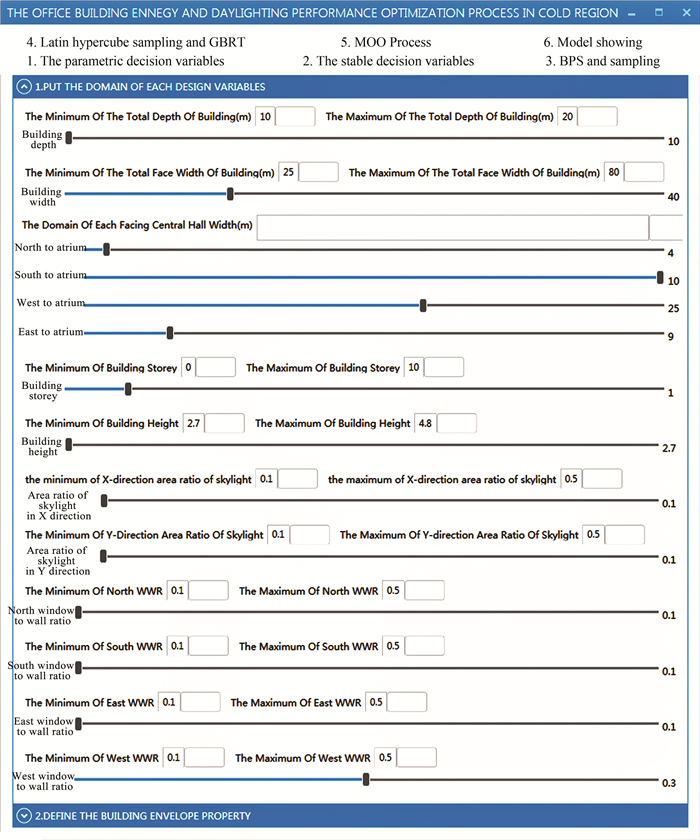
3 Results and ReflectionIn order to test the function of the HPBuildingDSM, this paper applies the DSM to the high-performance office building design in the severe cold region in Harbin. During the design process, the developed DSM can guide architects to operate the building design process. A case study was performed to demonstrate the capability of the DSM and assess the final building performance in the Octopus plugin. It revealed how the DSM helps designers to optimize building performance and gain the final design scheme. The building formation design parameters were collected through previous literature, including the total bay of the building, the total depth of the building, the ratio of window to wall, and so on (Table 1). With the collected database of weather and building design parameters, the developed HPBuildingDSM can be applied to design the regular shape building in cold regions. Moreover, if designers can collect weather database in other climatic regions, the HPBuildingDSM can also be utilized. For the first step, based on the statistical value of these design parameters, designers can put them into the first interface of the DSM (Fig. 2). Then, the corresponding office building would appear in the Rhinoceros interface and the designers can confirm if the building meets the basic design requirement.
| Table 1 Range statistics of form design parameters of office buildings |
|
Fig.2 Statistics of the building design parameters |
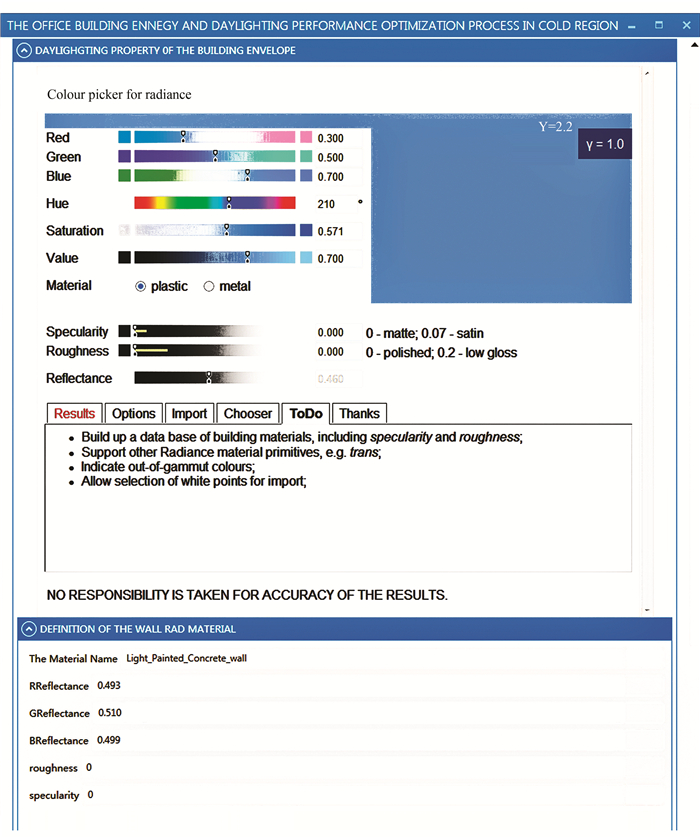
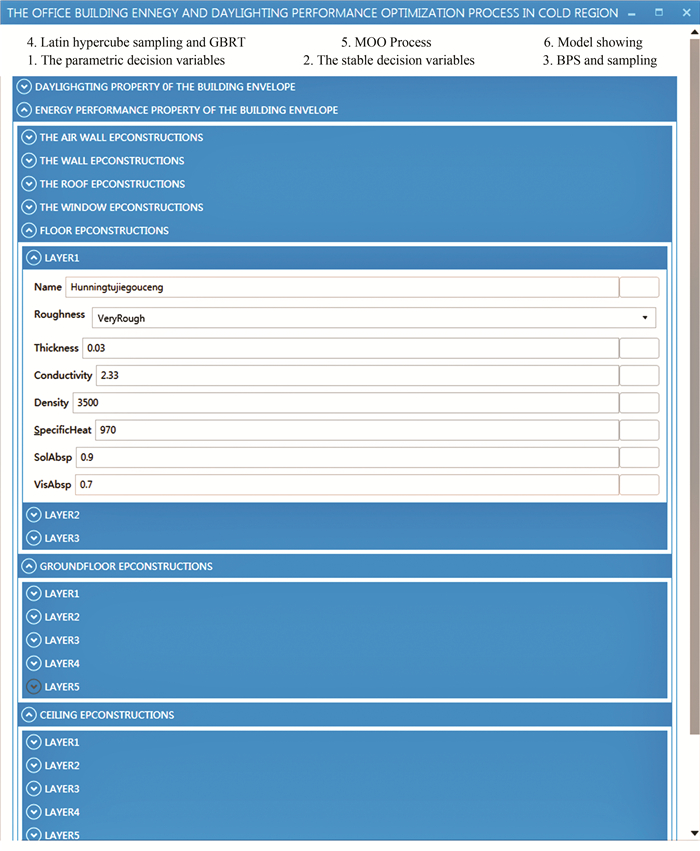
In the second step, designers should confirm the non-formation building design parameters and the DSM which defines four kinds of non-formation design parameters: optical thermal parameters of building envelope structure, thermal performance of envelope structure, a layer of envelope structure, and the thermal and functional impact parameters of building interior (Fig. 3). In this step, designers should search for the books on thermal parameters of local building structures to confirm the corresponding values and put them into the DSM (Fig. 4). After inputting the values of thermal parameters, designers can click the "Write the material" button to add these material values into the EnergyPlus library to construct the daylighting and energy performance simulation.
|
Fig.3 Optical parameters |
|
Fig.4 Thermal parameters |
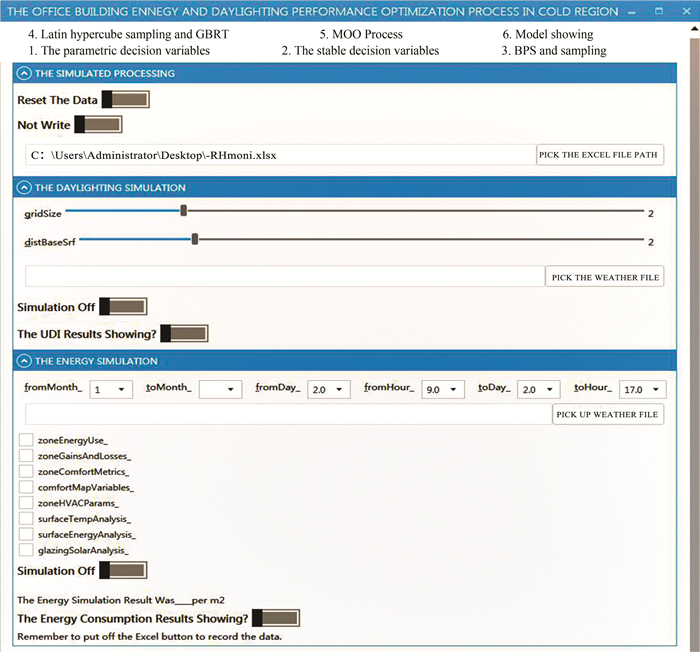
In the third step, designers should click the simulated data recording button to prepare for the latter simulation. The daylighting simulation parameters setting of "grids" and "distance from the work plane", as well as the energy performance simulation parameters setting of "simulated time" and "performance recording category" should be filled in the DSM. Then, the building performance simulation can be operated (Fig. 5) and the corresponding building performance simulated results will be displayed on the DSM interface in the form of the pseudo-color maps which can be shown in the Rhinoceros interface. When the two kinds of BPS are finished, the MOO plugin Octopus can be operated for the genetic sampling of building performance and recording the building performance simulated data results at the same time which can be used for the building design parameters SA in the next step.
|
Fig.5 BPS parameters setting |
After 192 h of building performance MOO, 600 groups of building simulated data were obtained and stored into the building performance simulation database. In the fifth step, the building performance sampling can be operated to get the building performance sampling database, and the design parameters SA module can be operated to get the sensitive design parameters. In terms of the GBRT algorithm, the task of parameters SA could be categorized as a supervised regression problem from the machine learning point of view, and all the data input into the algorithm will correspond to the target data. Boosting is a powerful learning strategy designed for classification and regression, and the function of boosting is to combine the "weak learners" into a powerful "committee". The GBRT model is trained as follows:
| $ {F_m}\left( x \right) = {F_{m - 1}}\left( x \right) + {h_m}(x) $ | (1) |
where x is the natural variables, m is the number of the iteration, hm(x) is the weak learner, and Fm(x) is the sum of many small weak learners. The GBRT procedure aims at estimating the final result from the training set to obtain hm(x) to satisfy Eq. (2):
| $ {F_m}\left( {{x_{i, t}}} \right) = {F_{m - 1}}\left( {{x_{i, t}}} \right) + {h_m}\left( {{x_{i, t}}} \right) = {Y_{i, t + k}} $ | (2) |
where Eq. (2) is equivalent to Eq. (3), i represents the ith sample, xi represents the explanatory variable, t represents the dependent variable, k represents the train feature, and Yi, t represents the tth regression tree obtained during training.
| $ {h_m}\left( {{x_{i, t}}} \right) = {Y_{i, t + k}} - {F_{m - 1}}\left( {{x_{i, t}}} \right) $ | (3) |
where hm is the model fitting at m iterations in Eq.(4).
| $ {r_{m, i, t}} = {Y_{i, t + k}} - {F_{m - 1}}\left( {{x_{i, t}}} \right) $ | (4) |
where r represents current residuals which could be found that the current residuals are the negative gradients of the squared error loss function in Eq. (5):
| $ \begin{array}{l} \left( { - {\alpha ^{1/2}}{{\left( {{Y_{i, t + k}} - {F_{m - 1}}\left( {{x_{i, t}}} \right)} \right)}^2}} \right)/\alpha {F_{m - 1}}\left( {{x_{i, t}}} \right) = \\ \;\;\;{Y_{i, t + k}} - {F_{m - 1}}\left( {{x_{i, t}}} \right) \end{array} $ | (5) |
where the variable in Eq. (5) is similar to Eq.(4) and α represents the correction factor. According to Eq. (5), hm is equivalent to the negative gradient of the squared loss function, and it proved that the GBRT algorithm could minimize the squared error loss function.
As a result, each boosting iteration regression tree is fitted to the current residuals. Enough regression trees could be added to the final model results, which would contribute to the final results. To avoid overfitting, a simple regularization strategy was utilized to scale the contribution of each regression tree by a factor v in Eq. (6). v is learning rate which scales the step length of the gradient descent procedure. The smaller the value of v is, the larger iteration value of the m is needed. Previous studies have suggested that the final results can be achieved earlier by setting a small learning rate v.
| $ {F_m}\left( x \right) = {F_{m - 1}}\left( x \right) + v{h_m}\left( x \right), v \in [0, 1] $ | (6) |
The feature importance is one of the advantages of the GBRT algorithm, which relies on the contribution of each tree to the model importance that can be reflected on the decrease direction of the negative gradient of the squared loss function. Each x tree importance can represent each design sensitivity to the building performance.
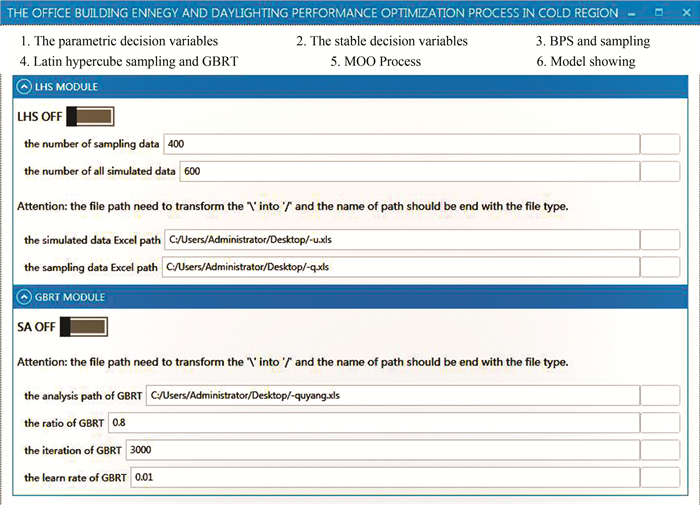
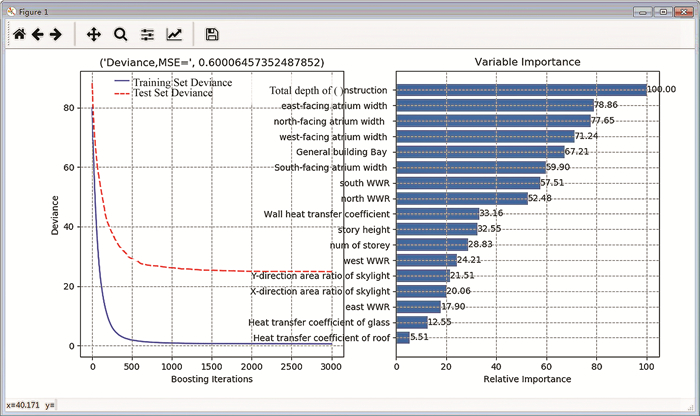
On the fourth interface of the DSM, there are two modules named "LHS module" and "SA module" (Fig. 6). In the LHS module, the number of the sampling data was defined as 600 and that of the simulated data was defined as 400. Then, the storage path of the simulated data and the sampling data can be put into the interface, and the LHS module is operated to obtain the building performance sampling data. In the GBRT module, the storage path of building performance sampling data, the GBRT ratio, the GBRT iteration, and the learning rate of GBRT should also be defined. Finally, designers can open the SA module and obtain the sensitivity rank of the design parameters (Fig. 7).
|
Fig.6 LHS and SA parameters setting |
|
Fig.7 Results of building design parameters SA |
As can been seen from the python figure of the design parameters SA results, the sensitivity ranking of the design parameters affecting building energy consumption performance is "total depth of construction — east facing atrium width — north facing atrium — west facing atrium — general building bay — south facing atrium — north WWR — wall heat transfer coefficient — storey height — number of storey — west WWR— Y-direction skylight length ratio — X-direction skylight length ratio — east WWR— heat transfer coefficient of windows — heat transfer coefficient of roof". In order to run the building performance MOO process, the top five design parameters were selected to put into the DSM, which are total depth of construction, east facing atrium width, north facing atrium, west facing atrium, general building bay, and south facing atrium.
After 648 h of MOO process, 132 feasible solutions were obtained, and there were 3 non-dominant solutions. Fig. 8 shows that the three non-dominant solutions were close to the coordinate axis and had excellent architectural performance among all Pareto solutions. The solution close to the UDI100-2000 axis had better indoor lighting performance, and that close to the energy consumption axis had lower building energy consumption. The solution located in the middle of the solution set space had better daylighting performance and lower energy consumption, whose UDI100-2000[17] was 37.94% and AEC performance was 76.28 kWh/(m2·a), indicating a better building performance than the optimized results in the previous case study[18]. In the previous study, the UDI100-2000 was calculated as 50.8% and the AEC performance was 78.39 kWh/(m2·a). Compared with the previous obtained values, the UDI100-2000 was not ideal, while the AEC performance could save 2.11 kWh/(m2·a). Therefore, the non-dominant solution in the middle of the solution set space was chosen as the final optimal solution in this study.

|
Fig.8 Building performance MOO results |
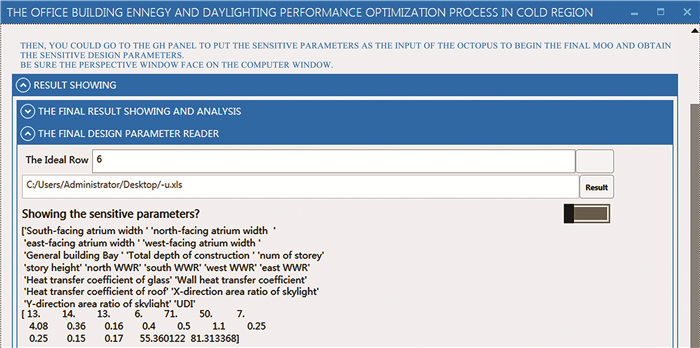
The detailed information of the best solution was recorded into the building performance MOO database which can be recalled into the interface of the HPBuildingDSM (Fig. 9). The optimized design parameters of the office building model are listed in Table 2, which presents the basic formation design parameters of the office building. After inputting the values of the recalled parameters of the design parameters into the DSM, the office building formation could be shown in the DSM interface(Fig. 10).
|
Fig.9 The optimized building model design parameters |
| Table 2 Values of the optimized building design parameters |

|
Fig.10 The optimized office building model |
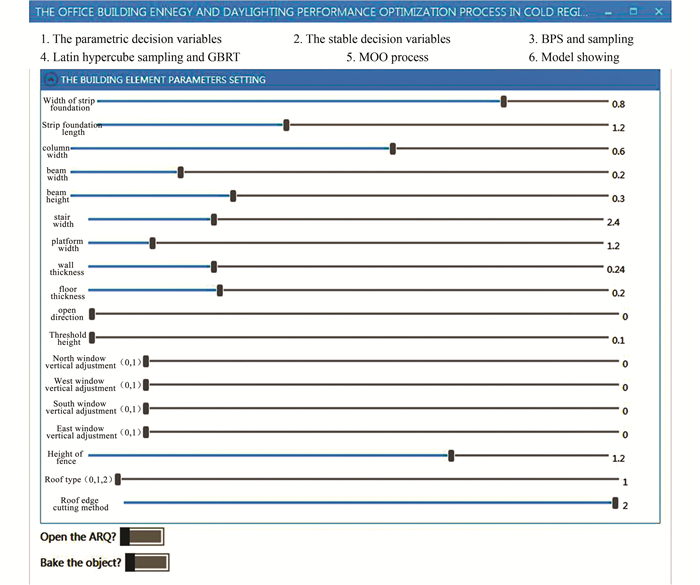
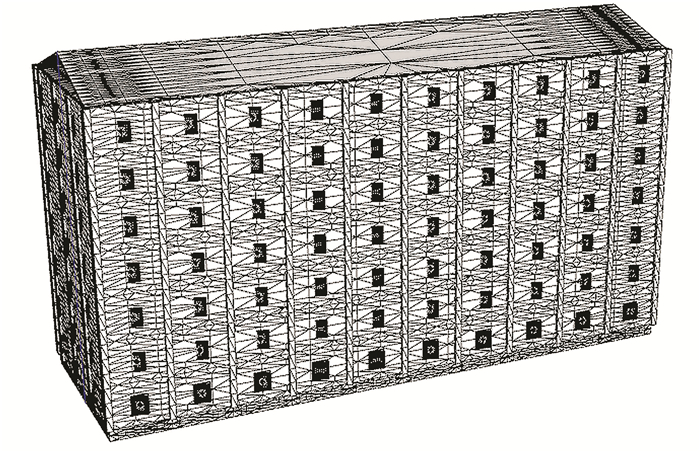
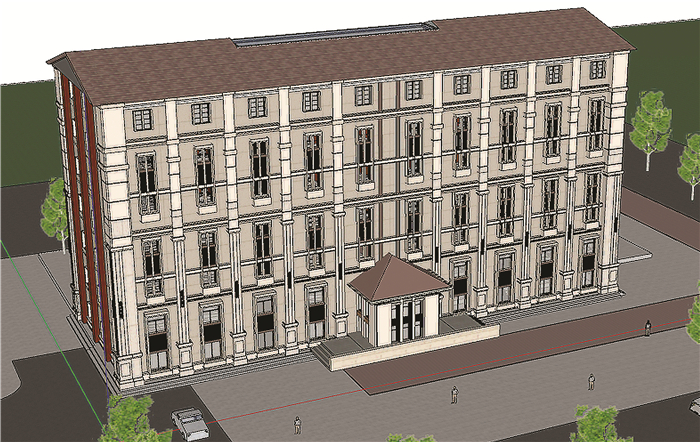
Besides, since the model is the typical energy-saving model, the detailed building structures such as stairs, beam, roof, and wall should be added based on the VISUAL ARQ plugin. In the last step, the dimension of the building structure is defined by the designers and the corresponding building structure parameters should be put into the DSM (Fig. 11). When pressing the button "Open the ARQ?", the virtual model can be shown in the Rhinoceros interface. When pressing the button "Bake the object?", the mesh model can be baked into the Rhinoceros, and the model will be transferred into the Sketch Up to add the building material (Fig. 12). Based on the subjective experience of the architects, the facade decoration components can be added to the building model to complete the energy-saving design scheme of the office building (Fig. 13).
|
Fig.11 Definition of the building structure parameters |
|
Fig.12 The basic typical model |
|
Fig.13 The final design scheme |
4 Conclusions
In this study, Python programming was used to develop the building design parameters SA module based on the GBRT algorithm to operate the parameters SA. The sensitivity ranking results could be demonstrated in the python figure, which would be more accurate than those of the traditional SA methods. Besides, the building MOO plugin was converted into a decision model that could operate the building performance simulation and the MOO process automatically to search for the ideal building design scheme. With the assistance of HPBuildingDSM, a high-performance office building design was operated. During the design process, the parametric building modeling, the BPS, the LHS, the SA, and the MOO process would be operated step by step to obtain the final building design parameters, which could lead to energy-saving and high-quality daylighting performances. Therefore, the corresponding UDI100-2 000 performance that met the requirement and the AEC value of the optimized building design scheme were 37.94% and 76.28 kWh/(m2·a), demonstrating the high-performance of the building design.
The development of the HPBuildingDSM can provide guidance for junior architects to design high-performance buildings easily, for it can reduce manpower and time cost to obtain a high-performance architecture design scheme. In the future, we would like to increase the optimized building performance category in the HPBuildingDSM, such as building ventilation optimization and thermal comfort. Besides, the MOO algorithm could also be rewritten or replaced to make the MOO process more efficient and time-saving. Moreover, more database of the weather and building design parameters should be collected in different areas around the world so that the HPBuildingDSM can be applied in both cold and warm regions.
| [1] |
Wang N, Zhao W J, Wu N, et al. Multi-objective optimization: a method for selecting the optimal solution from Pareto non-inferior solutions. Expert Systems with Applications, 2017, 74: 96-104. DOI:10.1016/j.eswa.2017.01.004 (  0) 0) |
| [2] |
Touloupaki E, Theodosiou T. Optimization of building form to minimize energy consumption through parametric modelling. Procedia Environmental Sciences, 2017, 38: 509-514. DOI:10.1016/j.proenv.2017.03.114 (  0) 0) |
| [3] |
Gao H, Koch C, Wu Y P. Building information modelling based building energy modeling: a review. Applied Energy, 2019, 238: 320-343. DOI:10.1016/j.apenergy.2019.01.032 (  0) 0) |
| [4] |
Palme M, Inostroza L, Villacreses G, et al. From urban climate to energy consumption. Enhancing building performance simulation by including the urban heat island effect. Energy and Buildings, 2017, 145: 107-120. DOI:10.1016/j.enbuild.2017.03.069 (  0) 0) |
| [5] |
Purup P B, Petersen S. Research framework for development of building performance simulation tools for early design stages. Automation in Construction, 2020, 109: 26-41. DOI:10.1016/j.autcon.2019.102966 (  0) 0) |
| [6] |
Gaspari J, Fabbri K, Cancellari T, et al. The use of building performance simulation to support architectural design: a case study. Energy Procedia, 2017, 122: 205-210. DOI:10.1016/j.egypro.2017.07.346 (  0) 0) |
| [7] |
Rahmani Asl M, Zarrinmehr S, Bergin M, et al. BPOpt: a framework for BIM-based performance optimization. Energy and Buildings, 2015, 108: 401-412. DOI:10.1016/j.enbuild.2015.09.011 (  0) 0) |
| [8] |
Bouchlaghem N M, Letherman K M. Numerical optimization applied to the thermal design of buildings. Building and Environment, 1990, 25(2): 117-124. DOI:10.1016/0360-1323(90)90023-K (  0) 0) |
| [9] |
Zhang J F. Exploration of the implication of single factor sensitivity analysis in a construction project. Gansu Science and Technology, 2008, 24(8): 106-107. DOI:10.3969/j.issn.1000-0952.2008.08.040 (  0) 0) |
| [10] |
Lamboni M. Multivariate sensitivity analysis: minimum variance unbiased estimators of the first-order and total-effect covariance matrices. Reliability Engineering and System Safety, 2019, 187: 67-92. DOI:10.1016/j.ress.2018.06.004 (  0) 0) |
| [11] |
Delgarm N, Sajadi B, Azarbad K, et al. Sensitivity analysis of building energy performance: a simulation-based approach using OFAT and variance-based sensitivity analysis methods. Journal of Building Engineering, 2018, 15: 181-193. DOI:10.1016/j.jobe.2017.11.020 (  0) 0) |
| [12] |
Guo R, Hu Y, Liu M Z, et al. Influence of design parameters on the night ventilation performance in office buildings based on sensitivity analysis. Sustainable Cities and Society, 2019, 50: 01041-01058. DOI:10.1016/j.scs.2019.101661 (  0) 0) |
| [13] |
Marks W. Multicriteria optimization of the shape of energy-saving buildings. Building and Environment, 1997, 32(4): 331-339. DOI:10.1016/S0360-1323(96)00065-0 (  0) 0) |
| [14] |
Yigit S, Özorhon B. A simulation-based optimization method for designing energy efficient buildings. Energy and Buildings, 2018, 178: 216-227. DOI:10.1016/j.enbuild.2018.08.045 (  0) 0) |
| [15] |
Fang Y, Cho S. Design optimization of building geometry and fenestration for daylighting and energy performance. Solar Energy, 2019, 191: 7-18. DOI:10.1016/j.solener.2019.08.039 (  0) 0) |
| [16] |
Sommer B, Pont U. Energy design by evolution: applying evolutionary computing to energy efficient architectural design. Advanced Materials Research, 2014, 889: 120-125. DOI:10.4028/www.scientific.net/AMR.899.120 (  0) 0) |
| [17] |
Nabil A, Mardaljevic J. Useful daylight illuminances: a replacement for daylight factors. Energy and Buildings, 2006, 38(7): 905-913. DOI:10.1016/j.enbuild.2006.03.013 (  0) 0) |
| [18] |
Han Y S. Research on the Building Form Digital Energy-Eficient Design for Office Building in Severe Cold Region. Harbin: Harbin Institute of Technology, 2016. (in Chinese)
(  0) 0) |
 2021, Vol. 28


