2. Key Laboratory of Building Fire Protection Engineering and Technology of MPS, Tianjin 300381, China;
3. Shanghai Beststeel Steel Structure Building System Co., Shanghai 200949, China
In recent years, cold-formed steel (CFS) building structures, as a kind of natural green and industrialized architecture, have undergone rapid development. Meanwhile, due to the merits of convenient construction, simple operation and firm connection, screws are widely used as steel stud-to-stud connections and stud-to-sheathing connections in CFS structures. CFS stud-to-sheathing connections can provide effective restraint for the wall assemblies in CFS structures, which will improve the bearing capacity of wall assemblies. Hence, the mechanical properties of screw connections are basic parameter for the design and modeling of CFS walls. Because the fire resistance is an important issue for the design of mid-rise CFS structures, it becomes necessary to thoroughly investigate the mechanical properties of screw connections at elevated temperature.
Regarding studies on steel stud-to-sheathing screw connections, Buonopane et al.[1] studied the lateral performance of CFS shear walls and found that screws distributed on the periphery of the sheathing of CFS shear walls mainly bore shear force from two directions: parallel to the direction of the loaded sheathing edge and perpendicular to the direction of the loaded sheathing edge; in addition, most screws were subjected to shear force parallel to the direction of the loaded sheathing edge. The test device that was used in previous research focused more on the shear force that was perpendicular to the direction of the loaded sheathing edge[2-3], which does not align with the force on screws in actual structures. Nithyadharn and Kalyanaraman[4] designed a new type of experimental loading device for investigating the shear force that is parallel to the direction of the loaded sheathing edge to which the steel stud-to-sheathing screw connections were subjected.
In addition, various experimental and numerical investigations have been conducted to determine the mechanical properties of cold-formed steel-to-steel screwed connections at elevated temperatures. For instance, the research group of Prof. Young conducted a series of experimental and numerical investigations on the mechanical behavior of shear connections (bolted connections and screwed connections) in cold-formed, thin sheet, carbon steel and cold-formed, stainless steel at elevated temperatures[5-9]. The results were compared with the current specifications, and useful suggestions, such as bearing factors, were proposed for the prediction of the shear strength of these connections at elevated temperatures. Lu et al.[10-11] developed a 3D finite element model to predict the shear behaviors of single-shear sheeting-to-truss shot-nailed and screwed connections at elevated temperatures. The effects of plate curling and the contributions of frictional forces were analyzed. In addition, Chen et al.[12] conducted a single-shear experimental investigation on 225 single-shear tests of cold-formed steel-to-steel screwed connections at elevated temperatures. A conservative prediction on the shear strength of these screwed connections at elevated temperatures was presented, which was based on the AISI specification and the reduced material properties of the corresponding cold-formed steel. Moreover, the shear performances of CFS shear connections with sheathing boards (such as gypsum plasterboard, calcium silicate board, and oriented strand board) at ambient temperature have been investigated in the literature[13-14]. However, limited to the size of furnace, the investigations on the mechanical behavior of CFS screwed connections with sheathing boards at elevated temperatures are still very inadequate, especially for the double-shear experiments at elevated temperatures. Chen et al.[15] conducted approximately 200 monotonic single-shear tests of 1.0-mm-thick G550 (with a nominal yield strength of 550 MPa) CFS screwed connections with gypsum sheathing at elevated temperatures and proposed a reduction factor to predict the shear strength of these connections at elevated temperatures. Moreover, due to the limited data on CFS stud-to-sheathing screw connections at elevated temperatures, the previous numerical models of CFS walls do not consider the failure of screwed connections under fire conditions.
In the present study, three types of sheathings, namely, mid- and low-density calcium-silicate boards (CS boards) and common oriented strand board, were selected to investigate the impacts of shear directions on the mechanical properties of screw connections. In the high-temperature experimental study, 253 steel stud-to-sheathing screw connections were considered, and the temperature-dependent trend of the load-displacement curve, the temperature-dependent trends of the characteristic parameters, and the impacts of the test variables on the peak load and the peak deformation of the screw connections were discussed.
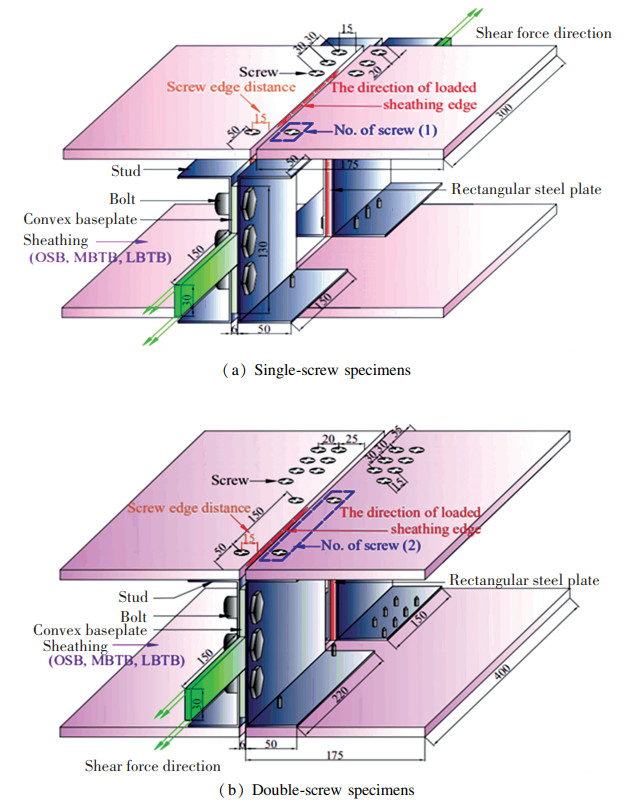
1 Experiment Overview 1.1 Specimen DesignFigs. 1 and 2 show the configuration of specimens that considered the shear directions on the screws (parallel to the direction of the loaded sheathing edge and perpendicular to the direction of the loaded sheathing edge). The self-drilling bugle head screws were used in the experiments and the screw diameter was 4.8 mm. The double-screw connections were also considered for the case in which the shear direction was parallel to the direction of the loaded sheathing edge. For specimens with single-screw connections that were subjected to shear that was parallel to the direction of the loaded sheathing edge (Fig. 1(a)), the upper part of each specimen was composed of two C-type back-to-back studs with a convex baseplate in the middle, which were combined by 3 bolts. The lower-part configuration of the specimen was similar to the upper-part configuration. After the upper and lower steel studs were assembled, 4 test sheathings were assembled to the steel stud flange by screws. The upper end was the test end, with 1 screw fixed on each sheathing, and the lower end was the fixed end, with 3 screws fixed on each sheathing to protect the fixed end from damage. For specimens with double-screw connections (Fig. 1(b)), the space between the two screws was defined as 150 mm based on the screw spacing on actual CFS wall sheathings, and the screws on the lower fixed end were adjusted to protect the fixed end from damage.
|
Fig.1 Specimens subjected to shear parallel to the direction of the loaded sheathing edge(Unit: mm) |
|
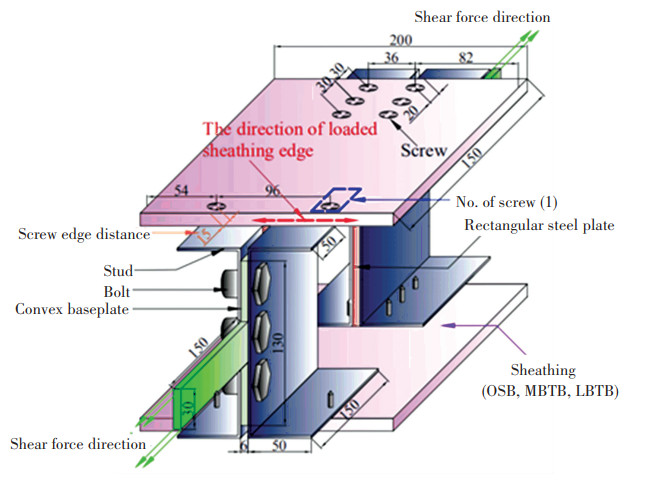
Fig.2 Specimens subjected to shear perpendicular to the direction of the loaded sheathing edge(Unit: mm) |
For specimens that were subjected to shear perpendicular to the direction of the loaded sheathing edge (Fig. 2), considering the dimension of test furnace, only a single-screw connection was made. Since the screw was close to the upper sheathing edge when the shear was perpendicular to the direction of the loaded sheathing edge, the loaded sheathing area was mainly concentrated on the screw; thus, the loaded area was small. When two screws were far from each other, combining two sheathings into one sheathing did not affect the loading condition of the sheathing. As a result, the configuration of each specimen was changed from the original 4 sheathings to 2 sheathings, and the test end screws were arranged as close as possible to the C-type stud curling to maintain the maximum distance between two screws to avoid the mutual influence of two screws on the sheathing.
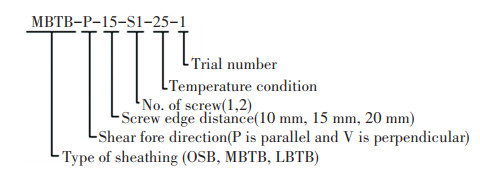
In addition, all specimens were labeled in a unified format. The format was made of four items, type of sheathing, shear force direction, screw edge distance, number of screws, tensile temperature and test sequence in the same group, from left to right, as shown in Fig. 3. For simplified representation, MBTB denotes 9.0 mm thick mid-density CS board with the density of approximately 1400 kg/m3, LBTB denotes 12.0 mm thick low-density CS board with the density of approximately 950 kg/m3 and OSB denotes 9.0 mm thick mid-density CS board with the density of approximately 700 kg/m3. Table 1 lists the configuration of all stud-to-sheathing screw connections.
|
Fig.3 Specimen label |
| Table 1 Configuration of the stud-to-sheathing connections |
1.2 Test setup and procedure
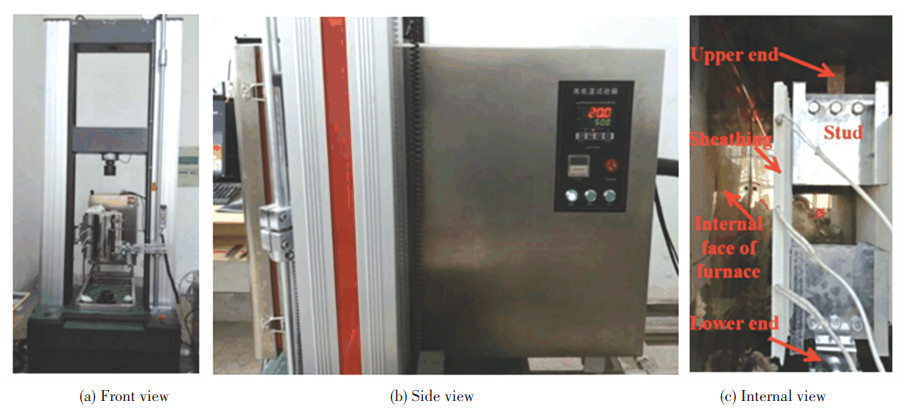
The test was conducted at Southeast University. The loading device was an UTM4000 electronic universal material testing machine (Fig. 4 (a)) with a loading capacity of 30 kN. The heating device was a rectangular environment box (Fig. 4(b)) with the internal size 400 mm×400 mm×500 mm (length×width×height). The internal view of the furnace is shown in Fig. 4(c). According to the average temperature collected by the thermocouples, the environment box controlled the hot air blower to heat by air convection and the corresponding maximum temperature was 250 ℃.
|
Fig.4 Universal material testing machine with a high-temperature test chamber |
A steady-state test procedure is conducted. At the beginning of the experiments, the specimen is mounted into the loading machine by gripping the upper end of the specimen and relaxing the lower end (Fig. 4(c)). Next, the furnace is heated to a temperature of approximately 30 ℃ lower than the preset target temperature at a heating rate of 15 ℃/min. Then, the furnace temperature is kept constant for approximately 10 min to ensure a uniform temperature environment. Subsequently, the furnace is heated to the target temperature using a slow heating rate of 5 ℃/min to avoid overheating and maintained for approximately 120 min to ensure a uniform target temperature distribution for the specimen. Then, the lower end of the specimen is manually gripped and the lower clamp of testing machine is locked. As the upper clamp of testing machine moves upward, a monotonic tension load is gradually applied to the specimen at a constant displacement rate of 0.025 mm/s until failure while maintaining the preset target temperature. Fig. 5 shows a typical example of the temperature control curve for the present tests. In addition, during the experiment, the displacement of the upper clamp is recorded by the displacement sensor of the test machine and is approximately treated as the deformation of specimen.

|
Fig.5 Temperature control curve for the present tests |
Five temperature conditions were selected for screw connections with OSB sheathing: 25 ℃, 50 ℃, 75 ℃, 100 ℃ and 150 ℃; six temperature conditions were selected for screw connections with MBTB sheathing: 25 ℃, 50 ℃, 75 ℃, 100 ℃, 150 ℃ and 200 ℃; and seven temperature conditions were selected for screw connections with LBTB sheathing: 25 ℃, 50 ℃, 75 ℃, 100 ℃, 150 ℃, 200 ℃ and 250 ℃. According to the AISI Cold-formed Steel Design Manual[16], each series was tested and repeated 2 times; if the relative error between the bearing capacity of the generic specimen and the average bearing capacity of the series was less than 10%, the number of specimens for this series was two; otherwise, the third specimen was performed, and if the relative error was not within 15%, the forth specimen was performed.
2 Visual Observation and Failure Mode 2.1 Stud-to-Sheathing Connections with MBTB and LBTBBoth MBTB and LBTB have significant brittleness. During the experiments, stud-to-sheathing connections with MBTB and LBTB sheathings displayed obvious descent stages on their load-displacement curves and similar failure mode. Both experiments were ended due to sheathing damage, and no screw tilting phenomena were identified during the experiment. The varied temperature conditions did not affect the failure modes, and the screw connection with the LBTB sheathing is considered as an example.
(1) Shear parallel to the direction of the loaded sheathing edge
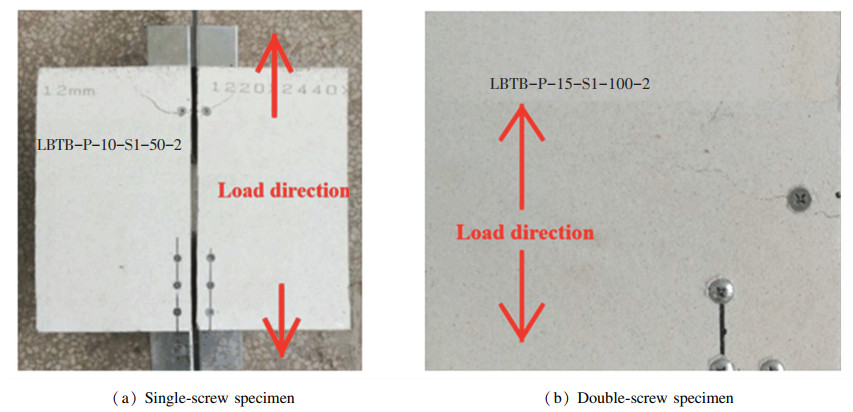
When the shear was parallel to the direction of the loaded sheathing edge, for specimens with single-screw connections, cracks initiated from the sheathing edge around the screw and rapidly grew upwards into arc-shaped cracks, and the sheathing corner area near the screw was damaged, thereby resulting in specimen damage. The final failure modes of specimens were as shown in Fig. 6(a). For specimens with double-screw connections, the sheathing was damaged at the lower screw, with cracks initiated from the screw and propagated along the horizontal direction to the sheathing edge. The sheathing was damaged due to transverse overtension, which generated tiny cracks, as shown in Fig. 6(b).
|
Fig.6 Failure of LBTB screw connections (shear parallel to the direction of the loaded sheathing edge) |
(2) Shear perpendicular to the direction of the loaded sheathing edge
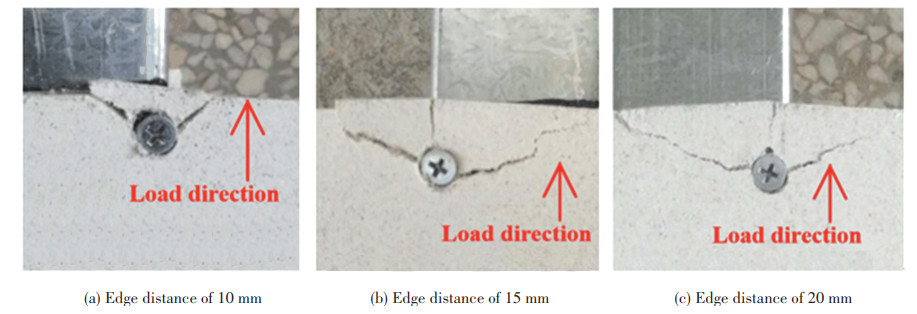
When the shear was perpendicular to the direction of the loaded sheathing edge, the failure mode was exhibited as sheathing end damage, with two cracks that initiated from the screw and propagated obliquely upwards toward the sheathing edge. Most specimens also had a vertical crack that initiated from the screw, and the damage area at the sheathing end expanded with increasing edge distance, as shown in Fig. 7.
|
Fig.7 Failure of LBTB screw connections (shear perpendicular to the direction of the loaded sheathing edge) |
2.2 Stud-to-Sheathing Connections with OSB Sheathing
During the experiment, the OSB board around the screws was deformed due to screw extrusion, which was manifested as satisfactory ductility of steel stud-to-OSB sheathing connections. The failure modes and visual observations of such screw connections were significantly different from those of the screw connections on the other two types of sheathings, and the varied temperature conditions did not impact the failure modes or visual observations.
(1) Shear parallel to the direction of the loaded sheathing edge
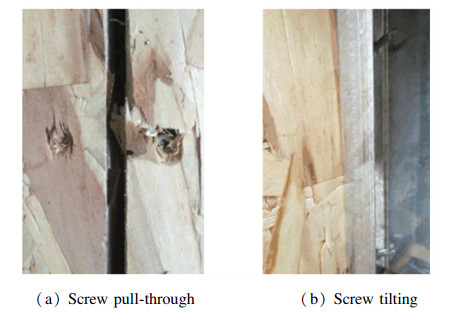
When the shear was parallel to the direction of the loaded sheathing edge, for specimens with single-screw connections, when the edge distance was 10 mm, the visual observations were as shown in Fig. 8. The screw gradually tilted and obliquely extruded its surrounding sheathing until breakage. As the tilting gradually increased, the screw pulled through the sheathing and intensified the local damage of the sheathing at the screw, and lamination cracks occurred along the thickness of the sheathing. When the experiment ended, the screw had severely pulled through the sheathing, and its restraint of the sheathing was also significantly weakened, with evident extrusion damage of the local sheathing at the screw. For specimens with an edge distance of 15 mm, the screw tilted and pulled through the sheathing, and lamination cracks were displayed on the upper sheathing end of a few specimens. For specimens with an edge distance of 20 mm, since the edge distance was further increased, oblique damage and lamination cracks no longer occurred in the sheathing; instead, the screw constantly tilted and pulled through the sheathing with increasing displacement.

|
Fig.8 Visual observations on OSB stud-to-sheathing connections subjected to shear parallel to the screw edge (with an edge distance of 10 mm) |
For specimens with double-screw connections that were subjected to shear that was parallel to the direction of the loaded sheathing edge, similar visual observations were made, as shown in Fig. 9. The screws tilted and pulled through the sheathing. The upper screws of a few specimens were pulled from the sheathings, and the OSB sheathings were more severely extruded and damaged by the screws.
|
Fig.9 Failure of the OSB stud-to-sheathing connections subjected to shear parallel to the direction of the loaded sheathing edge |
(2) Shear perpendicular to the direction of the loaded sheathing edge
When the shear was perpendicular to the direction of the loaded sheathing edge, the visual observations were as shown in Fig. 10. The displacement increased as the load increased, the sheathing end around the screw was extruded and damaged by the screw, and, finally, it was extruded out. Meanwhile, the screw tilted more severely with increasing edge distance. Last, when the specimen broke, the screw had already deviated from its original position but no pull-through was observed. The damage to the sheathing end was more severe when the edge distance was small.

|
Fig.10 Failure of the OSB stud-to-sheathing connections subjected to shear perpendicular to the direction of the loaded sheathing edge |
3 Test Results 3.1 Load-Displacement Curves
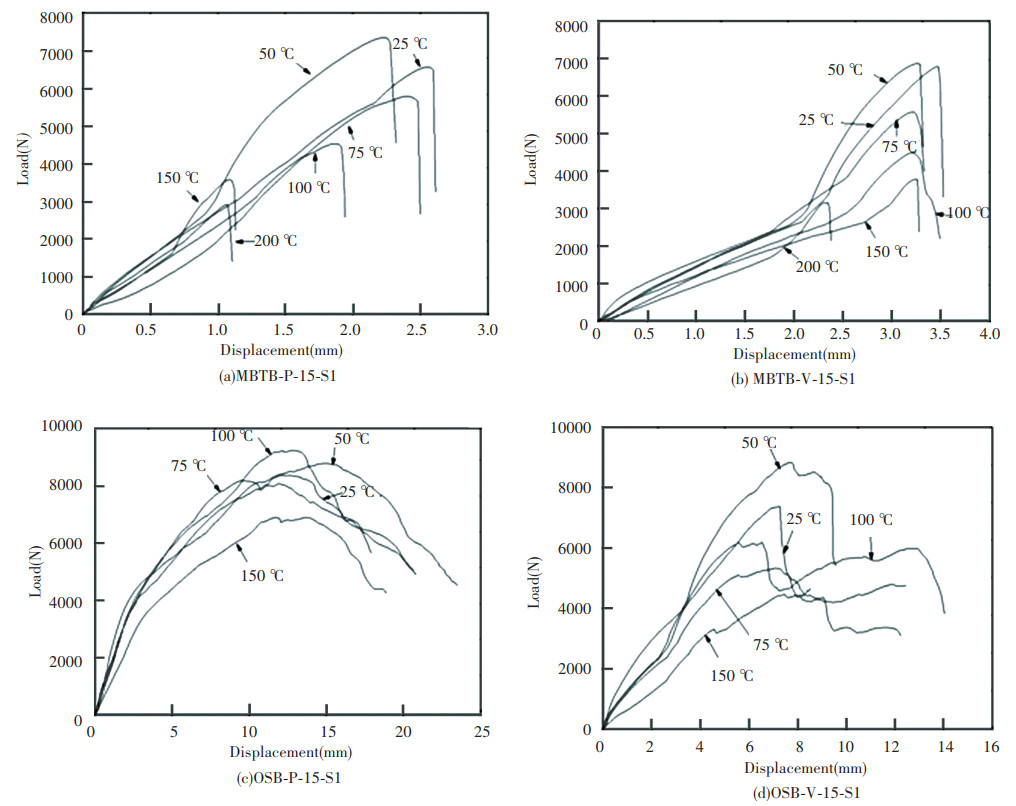
This section considers MBTB and OSB sheathings as examples and considers two shear directions. Since repeated specimens of the same series displayed similar curves under the same temperature conditions, only one specimen was selected, and its load-displacement curve is plotted in Fig. 11.
|
Fig.11 Load-displacement curves of stud-to-sheathing connections at elevated temperatures |
In Fig. 11, for MBTB and LBTB stud-to-sheathing connections, damages were caused by sheathing brittleness, which corresponds to sharp descents in their load-displacement curves; however, screw connections with OSB sheathing displayed ductile failure without sudden descent but with fluctuations in its load-displacement curve, especially when the shear was perpendicular to the direction of the loaded sheathing edge. Such fluctuations reflected the process of the screw extruding the wood shavings to sheathing failure. Additionally, as shown in Fig. 11(b), beyond approximately 2 mm of displacement, the tangent stiffness (slope) of the load-displacement curves became significantly higher than the corresponding initial stiffness (slope). In this paper, such phenomenon was called as increasing stiffness which might be caused by the following factors. The displacement was a joint result of sheathing tensile deformation and deformation of other parts. Each specimen bore the tensile load with its 4 screws. Due to assembly errors, the loads on the 4 screws differed at the initial stage of the experiments. Thereafter, the force on each screw would become evenly distributed and the displacement of the specimen was mainly caused by the deformation of loaded sheathing. Meanwhile, the corresponding tangent stiffness might become higher than the initial stiffness.
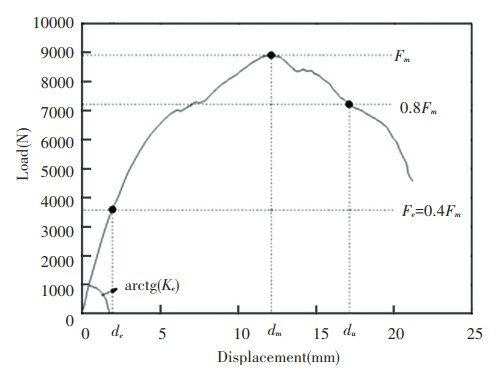
3.2 Determination of the Characteristic ParametersTo more accurately describe the load-displacement curves of steel stud-to-sheathing connections, the curve rules were characterized. With reference to ECCS recommendations[17] and relevant literature[14-15], the following characteristic parameters were used, as presented in Fig. 12.
|
Fig.12 Characteristic parameters in load-displacement curve |
Fm: Peak load, which represents the load that corresponds to the highest point on the load-displacement curve;
dm: Peak deformation, which represents the deformation that corresponds to the peak load;
Fe: Elastic strength and Fe=0.4Fm;
de: Deformation, which corresponds to the elastic strength;
Ke: Elastic stiffness and Ke=Fe/de;
du: Failure deformation, which represents the deformation that corresponds to the point at which the load decreases to 0.8Fm.
Fig. 13 presents the temperature-dependent trends of the peak load, the peak deformation and the elastic stiffness for MBTB stud-to-sheathing connections, in which the peak load and the peak deformation values are the average values over the series under the same temperature condition, and the elastic stiffness is plotted as a scatter diagram. The peak load and the peak deformation decreased as the temperature increased, and the decrease in the peak load was nearly linear. There was no significant difference between two single-screw specimens that were subjected to different shear directions in terms of their peak load variation with temperature. For specimens that were subjected to shear forces that were parallel to the screw edge distance and perpendicular to the screw edge distance, the peak loads decreased by 59.0% and 55.6%, respectively, at 200 ℃. The peak deformations of the specimens did not exceed 4 mm, and they decreased by 41.0% and 58.1%, respectively, at 200 ℃ for specimens that were subjected to shear forces that were parallel to the screw edge distance and perpendicular to the screw edge distance. No trend was observed in the stiffness variation with temperature; however, the variation was within a limited range. When the shear was perpendicular to the screw edge distance, its variation range was within 934.7-1663.1 N/mm, and when the shear direction was parallel to the screw edge distance, its variation range was within 2092.9-3265.7 N/mm. The temperature-dependent trends of all the characteristic parameters of LBTB stud-to-sheathing connections were quite similar to those of MBTB stud-to-sheathing connections, while the characteristic parameters of OSB stud-to-sheathing connections slightly changed with temperature within a small range, which will not be discussed here.

|
Fig.13 Temperature-dependent trends of all the characteristic parameters of MBTB stud-to-sheathing connections |
4 Discussion
This section investigates the impacts of various test variables on the temperature-dependent trends of the peak load and the peak deformation. All values of the peak load and the peak deformation are the average of that of specimens in the same series at the same temperature.
4.1 Shear DirectionFig. 14 shows the impact of shear direction of three sheathing connections on the temperature-dependent trends of the peak load for three kinds of stud-to-sheathing connections. In this figure, for MBTB connections, the shear direction has no significant effect on the peak load of specimens; but for LBTB connections, the peak loads under shear parallel to the direction of the loaded sheathing edge were all higher than those under shear perpendicular to the direction of the loaded sheathing edge, with an average increase ratio of 26.9%. When the screw edge distance was 10 mm and 20 mm, respectively, for both of MBTB and LBTB sheathings, it was still the peak load under shear that was parallel to the screw edge distance that remained higher. For OSB stud-to-sheathing connections, when the screw edge distance was 15 mm, the peak loads of specimens under shear that was parallel to the screw edge direction were all higher than those of specimens under shear that was perpendicular to the screw edge direction (this rule also applied when the edge distance was 10 mm) under all temperature conditions, but no substantial difference existed between the specimens under shear of two directions when the screw edge distance was 20 mm.

|
Fig.14 Impact of shear direction of stud-to-sheathing connections on peak load |
Fig. 15 shows the impact of shear direction on the temperature-dependent trend of the peak deformation for three kinds of stud-to-sheathing connections. It can be seen from the figure that, compared with peak load, the impact of shear direction on peak deformation was even higher. For the MBTB and LBTB stud-to-sheathing connections, all the peak loads of specimens under shear perpendicular to the screw edge direction were higher than those of the specimens under shear parallel to the screw edge direction, with an average increase ratio of 71.7% and 39.8% respectively. For the OSB stud-to-sheathing connections, the peak deformation slightly varied with temperature. The peak deformation of the specimens under shear that was parallel to the direction of the loaded sheathing edge was much higher than that of the specimens under shear that was perpendicular to the direction of the loaded sheathing edge, with a general increase of greater 4 mm. When the temperature was 150 ℃, compared with the specimen OSB-V-15-S1, the peak deformation of the specimen OSB-P-15-S1 was increased by 6.259 mm, and the corresponding amplitude was 89.2%. The reason can be attributed to the better ductility of the specimens under shear parallel to the direction of the loaded sheathing edge.

|
Fig.15 Impact of shear direction of stud-to-sheathing connections on peak deformation |
4.2 Screw Edge Distance
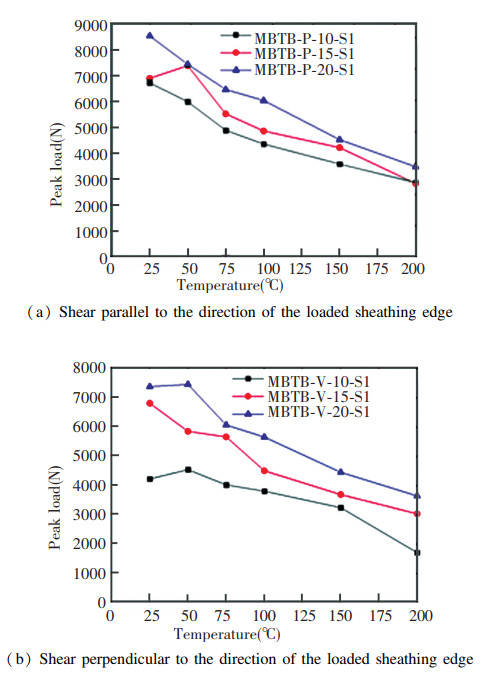
The various sheathings with distinct material properties are applied in different specimen, which leads to different peak load of different specimen. Fig. 16 shows the impact of various screw edge distances on the temperature-dependent trend of the peak load. This figure shows that the peak load of the specimens increases with increasing screw edge distance regardless of the shear direction, and the range of the increase in the peak load caused by increasing screw edge distance varied at different temperatures. When the shear was parallel to the direction of the loaded sheathing edge, the average load peak of the specimens with edge distances of 15 mm and 20 mm at different temperature is 20.0% and 28.0% higher respectively than that of the specimens with edge distance of 10 mm. When the shear was perpendicular to the direction of the loaded sheathing edge, the average load peak of the specimens with edge distances of 15 mm and 20 mm at different temperature is 40.4% and 65.3% higher respectively than that of the specimens with edge distance of 10 mm. It is probably because that increasing the screw edge distance enlarges the applied force area between sheathing edge and the screw. In addition, when the shear was perpendicular to the direction of the loaded sheathing edge, curves of different specimens were far from each other, which indicated that screw edge distance had more obvious impact on peak load when the shear was perpendicular to the direction of the loaded sheathing edge.
|
Fig.16 Impact of screw edge distance of MBTB stud-to-sheathing connections on peak load |
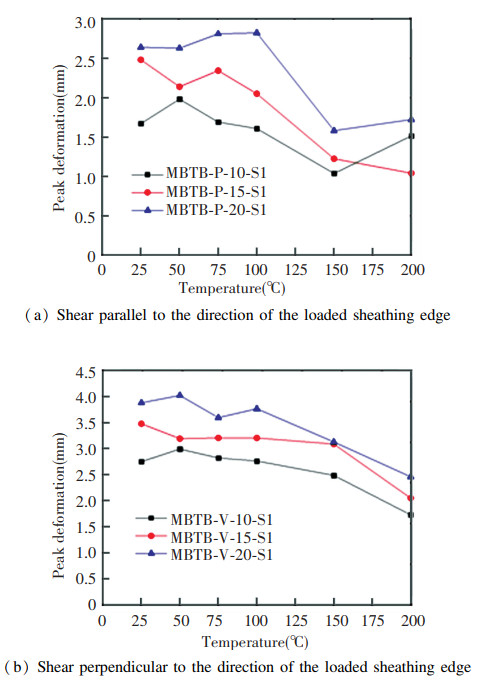
Fig. 17 shows the impact of screw edge distance on the peak deformation, also considering two shear directions. It can be seen from the figure that peak deformation increases with increasing screw edge distance regardless of shear direction, and the impact was more severe when shear was parallel to the direction of the loaded sheathing edge. When the shear was parallel to the direction of the loaded sheathing edge, the average peak deformation of the specimens with edge distances of 15 mm and 20 mm was 18.2% and 49.8% higher respectively than that of the specimens with edge distance of 10 mm. When the shear was perpendicular to the direction of the loaded sheathing edge, the average peak deformation of the specimens with edge distances of 15 mm and 20 mm was 17.6% and 34.5% higher respectively than that of the specimens with edge distance of 10 mm. For LBTB stud-to-sheathing connections, the impact of their screw edge distance displayed trends similar to those of the MBTB stud-to-sheathing connections.
|
Fig.17 Impact of screw edge distance of MBTB stud-to-sheathing connections on peak deformation |
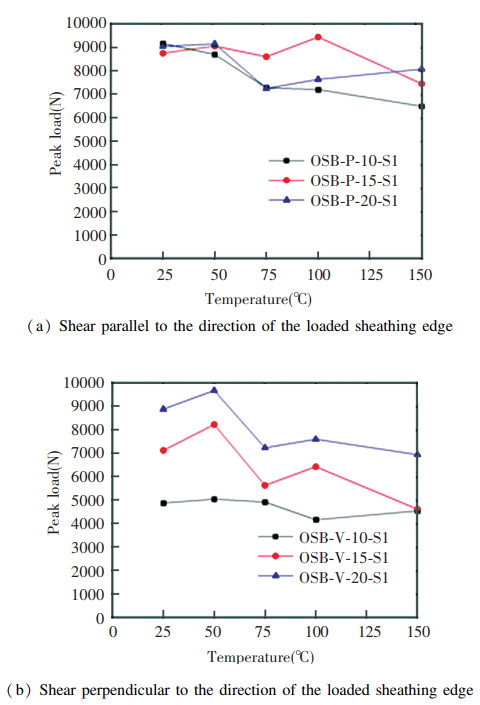
Fig. 18 shows the impact of screw edge distance on the temperature-dependent trend of the peak load for the OSB stud-to-sheathing connections. According to the figure, when the shear was parallel to the direction of the loaded sheathing edge, there were no obvious trend between the screw edge distance and the peak load. In contrast, when the shear was perpendicular to the direction of the loaded sheathing edge, the screw edge distance displayed higher impact on the peak load, and the peak load of specimens increased with increasing screw edge distance. The average peak load of the specimens with edge distance of 15 mm and 20 mm was 41.1% and 77.3% higher than that of the specimens with edge distance of 10 mm.
|
Fig.18 Impact of screw edge distance of OSB stud-to-sheathing connections on peak load |
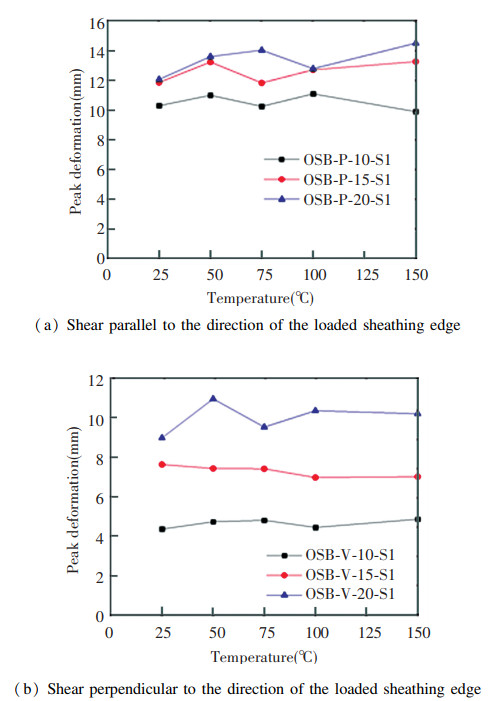
Fig. 19 shows the impact of shear direction on the temperature-dependent trend of the peak deformation for OSB stud-to-sheathing connections. It can be seen from the figure that, for different shear directions, the peak deformation increased with increasing screw edge distance, and the three curves in the figure were far from each other when the shear was perpendicular to the screw edge distance, which indicated that screw edge distance had a quite significant impact on the peak deformation when the shear was perpendicular to the direction of the loaded sheathing edge. When the shear was parallel to the direction of the loaded sheathing edge, the average load peak of the specimens with edge distances of 15 mm and 20 mm was 20.0% and 28.0% higher respectively than that of the specimens with edge distance of 10 mm. When the shear was perpendicular to the direction of the loaded sheathing edge, the average peak deformation of the specimens with edge distances of 15 mm and 20 mm was 51.4% and 106.8% higher respectively than that of the specimens with edge distance of 10 mm.
|
Fig.19 Impact of the screw edge distance of OSB stud-to-sheathing connections on the peak deformation |
4.3 Number of Screws
Fig. 20 shows the impact of the number of screws on the temperature-dependent trend of the peak load. For the MBTB and LBTB stud-to-sheathing connections, the peak load increased significantly for specimens with double-screw connections compared with the specimens with single-screw connections but far less than doubled, and as the temperature increased, the peak load was less strongly affected by the number of screws. The increase ratio of the peak load attained its highest value at 75 ℃ for the MBTB stud-to-sheathing connections, and the peak loads of specimens with double-screw connections were 1.69 times those of specimens with single-screw connections, which represents an increase of 3814.5 N. However, as the temperature increased, the peak loads of the specimens with double-screw connections were only 898.7 N higher than (1.32 times) those of the specimens with single-screw connections at 200 ℃. The increase ratio of the peak load attained its highest value at 100 ℃ for the LBTB stud-to-sheathing connections, with peak loads of the double-screw specimens that were 1.48 times those of the single-screw specimens, and the peak loads were less strongly affected by the number of screws after 150 ℃. For the OSB stud-to-sheathing connections, the peak loads significantly increased for specimens with both double-screw and single-screw connections, and the increase ratio ranked first among the three kinds of sheathings. The peak loads of the specimens with double-screw connections were 2.06 times those of the specimens with single-screw connections at 25 ℃, which was more than double. The peak loads of the specimens with double-screw connections were 6784.1 N higher than those of the specimens with single-screw connections on average, which corresponds to an increase ratio of 78.6%.

|
Fig.20 Impact of the number of screws on the peak load |
Fig. 21 shows the impact of the number of screws on the temperature-dependent trend of the peak deformation. For the MBTB and LBTB stud-to-sheathing connections, the peak deformations significantly increased for the specimens with single-screw connections compared with those of the specimens with double-screw connections, with average increase ratios of 71.7% and 112.7%, respectively. For the OSB stud-to-sheathing connections, the peak deformation was not significantly affected by the number of screws, which may be because as the screw pulled through the sheathing, the bearing capacity gradually decreased, and both types of specimens suffered almost the same deformations due to the same extent of screw pull-through when the peak load was reached.

|
Fig.21 Impact of the number of screws on the peak deformation |
5 Load-Displacement Curve Model at Elevated Temperatures
The load-displacement curves of the screw connections under various temperature conditions are the fundamental data for the follow-up numerical simulation studies at elevated temperatures. Since many specimens were involved in the experiment, it is rather inconvenient to use the load-displacement curves that were generated from the experiment. As a result, it is very important to establish a simplified load-displacement model for the convenience of follow-up studies and data application. The peak load, peak deformation and elastic stiffness are the important characteristic parameters that can be obtained from the load-displacement curves. This section establishes a simplified load-displacement model of the stud-to-sheathing connections at elevated temperatures by predicting the characteristic parameters and considering the practical meanings of the characteristic parameters and the patterns of the load-displacement curves of the stud-to-sheathing connections during the experiment.
5.1 The Determination of Fitting EquationsBased on the temperature-dependent trends of the peak load, peak deformation and elastic stiffness of three types of sheathings, the peak load and peak deformation decreased as temperature increased, while the elastic stiffness displayed high discreteness but varied within a limited range. The unified linear formulas, namely, formulas (1), (2) and (3), were used to fit the peak load, peak deformation and elastic stiffness, respectively, which satisfy the required accuracy by establishing a load-displacement curve model. The values of the coefficients in the formula are listed in Table 2.
| $ {F_{mT}} = {A_1}T + {B_1} $ | (1) |
| $ {d_{mT}} = {A_2}T + {B_2} $ | (2) |
| $ {k_{eT}} = {A_3}T + {B_3} $ | (3) |
| Table 2 Values in Eqs. (1) -(3) |
where A1, B1, A2, B2, A3 and B3 are constant in the expressions.
In addition, the prediction formula that corresponds to failure deformation when the load decreased to 0.8 is presented as Eq.(4). In the formula, α is a constant and reflects the ductility of the stud-to-sheathing connection when it failed, which was set as 1.01 for the MBTB and LBTB sheathings; hence, the predicted failure mode of the two types of sheathing connections was brittle failure. For the OSB sheathing, α was set to 1.3 by calculating the arithmetic mean value of all values of experimental curves; hence, the predicted failure mode of the OSB sheathing connections was ductile failure.
| $ {d_{uT}} = \alpha \cdot {d_{mT}} $ | (4) |
where duT is the failure deformation (mm).
Considering LBTB-P-15-S1 as an example, Fig. 22 compares the experimental results of the three characteristic parameters (peak load, peak deformation and elastic stiffness) with the results that were obtained using the fitting formula. According to the figure, the peak load was most accurately predicted, compared with the peak deformation and the elastic stiffness.

|
Fig.22 Comparison between experimental results and the results obtained using the prediction formula for the LBTB-P-15-S1 stud-to-sheathing connection |
5.2 Load-Displacement Curve Model
Based on whether stiffness increased in the ascent stage of the curves, the load-displacement curves of three types of stud-to-sheathing connections were divided into two types: In the first type, the curve showed no stiffness increase in its stable ascent stage and it involved the MBTB and OSB stud-to-sheathing connections that were subjected to shear that was parallel to the direction of the loaded sheathing edge and all LBTB stud-to-sheathing connections. In the other type, the curve showed a stiffness increase in the later period of its ascent stage, which included MBTB and OSB stud-to-sheathing connections that were subjected to shear that was perpendicular to the direction of the loaded sheathing edge.
5.2.1 Curves without stiffness increase phenomenaFor the load-displacement curves without stiffness increase phenomena, the ascent stages were stable. The quadratic function fitting formula was adopted for the ascent stages of the curves. The fitted curves passed through points (0, 0) and (dmT, FmT), and the initial stiffness at point (0, 0) was regarded as the elastic stiffness, which was also the slope of the curves at point (0, 0). Hence, the quadratic function fitting formula of the ascent stage was established. The descent stage of the curves was simplified as a straight line, which was expressed by the linear fitting formula as follows:
| $ {F_T} = \left\{ {\begin{array}{*{20}{l}} {\frac{{{F_{mT}} - {k_{eT}} \cdot {d_{mT}}}}{{d_{mT}^2}} \cdot d_T^2 + {k_{eT}} \cdot {d_T}, }&{{d_T} \le {d_{mT}}}\\ {\frac{{{F_{mT}}}}{{5(1 - \alpha )}} \cdot {d_T} + {F_{mT}} \cdot \left( {1 - \frac{{{d_{mT}}}}{{5(1 - \alpha )}}} \right), }&{{d_{mT}} \le {d_T} \le {d_{uT}}} \end{array}} \right. $ | (5) |
where α is a constant, dT is the displacement of specimen in units of mm, and FT is the shear load on the specimen in units of N.
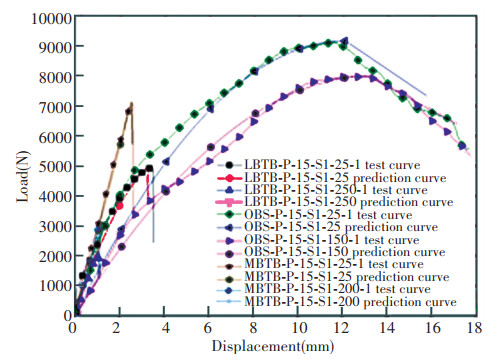
Fig. 23 compares the load-displacement curves that were obtained from experiments on stud-to-sheathing connections with the curves that were obtained from Eqs.(1) - (5). For most specimens, the model that was derived from Eq.(5) can reflect the load-displacement curves that were obtained from the experiment with satisfactory accuracy. However, for a few specimens, the fitted curves deviated substantially from the experimental curves, which was caused by two main factors:
|
Fig.23 Comparison between the experimental results and the fitting results for specimens that do not exhibit stiffness increase phenomena |
(1) The characteristic parameters that were obtained by the prediction formula deviate from the experimental results, especially regarding the strong impact of the predicted results of the peak load and the peak deformation on the fitting results of the load-displacement curve.
(2) The complex structures of all three kinds of sheathings, which are composed of heterogeneous isotropic materials, lead to various patterns of load-displacement curves. Even the load-displacement curves that were obtained by repeated experiments may differ substantially; hence, the curves that were obtained by the fitting formula inevitably deviate from the experimental curves.
5.2.2 Curves with stiffness increaseFor the MBTB and OSB stud-to-sheathing connections that were subjected to shear that was perpendicular to the direction of the loaded sheathing edge, the load-displacement curves showed obvious stiffness increase phenomena at the later period of their ascent stages. To improve the fitting accuracy, the ascent stage was divided into two sections, which were also expressed by quadratic function fitting formulas. Apart from satisfying the condition of passing through points (0, 0) and (dmT, FmT), and taking the initial stiffness at the point (0, 0) as the slope of the curves, the quadratic function curves of the two sections also exhibited the following features, according to observations of the experimental curves of the specimens with stiffness increases. The curves started to show increasing stiffness at the point (R1dmT, R2FmT); thus, this point was the demarcation point of the two sections of the quadratic function. Coefficients R1 and R2 were defined as the reduction factors of the peak deformation and the peak load, respectively, at the stiffness increasing point, and the slope of second quadratic function at this point was R3keT. Coefficient R3 was defined as the stiffness increase factor. According to observations and statistics, the values of R1, R2 and R3 depended on the type of sheathing and the screw edge distance. Based on the type of sheathing and the screw edge distance, values of R1, R2 and R3 are as presented in Table 3. The descent stage of the curves was still expressed by the linear fitting formula, and the complete fitting formula is expressed as follows:
| $ {F_T} = \left\{ {\begin{array}{*{20}{l}} {\frac{{{R_2}{F_{mT}} - {k_{eT}} \cdot {R_1}{d_{mT}}}}{{R_2^2d_{mT}^2}} \cdot d_T^2 + {k_{eT}} \cdot {d_T}, {d_T} \le {R_1}{d_{mT}}}\\ {\left[ {\frac{{\left( {1 - {R_2}} \right) \cdot {F_{mT}}}}{{{{\left( {1 - {R_1}} \right)}^2} \cdot d_{mT}^2}} - \frac{{{R_3} \cdot {k_{eT}}}}{{\left( {1 - {R_1}} \right) \cdot {d_{mT}}}}} \right] \cdot d_T^2 + }\\ {\left[ {\frac{{1 + {R_1}}}{{1 - {R_1}}} \cdot {R_3}{k_{eT}} - \frac{{2{R_1}\left( {1 - {R_2}} \right)}}{{{{\left( {1 - {R_1}} \right)}^2} \cdot {d_{mT}}}}} \right] \cdot {d_T} + }\\ {\left[ {{R_2}{F_{mT}} + \frac{{R_1^2\left( {1 - {R_2}} \right){F_{mT}}}}{{1 - {R_1}}} - \frac{{{R_1}{R_3}{k_{eT}}{d_{mT}}}}{{1 - {R_1}}}} \right], {R_1}{d_{mT}} \le {d_T} \le {d_{mT}}}\\ {\frac{{{F_1}}}{{5(1 - \alpha )}} \cdot {d_T} + {F_{mT}} \cdot \left( {1 - \frac{{{d_{mT}}}}{{5(1 - \alpha )}}} \right), {d_{mT}} \le {d_T} \le {d_{uT}}} \end{array}} \right. $ | (6) |
| Table 3 Values of R1, R2 and R3 in Eq.(6) |
where R1, R2 and R3 denote the reduction factor of the peak deformation, the reduction factor of the peak load and the stiffness increase factor at the stiffness increasing point, respectively.
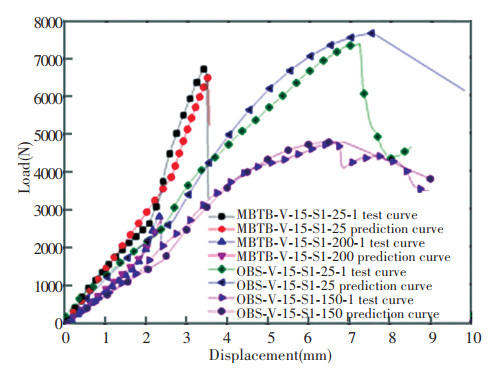
Fig. 24 compares the experimental load-displacement curves with stiffness increase with their corresponding fitting results. The fitted curves differ from the experimental curves because, apart from the two reasons that were discussed in Section 5.2.1 that contributed to the curve (without the stiffness increase phenomena) errors, errors also occurred at the demarcation point (R1dmT, R2FmT) of the two sections of quadratic function curves and the initial slope of R3keT. However, overall, Eq.(6) can basically express the curve pattern and satisfy the accuracy and application requirements.
|
Fig.24 Comparison between the experimental results and the fitting results for specimens that exhibit stiffness increase phenomena |
6 Conclusions
This paper reported a detailed study of 253 double-shear tests of CFS screwed connections with MBTB, LBTB and OSB sheathing at ambient and elevated temperatures. The following conclusions are drawn from this work:
(1) The failure modes and experimental phenomena of the MBTB and LBTB stud-to-sheathing connections were similar. Both the MBTB and LBTB stud-to-sheathing connections displayed brittle failure, while the OSB stud-to-sheathing connections displayed ductile failure, with sheathing extruded and damaged and tilting screws pulled through sheathings. For the MBTB and OSB stud-to-sheathing connections that were subjected to shear that was perpendicular to the direction of the loaded sheathing edge, the stiffness generally increased at the later period of the ascent stage of the curves.
(2) Regarding the shear direction, for all three kinds of stud-to-sheathing connections, the peak loads of the stud-to-sheathing connections that were subjected to shear parallel to the direction of the loaded sheathing edge were generally higher than those of the stud-to-sheathing connections that were subjected to shear perpendicular to the direction of the loaded sheathing edge. However, for the OSB stud-to-sheathing connections, when the edge distance was 20 mm, the shear direction had little impact on the peak load.
(3) Regarding the screw edge distance, the OSB stud-to-sheathing connections that were subjected to shear parallel to the screw edge distance exhibited no clear trends, whereas the peak loads of the other sheathing connections all increased with the edge distance, and a stronger impact of the edge distance was observed when the shear direction was perpendicular to the edge distance.
(4) Regarding the number of screws, the peak loads significantly increased for specimens with double-screw connections compared with single-screw connections but far less than doubled. The maximum peak loads of the double-screw MBTB specimens, double-screw LBTB specimens and double-screw OSB specimens were 1.69 times, 1.48 times and 2.06 times those of single-screw specimens, respectively.
(5) Finally, the simplified load-displacement curve model of stud-to-sheathing connections at elevated temperature was finally generated by first establishing the prediction formula for the characteristic parameters of the peak load, the peak deformation and the elastic stiffness and then by considering whether stiffness increase phenomena were displayed by the curves. This model can fit the experimental curves while satisfying the accuracy and application requirements.
| [1] |
Buonopane S G, Bian G, Tun T H, et al. Computationally efficient fastener-based models of cold-formed steel shear walls with wood sheathing. Journal of Constructional Steel Research, 2015, 110: 137-148. DOI:10.1016/j.jcsr.2015.03.008 (  0) 0) |
| [2] |
Fiorino L, Della Corte G, Landolfo R. Experimental tests on typical screw connections for cold-formed steel housing. Engineering Structures, 2007, 29(8): 1761-1773. DOI:10.1016/j.engstruct.2006.09.006 (  0) 0) |
| [3] |
Peterman K D, Nakata N, Schafer B W. Hysteretic characterization of cold-formed steel stud-to-sheathing connections. Journal of Constructional Steel Research, 2014, 101(10): 254-264. DOI:10.1016/j.jcsr.2014.05.019 (  0) 0) |
| [4] |
Nithyadharan M, Kalyanaraman V. Experimental study of screw connections in CFS-calcium silicate board wall panels. Thin-Walled Structures, 2011, 49(6): 724-731. DOI:10.1016/j.tws.2011.01.004 (  0) 0) |
| [5] |
Yan S, Young B. Tests of single shear bolted connections of thin sheet steels at elevated temperatures—part I: steady state tests. Thin-Walled Structures, 2011, 49(10): 1320-1333. DOI:10.1016/j.tws.2011.05.013 (  0) 0) |
| [6] |
Yan S, Young B. Screwed connections of thin sheet steels at elevated temperatures—part I : steady state tests. Engineering Structures, 2012, 35: 234-243. DOI:10.1016/j.engstruct.2011.10.030 (  0) 0) |
| [7] |
Cai Y C, Young B. High temperature tests of cold-formed stainless steel double shear bolted connections. Journal of Constructional Steel Research, 2015, 104: 49-63. DOI:10.1016/j.jcsr.2014.09.015 (  0) 0) |
| [8] |
Cai Y C, Young B. Behavior of cold-formed stainless steel single shear bolted connections at elevated temperatures. Thin-Walled Structures, 2014, 75: 63-75. DOI:10.1016/j.tws.2013.10.010 (  0) 0) |
| [9] |
Cai Y C, Young B. Bearing factors of cold-formed stainless steel double shear bolted connections at elevated temperatures. Thin-Walled Structures, 2016, 98: 212-229. DOI:10.1016/j.tws.2015.04.021 (  0) 0) |
| [10] |
Lu W, Ma Z C, Makelainen P, et al. Behavior of shear connectors in cold-formed steel sheeting at ambient and elevated temperatures. Thin-Walled Structures, 2012, 61: 229-238. DOI:10.1016/j.tws.2012.04.008 (  0) 0) |
| [11] |
Lu W, Makelainen P, Outinen J, et al. Design of screwed steel sheeting connection at ambient and elevated temperatures. Thin-Walled Structures, 2011, 49(12): 1526-1533. DOI:10.1016/j.tws.2011.07.014 (  0) 0) |
| [12] |
Chen W, Ye J H, Zhao M Y. Steady and transient state response of single shear cold-formed steel-to-steel screwed connections at elevated temperatures. Journal of Constructional Steel Research, 2018, 144: 13-20. DOI:10.1016/j.jcsr.2018.01.016 (  0) 0) |
| [13] |
Fiorino L, Della Corte G, Landolfo R. Experimental tests on typical screw connections for cold-formed steel housing. Engineering Structures, 2007, 29: 1761-1773. DOI:10.1016/j.engstruct.2006.09.006 (  0) 0) |
| [14] |
Peterman K D, Nakata N, Schafer B W. Hysteretic characterization of cold-formed steel stud-to-sheathing connection. Journal of Constructional Steel Research, 2014, 101: 254-264. DOI:10.1016/j.jcsr.2014.05.019 (  0) 0) |
| [15] |
Chen W, Ye J H, Chen T. Design of cold-formed steel screwed connections with gypsum sheathing at ambient and elevated temperatures. Applied Sciences, 2016, 6(9): 248-263. DOI:10.3390/app6090248 (  0) 0) |
| [16] |
AISI. Cold-Formed Steel Design Manual. Washington DC: American Iron and Steel Institute, 2002: 1-12.
(  0) 0) |
| [17] |
ECCS Technical Committee 1. Technical Working Group 1.3. Recommended testing procedure for assessing the behavior of structural steel elements under cyclic loads. Brussels: ECCS, 1985.
(  0) 0) |
 2021, Vol. 28


