With the development of human society, the exploitation and utilization of renewable energy sources have become an irreversible trend. In practical engineering applications of new energy like electric vehicles (EV), photovoltaic (PV), and wind power generation, power storage devices are indispensable because of the buffer element between power generation and power consuming. Until now the most widely employed power storage device is still rechargeable battery, and among various types of batteries, Li-ion battery, especially the LiFePO4 battery, is arousing extensive attention all over the world. Compared with other types of batteries, LiFePO4 battery possesses several advantages like high energy density, long service life, relatively lower cost, and good safety performance[1-5].
Generally speaking, the service life of LiFePO4 battery is relatively longer than other types of batteries, but it must be noticed that the working voltage platform of single LiFePO4 battery cell is only about 2.0-3.7 V, so when it is used in engineering field like EVs, usually massive battery cells are connected in series and parallel mode to meet the requirement of the load. Under this circumstance, the practical available capacity of the series connected battery pack is restrained by the worst cell due to the "barrel effect"[6-7]. When a series-connected battery pack is repeatedly charged and discharged, each cell in the pack may age differently, which means the decrement rate of available capacity for each cell may be different. This is aging diversity phenomenon, which can also happen to independent battery cells when they are cycled under the same condition separately. This phenomenon is rather important in battery pack applications, and must be considered within battery management system (BMS). In this paper, this phenomenon will be further explored.
In order to describe the aging performance of battery, the commonly used basic models are Arrenius model and inverse power law model. Other statistical models can also be seen in literature, but when these models are adopted to quantitatively describe battery capacity fading during aging process, the time variable or charge/discharge cycle number is usually involved[8-10]. On the other hand, considering battery aging diversity, when two same new LiFePO4 battery cells are charged and discharged with the same number of cycles under identical working conditions, the capacity fading of the two cells can be very different sometimes. In such cases, large error could be brought in when battery capacity fading is simply estimated by Arrenius model or inverse power law model. Besides, since battery samples and the aging procedures are totally identical, these aging models are not easy to be modified to adapt to this battery aging diversity. It can also be difficult even for the rigorous electrochemical battery models to describe this aging diversity, because it is hard to detect the practical electrochemical parameters online.
In this paper, the aging diversity of LiFePO4 battery cells was investigated according to a series of accelerated aging tests. Multiple new battery samples of two different brands were used for this aging test, and results of the test were comprehensively compared and analysed. Battery of each brand shows itself the unique aging process, and an obvious aging diversity can also be observed even among cells of the same brand with same specification. This diversity was described quantitatively through statistical method, and the aging characteristics of two brand batteries were summarized. Finally, an aging feature based state of health (SOH) estimation method was proposed.
With the rapid development of renewable energy and EVs, people are paying more attention to the detailed working performance of rechargeable batteries. The differences including aging diversities among battery cells have also been considered by researchers within this field, and related issues have been studied. Generally speaking, quantitative description and detailed analysis of battery aging diversity over integral life cycle are not commonly seen in current literature.
Wang et al.[11] found that differences exist among cells of same specification and same brand. Balanced voltages of the fully charged Li-ion battery cells distributed normally, and with the aging process of batteries, this normal distribution would become more dispersive. Besides, they also discussed the reason of capacity fading difference[11]. The capacity degradation was not studied although variations of cell voltages and the dispersion is discussed in Ref. [12], where 80 LiMn2O4 cells with 8 Ah were tested under several different current rates including 1 C, 2 C, 3 C, and 4 C. In Ref. [13], Yang et al. stored the fully charged LiCoO2 pouch batteries for 50 days, and the voltage drop was used to judge the general quality (such as available capacity and self-discharge rate) of each cell, so that cells with poor quality can be eliminated. This work can be helpful for battery screening and unitizing. Wang et al.[14] discovered that the consistency of series connecting LiFePO4 battery cells would deteriorate during the battery aging process, and it is recommended that the battery pack should be disassembled when necessary, and then repacked with appropriate arrangement. However, in this research, battery pack consistency was mainly judged by battery terminal voltages. Baumhöfer et al.[15] pointed out that differences during manufacturing process would influence battery aging rate, and a data digging method was adopted to extract the relationship between cell initial performance and its aging period, so that the new battery cells can be grouped according to the estimated aging period, thus a good consistency within the battery pack can be obtained. Miyatake et al.[16] investigated the relationship between battery pack capacity and connection topology of battery cells. A mathematical model was established to estimate the available capacity of battery packs with different connection topology, but battery aging is not considered. Gogoana et al.[17] considered battery internal resistance as the vital factor which can strongly affect battery cycle life. When charge/discharge current was high, a temperature rise would be easily caused due to higher internal resistance, and thus battery capacity decreased. Finally, battery capacity fading and battery internal resistance are connected based on an interaction model of solid electrolyte inside the battery. But the method in Ref.[17] is only applicable for parallel connected batteries. Besides, cycle number was used to describe battery aging state, so battery aging diversity was ignored.
According to related research, possible reasons for aging diversity of the LiFePO4 battery can be summarized as several aspects below. First, due to the limit of manufacturing technique, there are differences among microscopic structures of each cell, such as the uneven distribution of material, activation degree of electrode and electrolyte, thickness of electrode, and so on. These factors will have influences on the withstand voltage performance and acceptable charge/discharge rate of the battery, thus aging diversity may appear. Second, primitive inconsistency of battery cells will be gradually amplified during practical use. Slight difference of internal resistance exist even for new batteries, and as charge/discharge cycle continues, more heat will be generated inside the cell which has a larger internal resistance, and thus the capacity fading rate of this cell will be higher than other cells. Third, over charge and over discharge would probably happen to the cells within series connected battery pack without balance control, and excessive intensity of working stress will definitely cause a faster aging rate; besides, self-discharge will happen to batteries during long term storage. Sometimes inner short-circuit happens, and corresponding capacity fading may be irreversible.
This paper is divided into 6 sections. Section 0 is a general introduction, in which literature review on battery aging diversity and a brief discussion about the possible reasons for battery aging diversity phenomenon are included. The commenly used SOH estimation methods are given in Section 1. The details of accelerated aging test and aging diversity analysis of LiFePO4 battery cells are given in Section 2. The SOH estimation method based on PDF is elaborated in Section 3, and the proposed SOH estimation method is validated by experiment in Section 4, and Section 5 gives conclusions of this study.
1 Commenly used SOH Estimation MethodsSince aging difference is vital for battery pack applications, the aging state and SOH of each cell must be estimated, so that the relatively worse cells can be located and replaced when it is necessary. There are various SOH estimation methods for LiFePO4 battery now, and they are relatively mature. Generally speaking, commonly used SOH estimation methods can be classified as several categories as follows: aging feature based methods, model based methods, data driven methods, and statistical methods[18-21]. But for many of these methods, whether they are adaptable to the aging diversity among cells and whether they are applicable for LiFePO4 batteries with different specifications still need to be verified, which are the very points this research emphasizes on. Besides, some common problems for SOH estimation are still not completely solved. First, universal and easily implemented method to describe the feature of battery aging process is rather rare. Second, for many of the common methods, real-time performance is relatively weak, and for some methods, high complexity hinders their on-board implementation. Third, adaptability of SOH estimation method to different working stress intensities like C-rate and temperature still needs to be enhanced[22-24]. In recent years, battery aging diagnosis and SOH estimation based on incremental capacity analysis (ICA) and probability density function (PDF) have been intensively studied due to their low complexity and good accuracy. In Ref. [21], Feng et al. proved the equivalence of PDF and ICA through mathematical analysis. Specifically for ICA method, the value of incremental capacity dQ/dV is necessary to get IC curve of the battery. However, due to the voltage measurement accuracy and narrow voltage plateau, it is difficult to directly calculate differential voltage dV from the sampled data, and usually a data filtering process or similar measure is needed before dQ/dV is calculated. Since there is no such problem for PDF method, PDF curve of battery terminal voltage can be easily obtained from the primitive sampled data, thus in this paper, a simplified PDF method was designed to extract the aging feature during battery degradation process, and this feature was used to locate battery SOH. It should be mentioned that though a similar PDF concept is also employed in Ref. [21], its aging feature extraction rule is obviously not feasible for the batteries in our research. In Ref. [21], battery aging feature is extracted from a fixed voltage range, and this range is determined based on manual observation. While for different types of batteries, this range can be different. In this paper, a more universal aging feature extraction method was developed, and a dynamic sliding window strategy was designed to acquire the optimal SOH estimation accuracy. Finally, the feasibility and accuracy of this SOH estimation method was verified by experimental test on multiple battery cells of different brands.
2 Accelerated Aging Test and Aging Diversity AnalysisIn order to quantitatively explore the aging diversity of LiFePO4 battery, an accelerated aging test was conducted on multiple LiFePO4 battery cells of two different brands[25-28]. To investigate the integral aging process of all battery samples, working stresses need to be intensified so that the aging process can be accelerated. In this paper, four stresses are intensified: upper limit voltage, lower limit voltage, charge current, and discharge current, while the room temperature was kept stable around 25℃. For LiFePO4 battery, the standard stresses and accelerated stresses are given in Table 1.
| Table 1 Working stresses used for accelerated aging test |
LiFePO4 battery samples of two different famous brands were used for this aging test, and specifications of the cells are given in Table 2.
| Table 2 Battery sample information for accelerated aging test |
Flowchart of accelerated aging test is given in Fig. 1. During the general aging process, standard capacity calibration test was carried out for every 20 aging cycles. Fig. 1(a) is the general procedure of aging test and Fig. 1(b) gives the steps of standard capacity calibration. During the aging cycles, battery cell was firstly discharged with 4 C rate to the lower limit 1.8 V. After 5-min rest, the cell was recharged with constant current constant voltage (CCCV) mode (4 C/3.75 V) until the charge current dropped below 0.05 C rate, and then a 5-min rest period ended this cycle. This charge and discharge cycle were then continuously repeated, and a standard capacity test was carried out for every 20 cycles to determine the available capacity of the battery. Finally, the aging test was terminated when battery SOH decreased to lower limit. Usually SOH≤70% was regarded as the end of battery life. In this paper, SOH lower limit was set as 50% to examine the extreme situations.

|
Fig.1 Flow chart of accelerated aging test |
To analyse the aging diversity, all of the 16 battery cells were aged separately with the same procedure in Fig. 1, and room temperature was kept stable during the whole process. Then accelerated aging test was conducted. It took over 12 months to complete the whole test. Finally, available capacity fading performance of all cells during integral life cycle were obtained, and results are illustrated as follows.
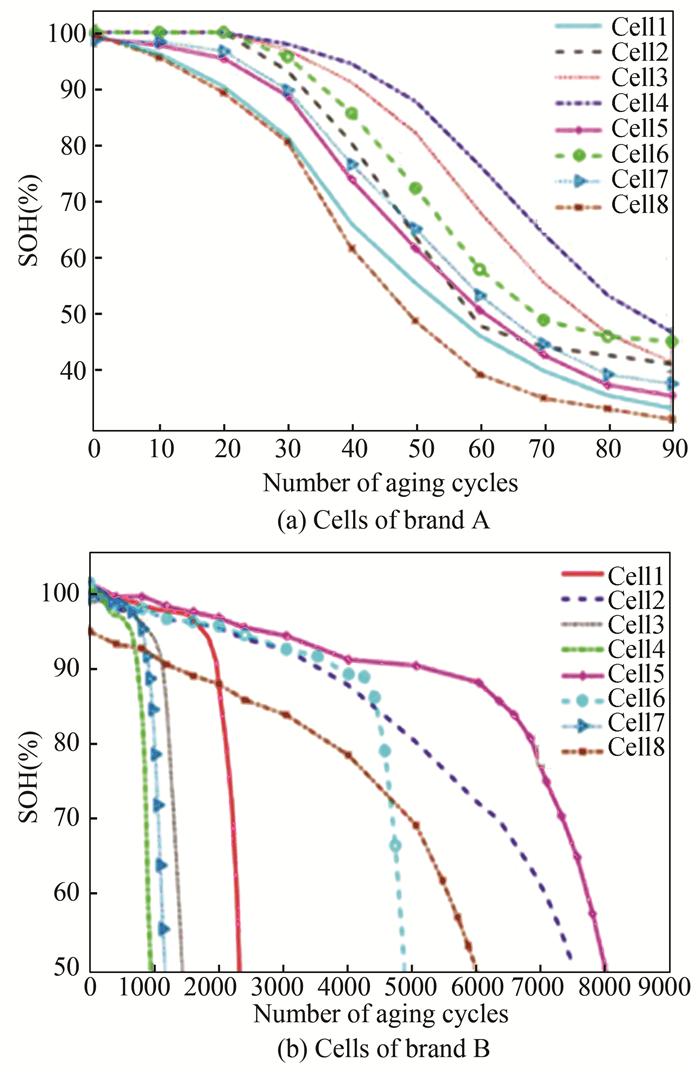
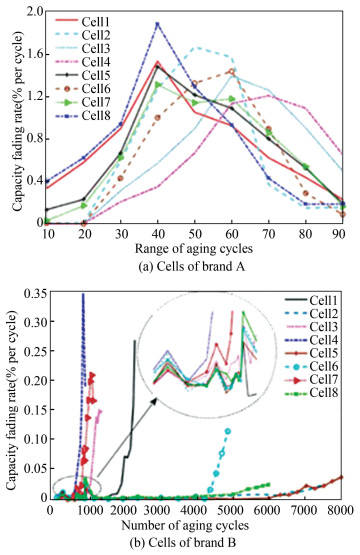
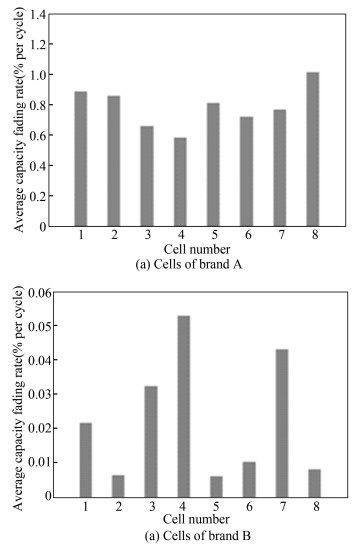
Capacity fading curves along with the cycle number of all battery samples are given in Fig. 2. Capacity fading rate and average capacity fading rate of all cells are given in Fig. 3 and Fig. 4, respectively. From these figures, significant aging diversity can be directly and clearly observed. On the one hand, cells of both brands show an obvious aging difference; on the other hand, each brand manifests itself the unique aging performance. Under same accelerated aging test, cells of brand B possessed a much longer cycle life than cells of brand A, as can be seen in Fig. 2. The worst cell of brand B could be cycled for about 1000 times, while the best cell of brand A can only be cycled for no more than 90 times, and this difference is huge.
|
Fig.2 Capacity fading process of battery cells under accelerated aging test |
|
Fig.3 Capacity fading rate of battery cells under accelerated aging test |
|
Fig.4 Average capacity fading rate of batteries under accelerated aging test |
Specifically, for cells of brand A, the trend of their capacity fading curves are similar, as can be seen in Fig. 3(a). The capacity fading rate of all cells firstly increased and then decreased. There was a peak of capacity fading rate for each cell, and the peak value and the corresponding cycle number where this peak appeared were different. Generally speaking, for the cell which aged faster (e.g., cell 8), its capacity fading rate would peak at a relatively fewer cycle number, and the peak value is larger; while for the cell which aged slowly (e.g., cell 4), the peak of its capacity fading rate tended to emerge at later cycles, and the peak value was smaller. This capacity fading rate Rcf is approximately calculated at different life points as expressed by Eq. (1), where Capa and Capb are standard available capacity of the battery at life points a and b, respectively, CNx refers to the cycle number the battery has experienced at life point x, and Cn is nominal capacity of the battery cell.
| $ R_{\mathrm{cf}}=\frac{\mathrm{Cap}_{\mathrm{b}}-\mathrm{Cap}_{\mathrm{a}}}{C_{n}\left(\mathrm{CN}_{\mathrm{b}}-\mathrm{CN}_{\mathrm{a}}\right)} \times 100 \% $ | (1) |
Situations are totally different for cells of brand B. To reach SOH≤50%, the best cell could be cycled for nearly 8000 times, while the worst cell could only be cycled for no more than 1000 times. Based on this, aging difference among cells of brand B is much greater than cells of brand A, which is clearly illustrated by the average capacity fading rate comparison of all cells from both brands (Fig. 4). Besides, unlike brand A, the capacity fading rate of most cells from brand B kept increasing as the cycle number increased (Fig. 3(b)), which means most cells of brand B aged increasingly faster as the cycle continued. Exceptions are cell 4 and 7. There was an obvious decrement for the capacity fading rate at late stage of their cycle life. Specifically, at early stage of the battery cycle life, it can be noticed that the capacity fading rate of all brand B cells tended to fluctuate for a period of time, and we will study further on these details in our future work.
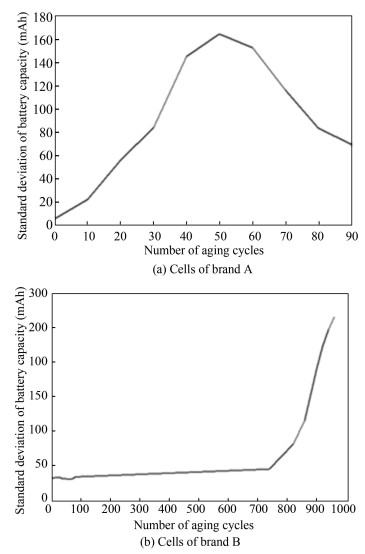
In order to observe the capacity dispersion more clearly, standard deviation of battery available capacity is calculated along cycle number. Capacity standard deviation of 8 cells from brand A is illustrated in Fig. 5(a), and the similar curve of cells from brand B is given in Fig. 5(b). Specifically for brand B, it should be mentioned that since the cycle life of cell 4 expired (SOH dropped below 50%) by 960 cycles (Fig. 2(b)), the capacity standard deviation was only calculated for the previous 960 cycles. As shown in Fig. 5(a), there was an obvious peak value around 50 cycles, which means for cells of brand A, the dispersion degree of battery capacity firstly increased and then decreased. The maximum dispersion showed up at 50 cycles. Again, situation is different for cells of brand B. Fig. 5(b) shows that the curve almost increases monotonically, so with battery degradation, the capacity dispersion expanded continuously until cell 4 expired. Based on above analysis, it can be concluded that battery aging diversity in terms of capacity fading may manifest itself in different ways and levels, even for the same type (LiFePO4/C) of batteries.
|
Fig.5 Standard deviation of battery capacity during aging |
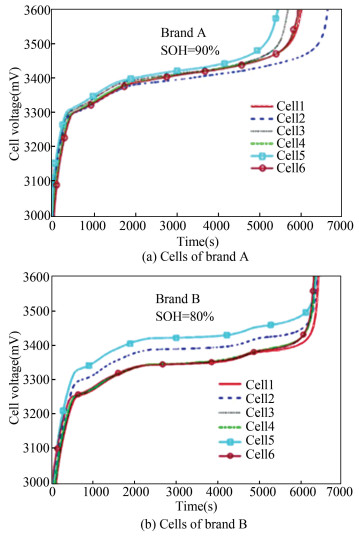
Besides, it is worth noting when batteries of same type with same SOH were charged under standard CCCV (0.5 C/3.65 V) mode, their voltage curves can be rather different, as can be seen in Fig. 6. This difference among battery cells should also be considered in BMS.
|
Fig.6 Voltage curves under standard CCCV charging mode |
3 SOH Estimation Based on PDF
Since aging diversity of LiFePO4 battery is commonly seen in applications, it becomes a key problem to estimate the available capacity of each battery cell during working process without considering the number of their life cycles. In other words, an accurate, simple, and easily implemented SOH estimation method is needed. As previously mentioned in Section 0, concept of probability density function was adopted, and a simplified PDF SOH estimation method was designed. According to statistics theory, for random variable x, its value range can be divided into limited segments, and the length of each segment is defined as segment width:
| $ \Delta x_{j}=\left(x_{b}-x_{a}\right)_{j} $ | (2) |
Occurrence number of data values within a certain segment is defined as frequency number ΔFi, and the ratio of ΔFi to total data number of the whole data set is called relative frequency number:
| $ \Delta f_{j}=\Delta F_{j} / S_{F}=\Delta F_{j} / \sum \Delta F_{j} $ | (3) |
To enhance the generalization performance of Δfj, the probability density of each data segment is described as
| $ p_{j}=\Delta f_{j} / \Delta x_{j}=\frac{\Delta F_{j}}{\Delta x_{j} \sum \Delta F_{j}} $ | (4) |
In this research, battery terminal voltage was selected as random variable, and considering the measurement accuracy of equipment, the segment width Δxj was set as 1 mV, so this voltage segment can also be regarded as a voltage point. In our SOH estimation strategy, the frequency number ΔFi of each voltage point during constant current charging process was regarded as a simplified PDF curve, and the sum of ΔFi during a certain voltage range was abstracted as the aging feature parameter of batteries with the same brand and same specification. This aging feature parameter Pf was then adopted to determine battery SOH.
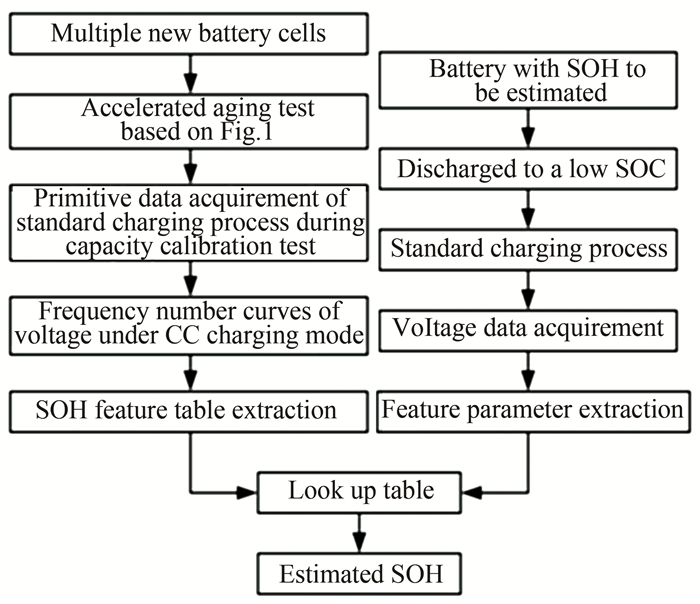
In battery applications such as EV, the discharge process depends on road conditions, and random load output is usually required. Since the charging process is mainly completed with certain charging equipment and is much more controllable, battery voltage performance during standard charging process was chosen as the source for SOH estimation. Flowchart of simplified PDF based SOH estimation method is shown in Fig. 7. It can be seen that two main steps are involved in this process: SOH feature table extraction and SOH estimation for random battery cell.
|
Fig.7 Flow chart of simplified PDF based SOH estimation method |
3.1 SOH Feature Table Extraction
As can be seen in Fig. 7, firstly, the new battery samples were aged, and the primitive data acquired in Section 2 can be directly employed. Then based on data of standard charging process during capacity calibration test, voltage frequency number of all cells at each life point were obtained, and finally the SOH feature tables for batteries of each brand could be established.
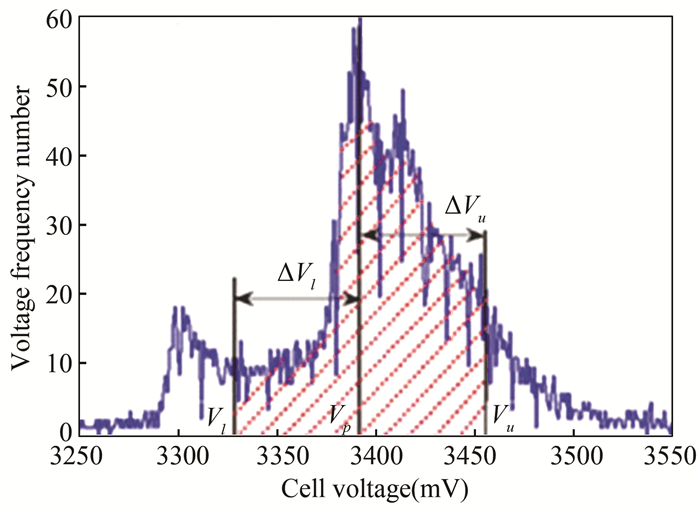
According to the statistics theory mentioned above in this section, the voltage sample values during the capacity calibration charging process was regarded as a whole data set (only constant current charging period was considered). Battery cell voltages were recorded with sample period of 1 s and detection accuracy of 1 mV. The segment width was set as 1 mV, and then the frequency number ΔFi of each voltage point can be obtained. Take cell 7 of brand A as an example. The voltage frequency numbers of new battery (aging cycle number is 0) during standard charging process is given in Fig. 8. Calibrated capacity of this cell is 1344 mAh, thus its initial SOH is 1344/1350≈100%.
|
Fig.8 Voltage frequency number curve during standard charging process of cell 7 brand A (SOH≈100%) |
According to Fig. 8, the voltage Vp was first located with peak frequency number, and then the shadowed area within the range of [Vl, Vu] = [Vp-ΔVl, Vp+ΔVu] was calculated as the aging feature parameter Pf. This area can be calculated as the sum of frequency number for each voltage point:
| $ P_{f}=\sum\limits_{j=V_{p}-\Delta V_{l}}^{V_{p}+\Delta V_{u}} \Delta F_{j} $ | (5) |
The voltage range of accumulation to get Pf is a vital factor. There are two considerations for the voltage range selection in this paper. First, as can be seen in Fig. 9, for batteries of both brands, the two notable peaks of the PDF curve are all related to capacity fading, especially the shape of higher peak (corresponds to Vp) shows a very strong correlation with battery SOH. A relatively smaller Vp with a larger voltage frequency number indicates that the battery possessed more available capacity, while a larger Vp with relatively smaller voltage frequency number corresponded to a lower SOH. With such considerations, the voltage range around Vp can be regarded as feature interval. Second, in practical applications like EVs, usually batteries are not charged with its state of charge (SOC) dropping to 0%, and it would be probably charged with SOC > 10% or even larger; on the other hand, feature interval must be totally included in the constant current charging process for SOH estimation. To keep this SOH estimation method more feasible for practical working situations, an effective measure is to let the feature interval start from a higher SOC. In case that the charging process starts from a very high SOC (like 30% or larger), SOH will not be estimated. Feature voltage interval is then determined according to the two principles above as well as detailed aging performance of certain type of batteries, and a dynamic sliding window optimization process is also involved to locate optimal feature interval, which would be elaborated later in Section 3.2. Finally, feature interval of brand A battery was set as [Vp-70 mV, Vp+65 mV], and feature interval of brand B battery was set as [Vp-30 mV, Vp+90 mV].

|
Fig.9 PDF curves of randomly selected cell under different SOH |
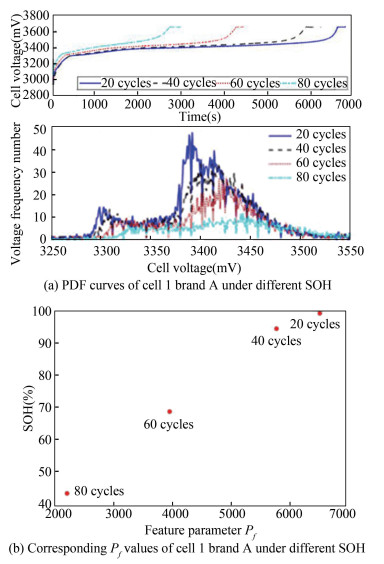
In order to establish the relationship between Pf and SOH, the feature parameter Pf should be calculated for the battery cell with different SOH states. Take cell 1 of brand A as an example, different Pf values can be calculated according to voltage frequency number curves of battery with different SOH, as shown in Fig. 10.
|
Fig.10 PDF curves and corresponding Pf values of cell 1 brand A under different SOH |
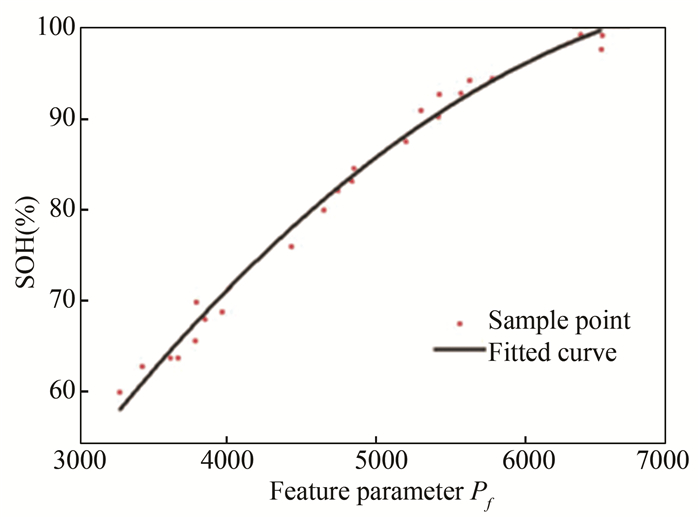
To achieve better statistical property, Pf values of all 8 cells of brand A under different SOH were calculated, and a quadratic polynomial relation was established through curve fitting tool, as can be seen on Fig. 11. Similarly, this Pf-SOH relationship can also be extracted for battery of brand B, as shown on Fig. 12.
|
Fig.11 Pf-SOH relationship of brand A 18650/3.2 V/1350 mAh battery |

|
Fig.12 Pf-SOH relationship of brand B 26650/3.2 V/2500 mAh battery |
The fitted quadratic functions to describe the two Pf-SOH relationships for cells of brand A and brand B are expressed as Eq. (6) and Eq. (7), respectively.
| $ \mathrm{SOH}_{\mathrm{A}}=-0.000002 P_{f}^{2}+0.03 P_{f}-3.45 $ | (6) |
| $ \mathrm{SOH}_{\mathrm{B}}=-0.0000004 P_{f}^{2}+0.0197 P_{f}+7.1 $ | (7) |
As can be seen from Fig. 11 and Fig. 12, for batteries of brand A and brand B, despite the aging diversity manifested during accelerated aging test, Pf-SOH curves can both be extracted with good accuracy. Sample points are distributed closely along the fitted curve. Then, this Pf-SOH curve can be used to estimate SOH state of any cell with the same brand and same specification.
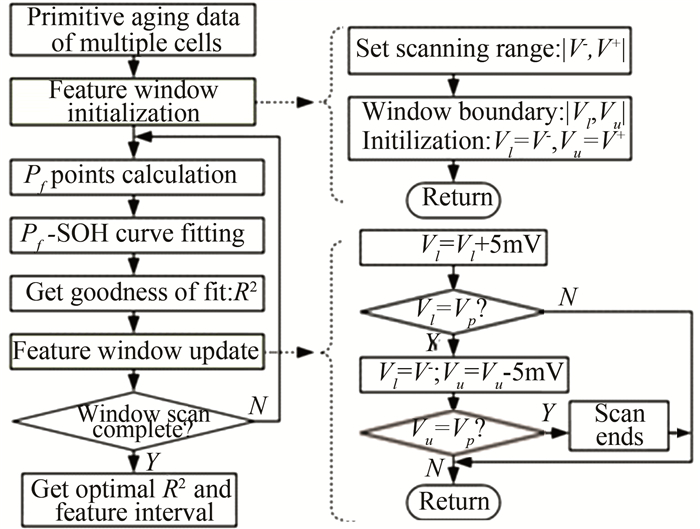
3.2 Dynamic Sliding Window Optimization of Pf-SOH RelationshipAs described previously, determination of feature voltage interval is a key factor for SOH estimation. In this paper, a dynamic sliding window optimization (DSWO) technique was designed to locate the optimal feature interval. Consequently, optimal SOH estimation accuracy can be acquired. Flowchart of this DSWO is given in Fig. 13.
|
Fig.13 Flowchart of DSWO technique |
Considering the voltage plateau of LiFePO4/C battery and the two principles given in Section 3.1, voltage scanning ranges were set as [V-, V+]brand A = [Vp-80 mV, Vp+150 mV] and [V-, V+]brand B = [Vp-30 mV, Vp+120 mV]. As can be seen from Fig. 13, left border of sliding window Vl was within [V-, Vp-5 mV], and its right border Vu was within [Vp+5 mV, V+], left and right borders were changed gradually and respectively with a step of 5 mV, and all the possible windows were scanned. It should be noticed here that the 5 mV scanning step was actually a compromise between computational complexity and SOH estimation accuracy. In each possible window, feature parameter Pf points of 8 cells under different SOH were calculated, and curve fitting was implemented based on the Pf points to get the Pf-SOH relation. Finally, the window with best R2 (goodness of fit) is the expected feature voltage interval. The fitting goodness values of all windows are illustrated in Fig. 14. For cells of brand A, R2 peaked at 0.9832 with the window [Vp-70 mV, Vp+65 mV], and for cells of brand B, R2 peaked at 0.9897 with window [Vp-30 mV, Vp+90 mV]. By adopting this technique, an optimal SOH estimation accuracy can be obtained. Besides, this method is more flexible and universally applicable compared with fixed feature intervals used in other literature. The scanning range and step size are both adjustable. So it can even be possible to use this aging feature extraction method for other types of batteries. In case that the window size is not constant, it was named dynamic sliding window optimization.

|
Fig.14 Fitting goodness corresponding to all possible windows with DSWO technique |
3.3 SOH Estimation for Random Cells
According to Fig. 7, in case the SOH feature table is obtained, the available capacity of any individual cell with same specification can then be estimated, and several steps are involved as listed below:
1) Firstly, the cells need to be charged from a relatively lower SOC state with standard charging mode. Here two points should be noticed: a) Considering the engineering practice, usually the battery would be charged after use, and feature interval must be included in the charge process. If charge process starts from a relatively high SOC state, SOH will not be estimated; b) Charging mode must be the same as the SOH feature table extraction process. In this paper, standard charging was used, and of course, the battery SOH feature table can also be extracted in accordance with the charging rate in practical applications.
2) Battery voltage data of the charging process under constant current mode (or CC part of CCCV charging process) was collected. Since the charging mode is the same as SOH feature table extraction, current data can be neglected. Then the feature parameter Pf can be calculated for the cells to be diagnosed. It should also be noticed here that the sample period of battery external characteristic is constant. In our research, this sample period was set as 1 s.
3) By adopting the value of Pf calculated in the 2nd step and the Pf-SOH relationship obtained previously in Section 3.1, battery SOH can then be estimated through look-up table method.
4 Validation of Proposed SOH Estimation Method 4.1 Results of Experimental TestsA series of experimental tests were carried out to check the effectiveness of this SOH estimation method. Apart from the sample cells which were used for aging test and Pf-SOH curve extraction in this paper, 8 other random cells with different aging states were chosen respectively for each brand, and our proposed method was applied to estimate the SOH of these cells. Results are given in Table 3 and Table 4.
| Table 3 SOH estimation results for random cells of brand A |
| Table 4 SOH estimation results for random cells of brand B |
Judging from the above results, it can be seen that the SOH of all chosen cells can be estimated with good accuracy, and basically the SOH estimation errors are within 5%. Besides, it can be also seen that this method functioned well in the whole range of battery working life (70%≤SOH≤100%). Even for the cells with their theoretical life terminated (SOH < 70%), this method can still be effective. Through these experimental tests, feasibility and accuracy of proposed SOH estimation method was validated.
4.2 Comparison with DEKF Based SOH/Capacity EstimationApart from the PDF based SOH estimation method, model-based SOH/capacity estimation with dual extended Kalman filter (DEKF) is also very popular[29-30]. Comparison of these work with the method proposed in this paper shows several differences between the two methods. First, a convergence process would be involved when SOH or capacity is estimated by DEKF with initial errors. Since the SOH estimated by PDF method is a single value, its error mainly counts on the accuracy of extracted aging feature (Pf-SOH relation).Second, for DEKF based SOH estimation, SOH is usually estimated together with SOC or other states. The multiple states are closely coupled and strongly influenced by one another. With adoption of PDF method, basically SOH estimation is not affected by real-time SOC state. All that needed is battery external characteristic of constant current (CC) charging process, and this PDF method will become invalid when initial SOC of CC charging process is rather high. Third, SOH estimation periods for the two methods are quite different. Usually both SOH and SOC are updated every 1-2 s by regular DEKF, and in some multi-scale DEKF frameworks, SOH is estimated with a much longer period than SOC recursion. It can be up to several minutes. But for PDF based method, battery SOH is estimated every charge-discharge cycle. Fourth, the computational complexity of DEKF is relatively higher than PDF based method. On the other hand, battery aging feature extraction of PDF method is time consuming. Besides, a larger memory space is needed for PDF method in real systems to calculate the battery feature value Pf online.
5 ConclusionsFor LiFePO4 batteries, aging diversity with different degrees could be observed during practical applications, and this phenomenon cannot be neglected especially during long term use of batteries. In this paper, multiple LiFePO4 cells of two different famous brands were investigated, and accelerated aging test was conducted on all 16 cells. Batteries of both brands show huge aging diversities. Both difference of battery aging processes between two brands and aging difference among cells of the same brand are clearly shown. These aging diversities are quantitatively analyzed and summarized. It is revealed that for the LiFePO4 batteries of a certain brand with same specification, there can be some common aging features beneath the significant aging diversity. But for the cells of different brand or different specification, their aging performance could be rather different.
Considering these aging diversities, an effective SOH estimation method based on aging feature parameter was designed and realized. Experimental results show that this method possesses good adaptability to the aging diversities, and SOH of multiple different battery cells can be estimated with good accuracy for both two brands. Besides, the feature parameter which is used to locate the battery aging state can be extracted from constant current charge process, so as long as the constant current charge mode (including commonly used CCCV charge mode) is determined, this method can then be easily implemented in real applications. Our subsequent research will be focused on improving this PDF based SOH estimation method by enhancing its adaptability to environment temperature and promoting the charging rate with consideration of engineering practice.
| [1] |
Cheng X M, Yao L G, Pecht M. Lithium-ion battery state-of-charge estimation based on deconstructed equivalent circuit at different open-circuit voltage relaxation times. Journal of Zhejiang University-Science A (Applied Physics & Engineering), 2017, 18(4): 256-267. DOI:10.1631/jzus.A1600251 (  0) 0) |
| [2] |
Zhang J L, Tong W, Qi H H, et al. Application of square root sigma point Kalman filter to SOC estimation of LiFePO4 battery pack. Proceedings of the Chinese Society of Electrical Engineering, 2016, 36(22): 6246-6253. DOI:10.13334/j.0258-8013.pcsee.160226 (  0) 0) |
| [3] |
Zhang J L, Tong W, Li D K, et al. Rate capacity modeling and state of charge estimation of LiFePO4 battery. Transactions of China Electrotechnical Society, 2017, 32(7): 215-222. DOI:10.19595/j.cnki.1000-6753.tces.2017.07.025 (  0) 0) |
| [4] |
Chen X K, Sun D. Research on lithium-ion battery modeling and model parameter identification methods. Proceedings of the Chinese Society of Electrical Engineering, 2016, 36(2): 6254-6261. DOI:10.13334/j.0258-8013.pcsee.152441 (  0) 0) |
| [5] |
Zheng Y J, Ouyang M G, Han X B, et al. Investigating the error sources of the online state of charge estimation methods for lithium-ion batteries in electric vehicles. Journal of Power Sources, 2018, 377: 161-188. DOI:10.1016/j.jpowsour.2017.11.094 (  0) 0) |
| [6] |
Zheng Y J, Ouyang M G, Li X J, et al. Recording frequency optimization for massive battery data storage in battery management systems. Applied Energy, 2016, 183: 380-389. DOI:10.1016/j.apenergy.2016.08.140 (  0) 0) |
| [7] |
Hoque M M, Hannan M A, Mohamed A, et al. Battery charge equalization controller in electric vehicle applications: a review. Renewable and Sustainable Energy Reviews, 2017, 7: 1363-1385. DOI:10.1016/j.rser.2016.11.126 (  0) 0) |
| [8] |
Wang J, Liu P, Hicks-Garner G, et al. Cycle-life model for graphite-LiFePO4 cells. Journal of Power Sources, 2011, 196: 3942-3948. DOI:10.1016/j.jpowsour.2010.11.134 (  0) 0) |
| [9] |
Han X B, Ouyang M G, Lu L G, et al. A comparative study of commercial lithium ion battery cycle life in electric vehicle: capacity loss estimation. Journal of Power Sources, 2014, 268: 658-669. DOI:10.1016/j.jpowsour.2014.06.111 (  0) 0) |
| [10] |
Yu J B. State-of-health monitoring and prediction of lithium-ion battery using probabilistic indication and state-space model. IEEE Transactions on Instrumentation and Measurement, 2015, 64(11): 2937-2949. DOI:10.1109/TIM.2015.2444237 (  0) 0) |
| [11] |
Wang Z P, Sun F C, Zhang C Y. Study on inconsistency of electric vehicle battery pack. Chinese Journal of Power Sources, 2003, 27(5): 438-441. (in Chinese) (  0) 0) |
| [12] |
Chu C, Qi B J, Du X W. Difference analysis of EV used Li-ion battery pack. Science and Technology Innovation Herald, 2009, 25: 112-113. DOI:10.16660/j.cnki.1674-098x.2009.25.102 (  0) 0) |
| [13] |
Yang G C, Cui Y X, Zhou J Y. Research on the selecting methods for Li-ion cells. Chinese Battery Industry, 2009, 14(3): 152-154. (in Chinese) (  0) 0) |
| [14] |
Wang B, Li Y, Zhang N. Study on consistency of lithium-ion phosphate power battery pack after circulation. Chinese Journal of Power Sources, 2016, 40(3): 519-520. (in Chinese) (  0) 0) |
| [15] |
Baumhöfer T, Brühl M, Rothgang S, et al. Production caused variation in capacity aging trend and correlation to initial cell performance. Journal of Power Sources, 2014, 247: 332-338. DOI:10.1016/j.jpowsour.2013.08.108 (  0) 0) |
| [16] |
Miyatake S, Susuki Y, Hikihara T, et al. Discharge characteristics of multicell lithium-ion battery with nonuniform cells. Journal of Power Sources, 2013, 241: 736-743. DOI:10.1016/j.jpowsour.2013.05.179 (  0) 0) |
| [17] |
Gogoana R, Pinson M B, Bazant M Z, et al. Internal resistance matching for parallel-connected lithium-ion cells and impacts on battery pack cycle life. Journal of Power Sources, 2014, 252: 8-13. DOI:10.1016/j.jpowsour.2013.11.101 (  0) 0) |
| [18] |
Li J, Adewuyi K, Lotfi N, et al. A single particle model with chemical/mechanical degradation physics for lithium ion battery State of Health (SOH) estimation. Applied Energy, 2018, 212: 1178-1190. DOI:10.1016/j.apenergy.2018.01.011 (  0) 0) |
| [19] |
Li Y, Abdel-Monem M, Gopalakrishnan R, et al. A quick on-line state of health estimation method for Li-ion battery with incremental capacity curves processed by Gaussian filter. Journal of Power Sources, 2018, 373: 40-53. DOI:10.1016/j.jpowsour.2017.10.092 (  0) 0) |
| [20] |
Waag W, Fleischer C, Sauer D U. Critical review of the methods for monitoring of lithium-ion batteries in electric and hybrid vehicles. Journal of Power Sources, 2014, 258: 321-339. DOI:10.1016/j.jpowsour.2014.02.064 (  0) 0) |
| [21] |
Feng X N, Li J Q, Ouyang M G, et al. Using probability density function to evaluate the state of health of lithium-ion batteries. Journal of Power Sources, 2013, 232: 209-218. DOI:10.1016/j.jpowsour.2013.01.018 (  0) 0) |
| [22] |
Xu X M, Wang L, Shi H L. Research on battery aging mechanisms based on electrochemical impedance spectroscopy. Chinese Journal of Power Sources, 2015, 39(12): 2579-2583. (in Chinese) (  0) 0) |
| [23] |
Kim J, Lee S, Cho B H. Complementary cooperation algorithm based on DEKF combined with pattern recognition for SOC/capacity estimation and SOH prediction. IEEE Transactions on Power Electronics, 2012, 27(1): 436-451. DOI:10.1109/TPEL.2011.2158554 (  0) 0) |
| [24] |
Chen L, Lü Z Q, Lin W L, et al. A new state-of-health estimation method for lithium-ion batteries through the intrinsic relationship between ohmic internal resistance and capacity. Measurement, 2018, 116. DOI:10.1016/j.measurement.2017.11.016 (  0) 0) |
| [25] |
Lin Y C, Chung K J, Hsiao C C. A novel double dynamic stress accelerated degradation test to evaluate power fade of batteries for electric vehicles. Intelligent Technologies and Engineering Systems, Lecture Notes in Electrical Engineering, 2013, 234: 161-168. DOI:10.1007/978-1-4614-6747-2_20 (  0) 0) |
| [26] |
Pop V, Bergveld H J, Danilov D, et al. Battery management systems: accurate state-of-charge indication for battery-powered applications. Philips Research Book Series Volume 9. Berlin: Springer-Verlag, 2008: 181-220.
(  0) 0) |
| [27] |
Mathieu R, Baghdadi I, Briat O, et al. D-optimal design of experiments applied to lithium battery for ageing model calibration. Energy, 2017, 141: 2108-2119. DOI:10.1016/j.energy.2017.11.130 (  0) 0) |
| [28] |
Tao L F, Cheng Y J, Lu C, et al. Lithium-ion battery capacity fading dynamics modelling for formulation optimization: a stochastic approach to accelerate the design process. Applied Energy, 2017, 202: 138-152. DOI:10.1016/j.apenergy.2017.04.027 (  0) 0) |
| [29] |
Hu C, Youn B D, Chung J. A multiscale framework with extended Kalman filter for lithium-ion battery SOC and capacity estimation. Applied Energy, 2012, 92: 694-704. DOI:10.1016/j.apenergy.2011.08.002 (  0) 0) |
| [30] |
Plett G L. Extended Kalman filtering for battery management systems of LiPB-based HEV battery packs-Part 3. State and parameter estimation. Journal of Power Sources, 2004, 134(2): 277-292. DOI:10.1016/j.jpowsour.2004.02.033 (  0) 0) |
 2022, Vol. 29


