Proportional flow valves including proportional throttle valve and direction valve rely upon spool displacement to regulate the output flow, which are widely used in hydraulic system[1-2]. Due to mechanical tolerance, friction force, and flow force, a region of dead-zone exists in this kind of valve[3]. It usually ranges from 5% to 25% or even higher[4]. The dead-zone usually makes a challenge for the controller design and degrades the performance of the hydraulic system[5].
In order to deal with the dead-zone in the proportional flow valve, some linear control strategies have been investigated, such as gain scheduling[6] and PID controller[7-9]. The gain scheduling scheme regulates the gain in the controller when the valve spool is in the dead-zone region. In this way, it ensures that the spool passes through the dead-zone region quickly. The PID strategy is widely used in the controller design due to its simplicity and effectiveness. In Ref. [10], PID strategy is further extended to fuzzy-PID to deal with the unknown dead-zone.
Recently, some nonlinear controllers have been proposed to address the dead-zone in proportional flow valve. These non-linear controllers can be divided into two categories. One of them is to treat the dead-zone as a combination of a linear and a saturation function[11-17], such as fuzzy control[13], and back-stepping control[14], neural network control[15-17]. Another one is to construct a dead-zone inverse function[18-19], which can be traced back to Tao and Kokotovic's work[20]. Based on the inverse function, adaptive control[21-23] has been applied to tackle the dead-zone in the hydraulic system. But the inverse function will lead to a discontinuous control, which makes it difficult to be accomplished in practice. As an alternative scheme, sliding mode control (SMC)[24-25] was utilized to cope with the dead-zone. The benefit is that neither the dead-zone parameters nor the inverse function is required in the controller design. However, it suffers from severe control chattering.
All the above-mentioned approaches adopt closed-loop control for spool displacement, in which the displacement sensor is installed to detect and feedback the spool position. In regard to the proportional flow valve without displacement sensor, there are few related works focused on dead-zone compensation. Due to the lack of displacement feedback, dead-zone has negative impacts on the static performance of the valve. Therefore, it is of great significance to reduce the dead-zone region and improve the static performance by compensation algorithm in the proportional flow valve without displacement feedback.
In this work, a dead-zone compensation approach is proposed for the proportional flow valve. Instead of detection and feedback of the valve spool movement, the proposed approach relies on the pressure drop across the valve metering orifice to accomplish the compensation. In order to solve the problem of over-compensation because of pressure drop fluctuations, a compensation coefficient was designed to correct it. Then a compensator was designed and developed. In compensator, a subtractor was employed to calculate the pressure drop across the metering orifice, then it was delivered into the controller and compared with the preset reference value, which in turn triggered the compensation module. The consequent benefit is that the dead-zone of the proportional flow valve without displacement sensor was reduced or eliminated, namely, their static performance was improved.
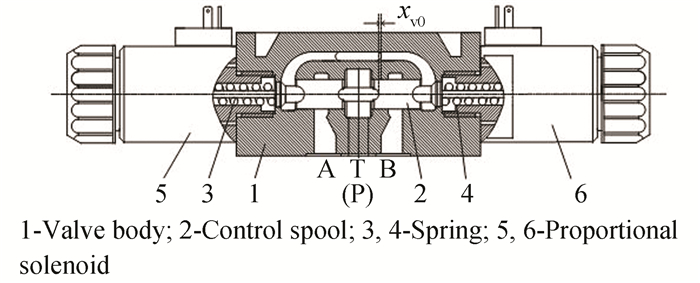
1 Proposed Compensation ApproachIn this work, a proportional directional valve was used as an example to demonstrate the compensation algorithm, whose typical configuration is shown in Fig. 1. As is shown, it consisted of a valve body, a spool, two springs, and two proportional solenoids. Due to mechanical tolerance, friction force, and the inherent characteristics of the solenoid, there was a region of dead-zone in the valve.
|
Fig.1 Typical configuration of proportional directional valve |
Assumption 1: The temperature does not affect the dead-zone of the proportional valve.
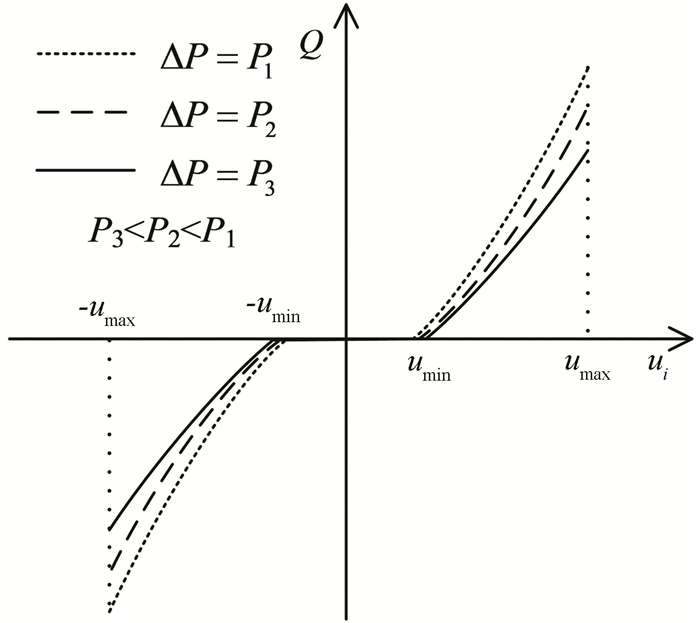
Fig. 2 shows a typical graphical representation of the dead-zone model in the proportional directional valve under the conditions of different pressure drop[26]. As shown, the dead-zone varied with the pressure drop.
|
Fig.2 Dead-zone in the flow curves[27] |
Eq. (1) represents the dead-zone model,
| $ Q= \begin{cases}-C_{d} W x \sqrt{2 \Delta P / \rho}, & -u_{\max } \leqslant u_{i} \leqslant-u_{\min } \\ 0, & -u_{\min }<u_{i}<u_{\min } \\ C_{d} W x \sqrt{2 \Delta P / \rho}, & u_{\min } \leqslant u_{i} \leqslant u_{\max }\end{cases} $ | (1) |
where ui is input signal, Q is the output flow, -umax is the maximum input value in the opposite direction, -umin is the dead-zone threshold in the opposite direction, umin is the dead-zone threshold in the positive direction, umax is the maximum input value in the positive direction, parameter Cd is the discharge coefficient, W is the area gradient, x is the spool displacement, ΔP is the pressure drop, ρ is the fluid density.
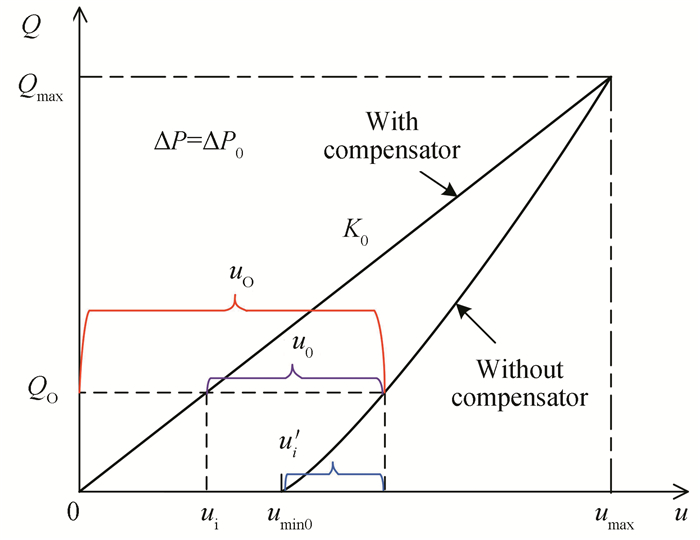
The proposed dead-zone compensation approach is shown in Fig. 3. The curve labelled "without compensator" is the original static output flow-input curve of the valve; another one labelled "with compensator" denotes the static output flow-input curve compensated by the proposed scheme. The expected curve of the output flow is linear, and one endpoint of the line segment is (0, 0), another is (umax, Qmax).
|
Fig.3 Static flow output of valve (reference point) |
Since the target compensation curve is a straight line and there is no dead-zone, then
| $ K_{\mathrm{e}}=\frac{Q_{\max }}{u_{\max }} $ | (2) |
where Ke is the output flow gain, Qmax=CdWxmax
Assumption 2: The Cd is a constant parameter. Eq. (2) can be rewritten as
| $ K_{\mathrm{e}}=\frac{C_{d} W x_{\max } \sqrt{2 \Delta p / \rho}}{u_{\max }} $ | (3) |
where xmax is the maximum spool stroke of the valve without dead-zone, umax is the maximum input signal.
Eq. (3) indicates that both Qmax and Ke are related to the maximum spool stroke xmax and the pressure drop ΔP. In addition, the flow dead-zone threshold umin is affected by ΔP. Therefore, the compensation approach was divided into two cases: compensation under the reference pressure drop and that under the non-reference pressure drop.
The implementation of the compensation algorithm is as follows:
1) The static out flow-input curves of the valve under different pressure drop conditions were tested and recorded on the test bench, so some critical parameters such as the dead-zone threshold, the maximum input signal, and the maximum output flow, namely umin, umax, and Qmax, were obtained;
2) Based on the acquired data, multiple groups of data were extracted, such as (ΔP0, umin0), (ΔP1, umin1), (ΔP2, umin2), ······(ΔPi, umini).кз Then the least squares algorithm was adopted to fit the curve of pressure drop-dead-zone threshold, i.e.:
| $ u_{\min }=f(\Delta P) $ | (4) |
where ΔP0 is the reference pressure drop, umin0 is the dead-zone threshold at ΔP0, ΔPi(i=1, 2, 3...) is the non-reference pressure drop, umini(i=1, 2, 3...) is the dead-zone threshold at ΔPi(i=1, 2, 3...);
3) In the compensator, (ΔP0, umin0) was defined as the reference point. The compensation signal under this condition, u0, was treated as the reference compensation signal in compensator;
4) With regard to non-reference points, if ΔPi < ΔP0, the output signal of compensator is still u0;
5) With regard to non-reference points, if ΔPi > ΔP0, a correction coefficient β was exploited to correct the deviation, which is defined as
| $ \beta=\left.\frac{u_{\min i}}{u_{\min 0}}\right|_{\Delta P=\Delta P_{i}} $ | (5) |
where i=1, 2, 3, ······
Therefore, the compensation signal, uno, generated by the compensator under the condition of non-reference points and ΔPi > ΔP0, can be expressed as
| $ u_{\mathrm{no}}=\beta u_{0} $ | (6) |
where u0 is compensation valve under the condition of reference points.
Based on above description, the compensation algorithm selector can be defined as
| $ \left\{\begin{array}{l} u_{\mathrm{no}}=\beta u_{0}, \text { if } \Delta P_{i}>\Delta P_{0} \\ u_{\mathrm{no}}=u_{0}, \text { if } \Delta P_{i} \leqslant \Delta P_{0} \end{array}\right. $ | (7) |
For the readability of the paper, the curves shown in Fig. 3 as taken as an example to illustrate the compensation principle at the reference point (ΔP0, umin0). In this case, there are ΔP=ΔP0, Ke=K0. Thus, Eq. (3) can be rewritten as
| $ \begin{gathered} \left.K_{0}\right|_{\Delta P=\Delta P_{0}}=\frac{C_{d} W x_{\max } \sqrt{2 \Delta P_{0} / \rho}}{u_{\max }}= \\ \frac{x_{\max }}{u_{\max }} C_{d} W \sqrt{2 \Delta P_{0} / \rho}=\gamma_{0} \frac{x_{\max }}{u_{\max }} \end{gathered} $ | (8) |
where
Assumption 3: For the proportional flow valve without dead-zone, its maximum spool stroke, xmax, is a constant value.
As shown in Fig. 3, when the input signal is ui, the discharge flow of the valve with compensator can be obtained by
| $ Q_{\rm O}=K_{0} u_{i} $ | (9) |
When the output flow of the valve without compensator is QO and the pressure drop is ΔP0, the actual orifice opening can be described as
| $ x=\frac{Q_{\rm O}}{C_{d} W \sqrt{2 \Delta P_{0} / \rho}} $ | (10) |
For proportional flow valve, there is an approximately linear relationship between spool displacement and input signal. It is also applicable to the proportional flow valve with dead-zone. So there is
| $ u_{i}^{\prime}=k x $ | (11) |
where ui' is input signal shown in Fig. 3, k is gain.
As illustrated in Fig. 3, when the input signal is ui, u0 is compensation signal. There is
| $ u_{0}=u_{i}^{\prime}+u_{\min 0}-u_{i} $ | (12) |
Substituting Eqs. (8)-(11) into Eq. (12), the following expression can be obtained
| $ u_{0}=\left(\frac{k x_{\max }}{u_{\max }}-1\right) u_{i}+u_{\min 0} $ | (13) |
Finally, according to the relationship shown in Fig. 3, the output signal of compensator for the reference work point is
| $ u_{0}=u_{0}+u_{i}=\frac{k x_{\max }}{u_{\max }} u_{i}+u_{\min 0} $ | (14) |
For a given proportional valve, both parameters xmax and umax in Eq. (14) are known. As for k and umino, they can be obtained by test results. Therefore, a unique and definite uO exists for any input ui.
1.2 Compensation Scheme at Non-Reference PointFor ΔP > ΔP0, there is ΔP=ΔP1, K=K1. Due to the nonlinearities of the flow-pressure characteristics, the correction coefficient β was designed to compensate the deviation. Thus, Eq. (3) can be rewritten as
| $ \begin{gathered} \left.K_{1}\right|_{\Delta P=\Delta P_{1}}=\frac{C_{d} W x_{\max } \sqrt{2 \Delta P_{1} / \rho}}{u_{\max }}= \\ \frac{x_{\max }}{u_{\max }} C_{d} W \sqrt{2 \Delta P_{1} / \rho}=\gamma_{1} \frac{x_{\max }}{u_{\max }} \end{gathered} $ | (15) |
where
Under the condition of non-reference working point, the output flow of the valve with compensator can be described as
| $ Q_{\rm O}^{\prime}=K_{1} u_{i} $ | (16) |
The compensation signal at non-reference point is
| $ u_{\mathrm{no}}=\beta u_{0}=\beta\left(\frac{k x_{\max }}{u_{\max }}-1\right) u_{i}+\beta u_{\min 0} $ | (17) |
where uno is the compensation signal under the condition of non-reference point.
The output control signal of compensator under the condition of non-reference working point is
| $ u_{0}=u_{\mathrm{no}}+u_{i}=\left(\beta \frac{k x_{\max }}{u_{\max }}-\beta+1\right) u_{i}+\beta u_{\min 0} $ | (18) |
For a given proportional valve, parameters xmax, umax, k, and umino in Eq. (18) are the same with those in Eq. (14). The parameter β can be obtained by Eq. (5). Therefore, there is a unique and definite uO for any input ui as well.
2 Simulation and Analysis 2.1 Simulation ModelThe solenoid in the proportional flow valve can be treated as a combination of resistance and inductance, and its electrical schematic diagram is shown in Fig. 4.

|
Fig.4 Schematic diagram of solenoid |
In Fig. 4, the voltage at the input port is as same as the input control signal of the compensator, ui, so there are
| $ u_{\mathrm{e}}(t)=K_{\mathrm{e}}\left[u_{i}(t)-u_{\mathrm{if}}(t)\right] $ | (19) |
| $ u_{\mathrm{e}}(t)=\left(R_{\mathrm{c}}+r_{\mathrm{p}}\right) i(t)+L_{\mathrm{c}} \frac{\mathrm{d} i(t)}{\mathrm{d} t} $ | (20) |
where ui is the input voltage, Ke is the gain, ue(t) is the output voltage, uif(t) is the feedback voltage, Rc is the equivalent resistance, rP is the internal resistance, i(t) is the current, Lc is the inductance.
In order to improve the performance of the valve, the current feedback was employed in the proportional amplifier, as shown in Fig. 4.
| $ u_{\mathrm{if}}(t)=K_{\mathrm{fi}} i(t) $ | (21) |
where Kfi is the current feedback coefficient.
The force generated by the solenoid is
| $ f_{\mathrm{e}}(t)=K_{i} i(t) $ | (22) |
where fe(t) is the force, Ki is the current-force gain.
The motion of the armature inside the solenoid can be described as
| $ f_{\mathrm{e}}(t)=m_{\mathrm{e}} \frac{\mathrm{d}^{2} x_{\mathrm{e}}(t)}{\mathrm{d} t^{2}}+B_{\mathrm{e}} \frac{\mathrm{d} x_{\mathrm{e}}(t)}{\mathrm{d} t}+K_{\mathrm{et}} x_{\mathrm{e}}(t)+f_{\mathrm{eL}}(t) $ | (23) |
where me is the total mass, xe(t) is the displacement, Be is the viscous damping coefficient, Ket is the spring coefficient, feL(t) is the load force.
The flow across the valve orifice is
| $ Q(t)=C_{\mathrm{d}} W x_{\mathrm{e}}(t) \sqrt{2 \Delta P / \rho} $ | (24) |
Assumption 4: Zero initial condition and constant pressure drop across the metering orifice are adopted.
The Laplace was performed on Eqs. (19) - (24). There are
| $ K_{\mathrm{e}}\left[U_{i}(s)-K_{\mathrm{fi}} I(s)\right]=\left(R_{\mathrm{c}}+r_{\mathrm{p}}\right) I(s)+I(s) L_{\mathrm{c}} s $ | (25) |
| $ F_{\mathrm{e}}(s)=K_{i} I(s) $ | (26) |
| $ K_{i} I(s)=\left(m_{\mathrm{e}} s^{2}+B_{\mathrm{e}} s+K_{\mathrm{et}}\right) X_{\mathrm{e}}(s)+F_{\mathrm{eL}}(s) $ | (27) |
| $ Q(s)=C_{\mathrm{d}} W X_{\mathrm{e}}(s) \sqrt{2 \Delta P / \rho} $ | (28) |
From Eq. (25) to Eq. (28), the simulation model of the valve was established by using Matlab/Simulink software, as shown in Fig. 5.

|
Fig.5 Simulation model |
In the simulation model, the maximum input signal, umax, was limited to 10 V; the reference pressure drop ΔP0 was set as 1 MPa; 5 MPa was selected as the non-reference working point for the purpose of comparative analysis. Here, for the sake of simplicity, the valve of simulation model is identical as the tested valve in Section 4. It was intentionally designed with large dead-zone one. The key parameters employed in the simulation model are shown in Table 1.
| Table 1 Simulation parameters |
2.2 Analysis and Discussion
Firstly, the static performance of the valve was investigated. The input signal, ui, is a 0-10 V ramp signal at an interval of 100 s. The static performance of the valve without compensator is shown in Fig. 6. At the pressure drop of 1 MPa (reference pressure drop), the maximum displacement was 1.8 mm, the spool displacement dead-zone of the valve without compensator was 54%, and its flow dead-zone was 53.5%. When the pressure drop changed from 1 MPa (reference pressure drop) to 5 MPa (non-reference pressure drop), the maximum displacement decreased by 0.1 mm, and the displacement dead-zone of the valve spool increased by 1%. Meanwhile, the flow dead-zone of the valve declined by 2%. It can be concluded that the pressure drop did affect the displacement dead-zone of the proportional flow valve, which would affect its flow dead-zone as well. Therefore, it is necessary to develop the correction coefficient β to correct the deviation and avoid the problem of overcompensation.

|
Fig.6 Static characteristics of the valve without compensator (simulation) |
The static performance of the valve with compensator is shown in Fig. 7. As is shown, at the pressure drop of 1 MPa (reference pressure drop), the maximum flow rate of the valve without compensator was 15 L/min, and its dead-zone was 53.5%; as for the valve with compensator, the maximum flow rate remained the same, namely, 15 L/min, but its dead-zone was reduced to 2%. At the pressure drop of 5 MPa, the maximum flow rate of the valve without compensator was 25.2 L/min, and there was a flow dead-zone of 51.7%. In regard to the valve with compensator, the maximum flow rate was still unchanged, and its dead-zone was reduced to 2%.

|
Fig.7 Static characteristics of the valve (simulation) |
Apart from this, Fig. 7 indicates the impact of the correction coefficient β on the compensator. As is shown, the simulation result without correction coefficient β had over-compensation at the pressure drop of 5 MPa; when the input signal was zero, the output flow was 0.95 L/min approximately. For these with correction coefficient β, there was no overcompensation. In summary, the correction coefficient β can correct the deviation and help to solve the problem of overcompensation.
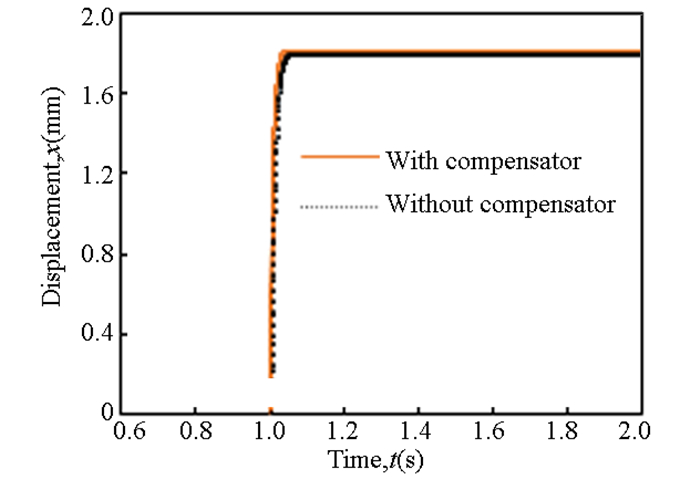
To assess the impact of the compensator on the dynamic performance of the valve, a step input signal of 0-10 V was used in the simulation model. As shown in Fig. 8, it indicates that the compensation method had little effect on the dynamic performance.
|
Fig.8 Dynamic performance of the valve |
3 Implementation of the Compensator
The schematic diagram of the compensator is depicted in Fig. 9.

|
Fig.9 Schematic diagram of the compensator |
The implementation of the compensation algorithm in the compensator is as follows:
1) The input control signal was delivered to compensator. In the compensator, ui was converted to 16-bits digital signal through A/D module:
| $ u^{\prime}{}_{i}=\operatorname{hex}\left(4095 \times \frac{u_{i}}{3}\right) $ | (29) |
where hex ( ) is to convert decimal number to hexadecimal number.
2) Based on the feedback pressure, the current pressure drop, ΔP, was calculated by the subtractor in compensator. Then ΔP was compared with the preset reference pressure drop, ΔP0, which in turn triggered the compensation algorithm selector. If ΔP < =ΔP0, there is
| $ u_{0}^{\prime}=\operatorname{hex}\left(1365\left(\frac{k x_{\max }}{u_{\max }}-1\right) u_{i}+u_{\min 0}\right) $ | (30) |
Otherwise, there is
| $ u_{\mathrm{no}}^{\prime}=\operatorname{hex}\left(1365 \beta\left(\frac{k x_{\max }}{u_{\max }}-1\right) u_{i}+\beta u_{\min 0}\right) $ | (31) |
3) In order to drive the proportional flow valve, the compensation signal was sent to PWM module to generate a PWM signal. The output signal of compensator, uO, is
| $ u_{O}=\left\{\begin{array}{l} K_{c}\left(u_{i}^{\prime}+u_{0}^{\prime}\right), \Delta P \leqslant \Delta P_{0} \\ K_{c}\left(u_{i}^{\prime}+u_{\mathrm{no}}^{\prime}\right), \Delta P>\Delta P_{0} \end{array}\right. $ | (32) |
where Kc is the conversion coefficient.
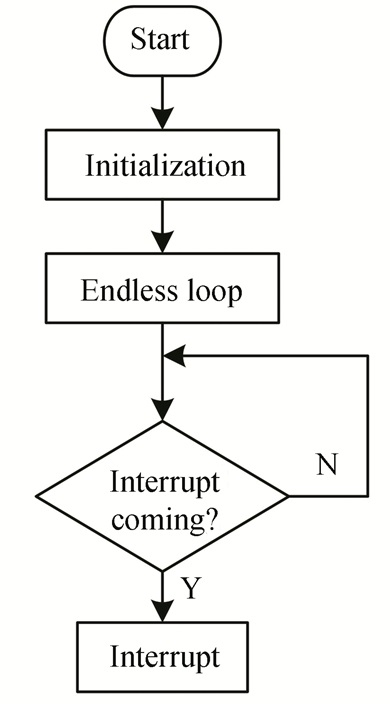
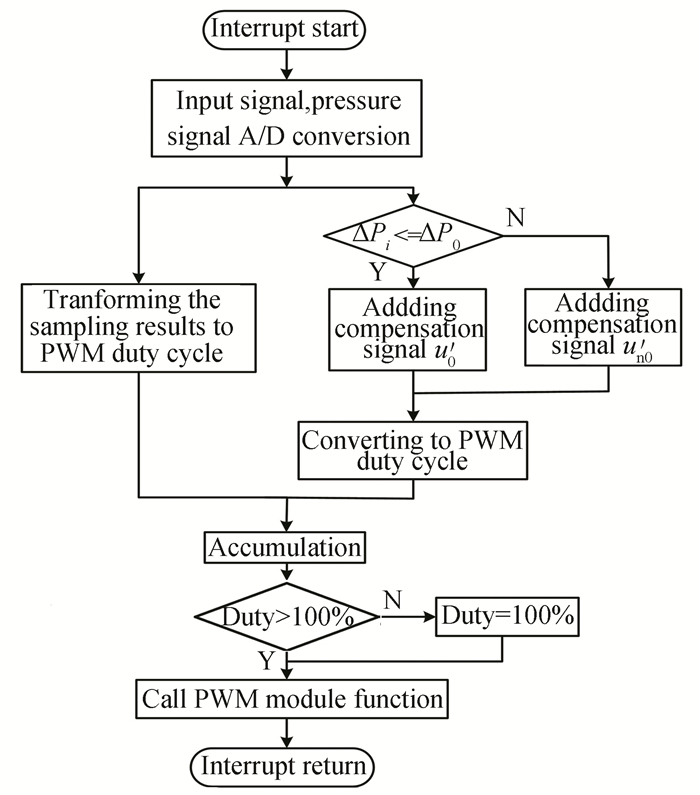
The program of compensator was implemented in a microprocessor. The block diagram of the main program is expressed in Fig. 10. As shown, the system was initialized, including the initialization of ADC module and PWM module. Then it entered into an infinite loop and waited for an interrupt. When the interrupt was triggered, the sub-program was called and executed. As shown in Fig. 11, all the compensation algorithm was performed in the interrupt module.
|
Fig.10 Block diagram of the main program |
|
Fig.11 Block diagram of interrupt module |
The PWM signal, uO, generated by the PWM Module was sent to the driver circuit to control the proportional flow valve. The frequency of uO was 2.5 KHz, and its amplitude was 3.16 V. For example, when the input signal, ui, was 2 V, the PWM signal without compensator, uO, is presented in Fig. 12, and that with compensator, uO, is depicted in Fig. 13. As is shown, the duty cycle of the former was 20 %, and that of the latter was 55%. Obviously, there is a clear difference between the PWM signal without compensator and with compensator.

|
Fig.12 PWM signal without compensator |

|
Fig.13 PWM signal with compensator |
4 Experimental Verification and Discussion 4.1 Experimental Set-Up
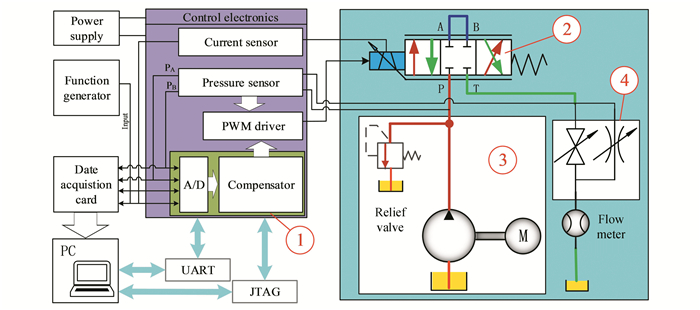
Fig. 14 presents the main components of experimental system. It consisted of a specially-made tested proportional flow valve with a dead-zone (2), two pressure sensors (Kistler 4260A3K0), a flow-meter (SCVF-015-10-01), a hydraulic power unit (3), a load unit (Throttle valve, manual ball valve) (4), a 16-bit data acquisition card (NI-USB-6343), and a function generator. To facilitate verification of the compensator, the dead-zone of the tested valve was intentionally enlarged. What is more, it was not equipped with any displacement sensors. The input range was from 0 V to 10 V, and its maximum output flow at the pressure of 5 MPa was about 27 L/min. The photo of the test rig is shown in Fig. 15.
|
Fig.14 Experimental system |

|
Fig.15 Picture of the experiment |
The measurement range of 4260A3K0 is 0-20 MPa, the accuracy was specified to be +0.1% of BFSL (Best fit straight line), and proof pressure was more than 3?FS. The measurement range of the flowmeter was from 0.6 to 150 L/min, and the accuracy was +0.5% of BFSL. The microprocessor of compensator (1) was a DSP (TMSF28335) with 32-bit MCU. The A/D sampling frequency of DSP was set as 1.25 KHz. The UART (Universal Asynchronous Receiver/Transmitter) was used for communication between PC and the compensator. Besides, the JTAG (Joint Test Action Group) was adopted for communication between PC and DSP. All programs were built, complied, and debugged in C-code environment. In the programs, 1 MPa was set as reference pressure drop. The signals acquisition was realized by NI-USB-6343, and the sampling frequency was 100 Hz. During the test, the input signal, ui, was a 0-10 V ramp signal at an interval of 100 s.
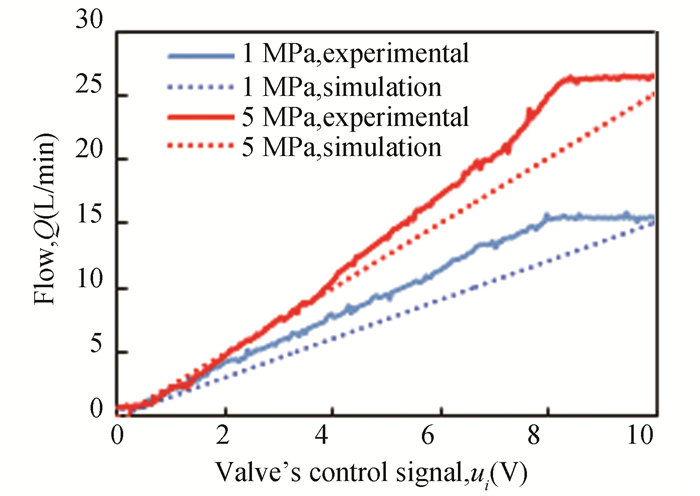
4.2 Impact of Pressure Drop on the Dead-ZoneAt the beginning of this section, the impact of pressure drop on the dead-zone and effectiveness of the simulation model were verified. As shown in Fig. 16, at the pressure drop of 1 MPa, the dead-zone threshold of the valve without compensator was about 53.9%; when the pressure drop was increased to 5 MPa, the dead-zone threshold of the valve was about 51.7%. Meanwhile, these characteristics also appeared in the simulation results. All these results verified that the dead-zone region decreased slightly as the pressure difference increased. In addition, Fig. 16 also confirms the effectiveness of the simulation model. Fig. 17 illustrates that the simulation results are almost consistent with experimental results.

|
Fig.16 Impact of pressure drop on dead-zone (without compensator) |
|
Fig.17 Comparison of simulation and experiment (with compensator) |
In summary, Figs. 16 and 17 show that the simulation model is feasible. However, it should be noticed that the tested curves with compensator was saturated when the input voltage approached 8-8.5 V. This phenomenon is mainly related to the tested valve. Since the prototype's dead-zone was intentionally enlarged in the process of the design and manufacturing, its spool stroke was greatly reduced. Therefore, saturation region is reasonable in the tested curves. As for the simulation results, there are no saturation region, because the spool stroke was not restricted in the simulation model.
In the end, the compensator performance was analyzed. As shown in Fig. 18, the maximum flow rate of the tested valve without compensator was 15.1 L/min at the pressure drop of 1 MPa (reference pressure drop), and the dead-zone was 53.9%. As for the valve with compensator under the same operating condition, the maximum flow rate was approximately 15.2 L/min, but the dead-zone was reduced to 3.5%. At the pressure drop of 5 MPa (non-reference pressure drop), the maximum flow rate without compensator was 24.6 L/min, and there was a flow dead-zone of 51.7%. In regard to that with compensator under the same operating condition, the maximum output flow rate was slightly increased to 25.8 L/min, and the dead-zone was reduced to 3.5%.
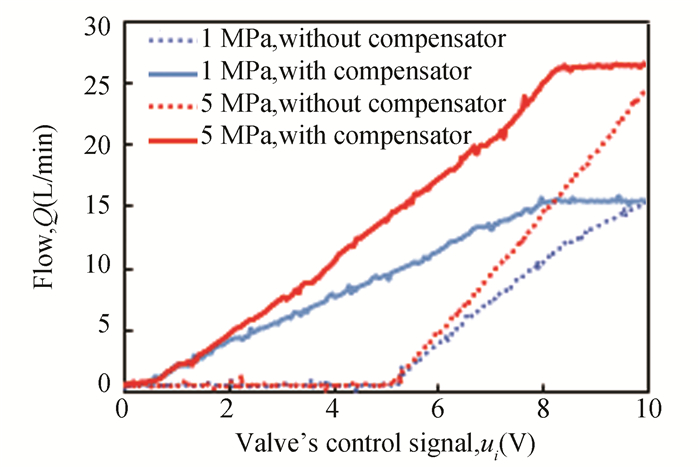
|
Fig.18 Static output flow of the valve with/without compensator |
In order to further verify the effectiveness of the compensator, another dead-zone compensation experiment was carried out. As shown in Fig. 19, for the valve without compensator under reference pressure drop, the maximum flow rate was 27.9 L/min, and the dead-zone was 43.2%. In contrast, for the valve with compensator under the same operating condition, the maximum output flow rate was 28.3 L/min, but the dead-zone was significantly reduced to 1%. At the non-reference pressure drop, the maximum flow rate of the valve without compensator was 35.7 L/min, and there was a flow dead-zone of 42.2%. In regard to that with compensator under the same operating condition, the maximum output flow rate was slightly increased to 36.3 L/min, and the dead-zone was reduced to 1%. Apart from this, it can be found that no saturation phenomenon is shown in the Fig. 17. This can be explained that the effective movement stroke of this valve spool has increased compared with the former valve, and the saturation phenomenon was delayed or even disappeared.
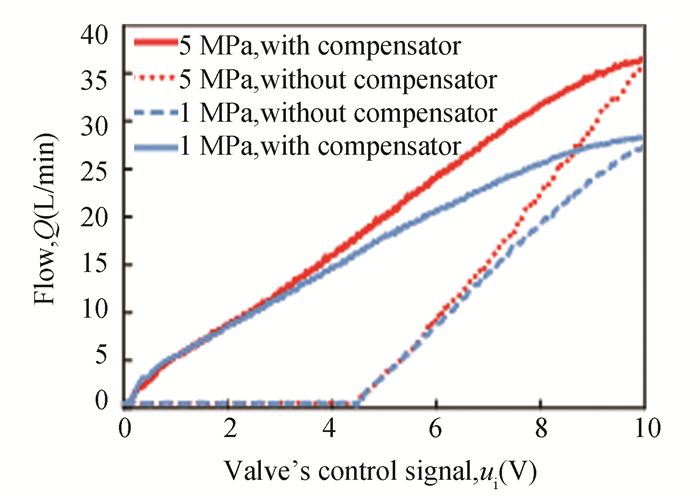
|
Fig.19 Static output flow of the valve with/without compensator |
4.3 Impact of Loads and Temperature on the Dead-Zone
In order to investigate the effect of the oil temperature and loads on the compensator, the following test was carried out under the same pressure drop of 3 MPa. The input voltage was set as 1.5 V and 3.5 V, respectively. As shown in Fig. 20, the load pressure has little impact on the performance of the test valve with dead-zone compensator when the input signal was 1.5 V. When the input signal was increased to 3.5 V, the test results shown in Fig. 21 indicate that the load pressure had a limited effect on the performance of the dead-zone compensator. So it can be concluded from Figs. 20-21 that the valve with compensator can work normally, although the load pressure will have a negative impact on the compensation performance.

|
Fig.20 Impact of loads on output flow |
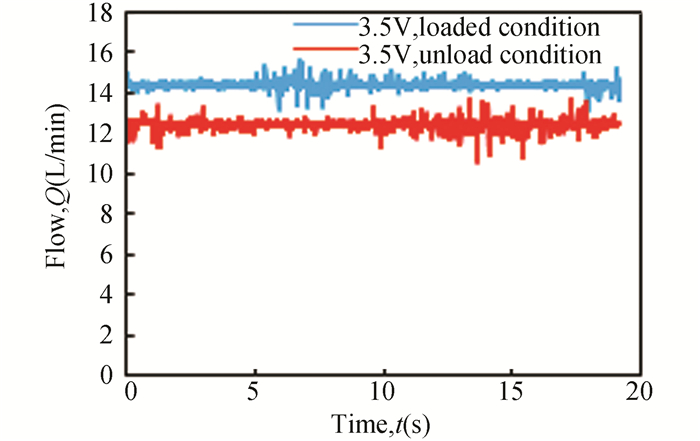
|
Fig.21 Impact of loads on output flow |

|
Fig.22 Impact of oil temperature on output flow |
The impact of the oil temperature on the dead-zone was also evaluated, as shown in Fig. 22. The maximum flow rate was increasing as the oil temperature rose. The error of dead-zone under different temperature was 2/1000.
It can be concluded that the oil temperature had a little impact on the dead-zone of the proportional flow valve. Besides, the compensator worked well under the different loads and oil temperature. All these confirmed that the proposed compensation approach is valid.
Finally, the effectiveness of correction coefficient β was verified in Fig. 23. As is shown, the test result of compensator ignoring correction coefficient β was compared with that considering correction coefficient β. It can be found that the former has over-compensated at the pressure drop of 5 MPa. In this case, even when the input signal, ui, was zero, the output flow rate was about 1.6 L/min. However, as for the latter, there was no over-compensation. Obviously, the correction coefficient β had a positive impact on the compensator performance. It helps to improve the static performance of the valve.

|
Fig.23 Impact of correction coefficient on output flow |
5 Conclusions
This paper presents a dead-zone compensation approach for the proportional flow valve without displacement sensor. Considering the impact of pressure drop on the dead-zone, the compensation approach was divided into two cases: compensation under the reference pressure drop and that under the non-reference pressure drop.
Experiment results indicate that the proposed compensation approach and compensator are feasible. It can effectively reduce the output flow dead-zone and improve the output flow static performance of the proportional flow valve without spool displacement feedback. For example, under reference pressure drop condition (1 MPa), the compensator could reduce the dead-zone of proportional flow valve from 53.9% to 3.5%; under non-reference pressure drop condition. Taking 5 MPa as the example in the test, the dead-zone of the proportional flow valve was reduced from 51.7% to 3.5% as well.
The pressure drop was found to be one of the factors affecting the dead-zone region. The dead-zone region decreased as the pressure drop increased under the identical input condition. This will lead to the over-compensation. To deal with the problem, a correction coefficient was presented and constructed in the compensation approach. The test results indicate that correction coefficient worked as expected, and could effectively eliminate the over-compensation.
However, although this compensation approach can compensate the dead-zone under different loads conditions, the impact of loads on the dead-zone of the proportional flow valve remains to be verified in the following work.
| [1] |
Huang J H, Dai J J, Quan L, et al. Performance of proportional flow valve with pilot pressure drop-spool opening compensation. Transaction of the ASME, Journal of Dynamic Systems, Measurement, and Control, 2017, 139: 011009. DOI:10.1115/1.4034504 (  1) 1) |
| [2] |
Huang J H, Wang X N, Wang H, et al. Development of a flow control valve with digital flow compensator. Flow Measurement and Instrumentation, 2019, 66: 157-169. DOI:10.1016/j.flowmeasinst.2019.03.004 (  1) 1) |
| [3] |
Andrighetto P L, Valdiero A C, Bavaresco D. Dead zone compensation in pneumatic servo systems. ABCM symposium series in mechatronics, 2008, 3: 501-509. (  1) 1) |
| [4] |
Valdiero A C, Guenther R, De Negri V J. New methodzology for identification of the dead zone in proportional directional hydraulic valves. ABCM Symposium Series in Mechatronics, 2006, 2: 377-384. (  1) 1) |
| [5] |
Hua B, Wang L, Du Y F, et al. Design and experiment on integrated proportional control valve of automatic steering system. IFAC-PapersOnLine, 2018, 51(17): 389-396. DOI:10.1016/j.ifacol.2018.08.190 (  1) 1) |
| [6] |
Taghizadeh M, Najafi F, Ghaffari A. Multimodel PD-control of a pneumatic actuator under variable loads. The International Journal of Advanced Manufacturing Technology, 2010, 48(5-8): 655-662. DOI:10.1007/s00170-009-2293-3 (  1) 1) |
| [7] |
Liu G P, Daley S. Optimal-tuning nonlinear PID control of hydraulic systems. Control Engineering Practice, 2000, 8(9): 1045-1053. DOI:10.1016/S0967-0661(00)00042-3 (  1) 1) |
| [8] |
Magyar B, Hös C, Stépán G. Influence of control valve delay and dead zone on the stability of a simple hydraulic positioning system. Mathematical Problems in Engineering, 2010, 2010: 349489. DOI:10.1155/2010/349489 (  1) 1) |
| [9] |
Alfi A. Chaos suppression on a class of uncertain nonlinear chaotic systems using an optimal H? adaptive PID controller. Chaos, Solitons & Fractals, 2012, 45(3): 351-357. DOI:10.1016/j.chaos.2012.01.001 (  1) 1) |
| [10] |
Pratumsuwan P, Thongchai S. Pre-compensation for a hybrid fuzzy PID control of a proportional hydraulic System. Proceedings of the 2009 6th International Conference on Electrical Engineering/Electronics, Computer, Telecommunications and Information Technology. Piscataway: IEEE, 2009, 362-365. DOI:10.1109/ECTICON.2009.5137027 (  1) 1) |
| [11] |
Ma H J, Yang G H. Adaptive output control of uncertain nonlinear systems with non-symmetric dead-zone input. Automatica, 2010, 46(2): 413-420. DOI:10.1016/j.automatica.2009.11.010 (  1) 1) |
| [12] |
Gao Y, Tong S C. Composite adaptive fuzzy output feedback dynamic surface control design for stochastic large-scale nonlinear systems with unknown dead zone. Neurocomputing, 2016, 175: 55-64. DOI:10.1016/j.neucom.2015.10.016 (  1) 1) |
| [13] |
Khooban M H, Alfi A, Abadi D N M. Teaching-learning-based optimal interval type-2 fuzzy PID controller design: a nonholonomic wheeled mobile robots. Robotica, 2013, 31(7): 1059-1071. DOI:10.1017/S0263574713000283 (  1) 1) |
| [14] |
Guo Q, Sun P, Yin J M, et al. Parametric adaptive estimation and backstepping control of electro-hydraulic actuator with decayed memory filter. ISA Transactions, 2016, 62: 202-214. DOI:10.1016/j.isatra.2016.02.009 (  1) 1) |
| [15] |
Peng J Z, Dubay R. Identification and adaptive neural network control of a DC motor system with dead-zone characteristics. ISA Transactions, 2011, 50(4): 588-598. DOI:10.1016/j.isatra.2011.06.005 (  1) 1) |
| [16] |
Chen Q, Ren X M, Na J, et al. Adaptive robust finite-time neural control of uncertain PMSM servo system with nonlinear dead zone. Neural Computing and Applications, 2017, 28(12): 3725-3736. DOI:10.1007/s00521-016-2260-5 (  2) 2) |
| [17] |
Perez Cruz J H, de Jesus Rubio Avila J, Flores J L, et al. Control of uncertain plants with unknown deadzone via differential neural networks. IEEE Latin America Transactions, 2015, 13(7): 2085-2093. DOI:10.1109/TLA.2015.7273762 (  2) 2) |
| [18] |
Xu B, Su Q, Zhang J H, et al. A dead-band model and its online detection for the pilot stage of a two-stage directional flow control valve. Proceedings of the Institution of Mechanical Engineers, Part C: Journal of Mechanical Engineering Science, 2016, 230(4): 639-654. DOI:10.1177/0954406215578158 (  1) 1) |
| [19] |
Zhou J, Wen C, Zhang Y. Adaptive output control of nonlinear systems with uncertain deadzone nonlinearity. IEEE Transactions on Automatic Control, 2006, 51(3): 504-511. DOI:10.1109/TAC.2005.864200 (  1) 1) |
| [20] |
Tao G, Kokotovic P V. Adaptive control of plants with unknown dead-zones. IEEE Transactions on Automatic Control, 1994, 39(1): 59-68. DOI:10.1109/9.273339 (  1) 1) |
| [21] |
Xu B, Su Q, Zhang J H, et al. Analysis and compensation for the cascade dead-zones in the proportional control valve. ISA Transactions, 2017, 66: 393-403. DOI:10.1016/j.isatra.2016.10.012 (  1) 1) |
| [22] |
Deng W X, Yao J Y, Ma D W. Robust adaptive precision motion control of hydraulic actuators with valve dead-zone compensation. ISA Transactions, 2017, 70: 269-278. DOI:10.1016/j.isatra.2017.07.022 (  1) 1) |
| [23] |
Barai R K, Nonami K. Locomotion control of a hydraulically actuated hexapod robot by robust adaptive fuzzy control with self-tuned adaptation gain and dead-zone fuzzy pre-compensation. Journal of Intelligent and Robotic Systems, 2008, 53(1): 35-56. DOI:10.1007/s10846-008-9231-8 (  1) 1) |
| [24] |
Bessa W M, Dutra M S, Kreuzer E. Sliding mode control with adaptive fuzzy dead-zone compensation of an electro-hydraulic servo-system. Journal of Intelligent and Robotic Systems, 2010, 58(1): 3-16. DOI:10.1007/s10846-009-9342-x (  1) 1) |
| [25] |
Chiang C C, Tsai C T. Model reference fuzzy sliding mode control of strict-feedback uncertain systems with unknown dead-zone. Proceedings of the 2016 IEEE International Conference on Fuzzy Systems (FUZZ-IEEE). Piscataway: IEEE, 2016, 477-484. DOI:10.1109/FUZZ-IEEE.2016.7737725 (  1) 1) |
| [26] |
Valdiero A C, Guenther R, De Negri V J. New methodology for identification of the dead zone in proportional directional hydraulic valves. ABCM Symposium Series in Mechatronics, 2006, 2: 377-384. (  1) 1) |
| [27] |
Rexroth A G. 4/2- and 4/3- way proportional directional valves, direct operated, without electrical position feedback, without / with integrated electronics (OBE), RE29055/10.05. https://dc-us.resource.bosch.com/media/us/products_13/product_groups_1/industrial_hydraulics_5/pdfs_4/re29055.pdf[2020-11-27]
(  2) 2) |
 2022, Vol. 29


