2. Tianyuan Construction Group Limited Company, Linyi 276002, Shandong, China;
3. China Construction First Group Corporation Limited, Beijing 100161, China;
4. School of Civil Engineering, Harbin Institute of Technology, Harbin 150096, China
The modular construction is a burgeoning building system, in which the building industrialization is highly embodied in the whole life cycle. Its core concept is standardized prefabricated module that is produced in the factory, transported to the site, and assembled by key joints to rapidly build the whole building. Compared with the traditional architectural forms, the modular construction has the advantages of shortening the construction period, saving energy and recycle utilization. Modular construction form is used by the mobile castle PUMA CITY in Italy, the container community SILODAM COMPLEX in the Netherlands, the BOXPARK in London, and the Qianhai Innovation Business Center in Shenzhen. The RAS ABU ABOUND stadium for the 2022 World Cup in Qatar will be completely spliced by modular containers which can be flexibly assembled and disassembled. Therefore, the modular construction can provide more possibilities for future structure innovation.
At present, only a few researches have studied the connection joints of fabricated modular construction. Most of them are the design of system function and joint form, and the investigation of its mechanical properties focuses on static test and simulation analysis. There is lack of experimental study on seismic performance of key connection joints. Annan et al.[1] and Giriunas et al.[2] have carried out experimental and numerical study on the overall mechanical properties of the steel module construction system within various loads. Tagawa et al.[3], Chen et al.[4], Fang[5], Li[6], and Liu et al.[7] have explored the static performance of new connection joints of modular construction, and relevant design methods and recommendations are given. In addition, one of the basic principles of Chinese structural seismic design code is strong-joint and weak-member. Therefore, it is of great significance for experimental study on seismic behavior of key connection joints for assembled modular construction.
This paper proposes a new type of fabricated connection joint for high-rise modular construction, and it is convenient for rapid assembly and module recycle. In order to investigate the comprehensive seismic behavior of this kind of inter-module joint, longitudinal and lateral cyclic shear tests were designed and completed. It is of great significance for the promotion and application of new assembly joints and modular construction systems.
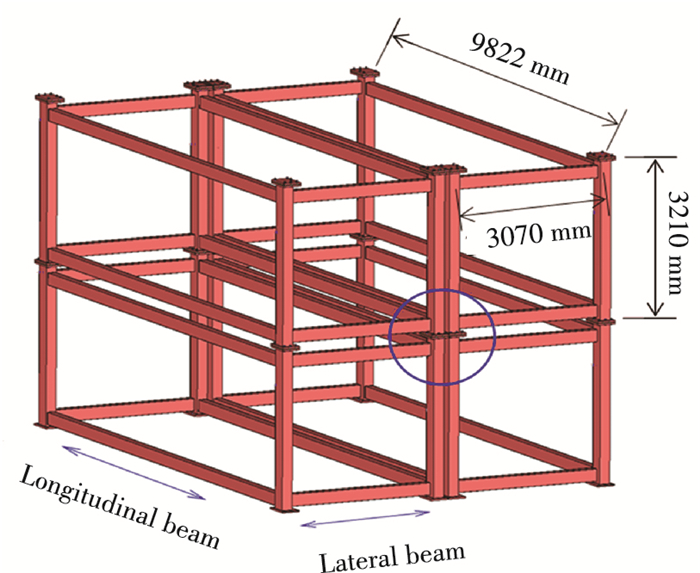
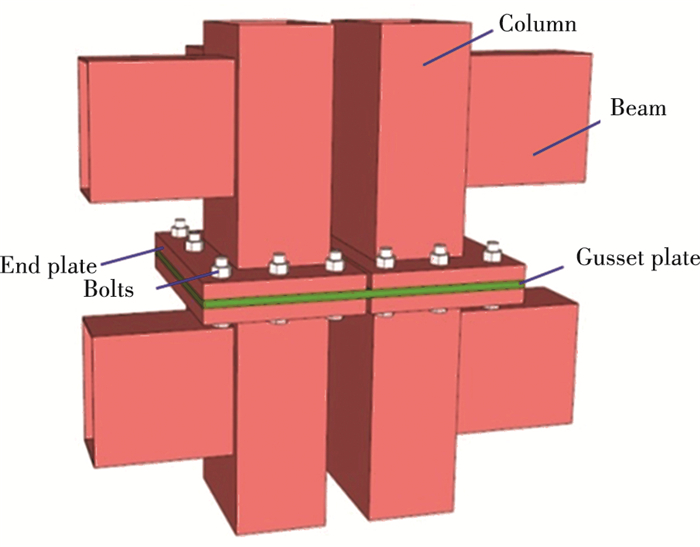
1 Experimental Programs 1.1 Design of Key Connection JointAccording to our previous research, the maximum stress appears at the bottom edge node of the high-rise assembled modular construction system under static and seismic loads. Therefore, a bottom edge connection joint of the fabricated modular construction was selected as the test joint of this study, which connects the column end plates of four separate modules together with high-strength bolts, as shown in Fig. 1. This fabricated modular construction was made up of modules with 9822 mm long, 3070 mm wide, and 3210 mm high. Under the static and seismic loads, this connection joint bore the longitudinal and lateral shear force in the horizontal plane. The detailed joint structure is shown in Fig. 2. The 30 mm thick plate was welded at both ends of the module unit as bolted end plate, and four modules were connected together by the additional gusset plate. Due to the influence of the longitudinal and lateral beams, the joint area was subjected to a certain degree of eccentric. The end plates of four columns were connected with middle gusset plate by 12 M24 high-strength friction bolts. Two 4 mm column diaphragms were welded in the column position of the upper and lower beam to improve the end-column shear capacity. Table 1 gives the detailed section information of the joint components.
|
Fig.1 Connection joint of four modules |
|
Fig.2 Schematic diagram of test joint |
| Table 1 Component section of test joint |
The seismic performance of this connection joint between modules was investigated by the pseudo-static test. Because the connection joint was subjected to shear force under the action of horizontal loads or earthquake, the low-cycle cyclic shear test for this joint was designed to study its hysteretic behavior. The displacement meters and strain gauges were arranged at some key positions of test joint to measure the deformation and component stress. It provided test basis for the seismic performance evaluation of this kind of joint.
1.2 Longitudinal Cyclic Shear TestUnder the action of horizontal loads or earthquake, the shear force of this connection joint caused by relative motion of modules was the main force, which includes longitudinal and the lateral shear forces. For the longitudinal cyclic shear test, considering the symmetry of this connection joint and ignoring the influence of the lateral beam, the columns of the upper and lower modules connected by the gusset plate was selected as the simplified test joint.
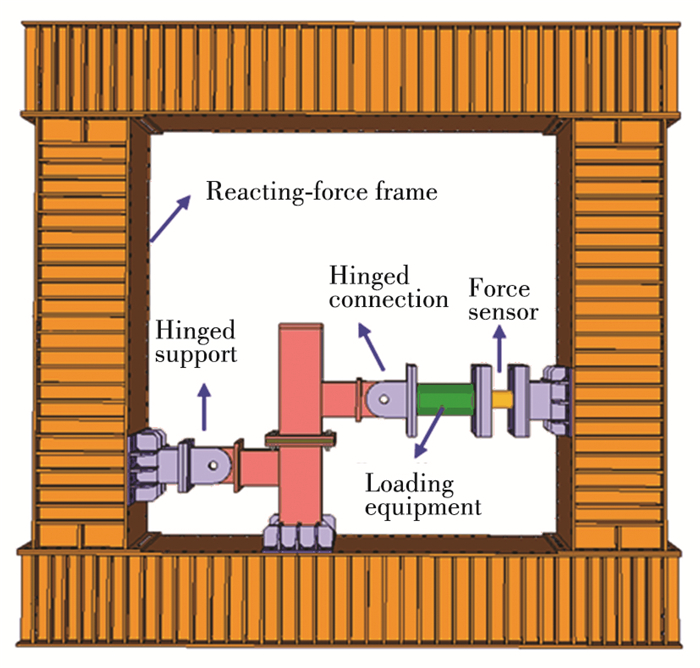
Test design schematic diagram for the longitudinal cyclic shear test is given in Fig. 3. There were short beams in the upper and lower columns of the test node, respectively. To avoid additional bending moment, the short beam of upper column was used to attach the loading equipment by a hinged connection, while the short beam of lower column was fixed on the reacting-force frame by a hinged support. The bottom of the lower column was connected with a fixed bearing on the reacting-force frame to realize the rigid connection constraint. To realize the hysteresis test of reciprocating load, this test was controlled by two-way hydraulic valve to control the push force or pull force. Through the acquisition system, real-time observation of load value was achieved by the force sensor.
|
Fig.3 Experimental design of longitudinal cyclic shear test |
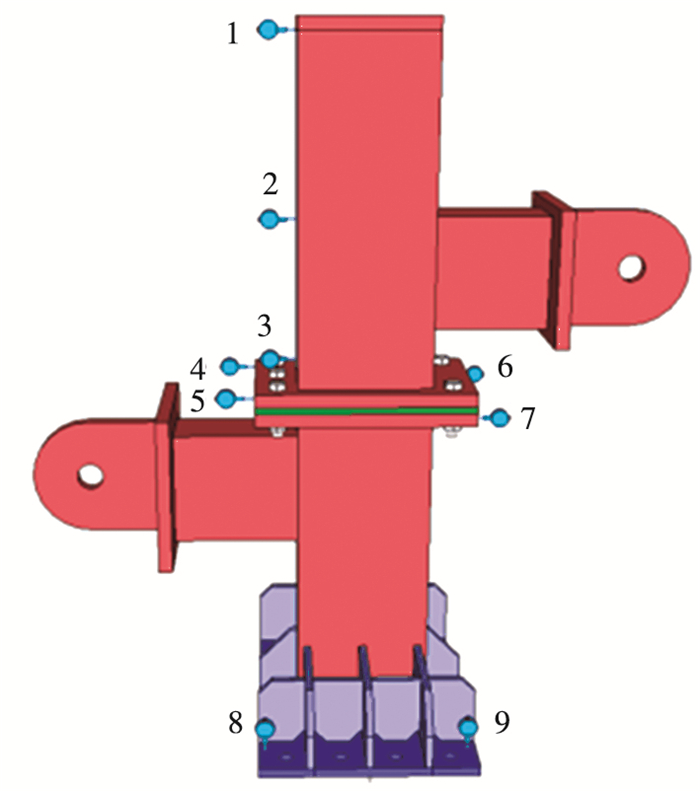
The arrangement diagram of displacement meters is shown in Fig. 4. There are nine test points for displacement measurement in total. The results of test point 4~7 can calculate the dislocation deformation between the upper and lower column end plates of the node area caused by shear force under horizontal load, which is the key index for the load displacement curve of this test. The arrangement diagram of strain gauges is shown in Fig. 5. There were nine 45° strain-gauge rosettes and five strain gauges for strain measurement in total. The strain-gauge rosettes were used to measure the equivalent stresses in plane of some complex stress position at end column and junction of the beam-column. The uniaxial tension or compression stresses were measured by the strain gauges[8].
|
Fig.4 Arrangement diagram of displacement meters |

|
Fig.5 Arrangement diagram of strain gauges |
Pre-loading was carried out twice before the formal test. The load value of pre-loading refers to the previous numerical simulation results. It was about 10% of expected ultimate load (40 kN). After the pre-loading, the test points and test equipment were inspected to ensure the security and reliability, and then the formal test began. According to the Chinese Specification of Testing Methods for Earthquake Resistant Building, the formal test adopted the force control loading system and multi-stage loading. Each load stage was about 50 kN and it was cycled each load stage. When the test joint yielded failure, each load stage cycled twice. When the load grew slowly or decreased, the cyclic loading was stopped.
1.3 Lateral Cyclic Shear TestFor the lateral cyclic shear test, this connection joint resisted shear force as a whole and the influence of the longitudinal beam cannot be overlooked. The subsidiary structure and longitudinal beams were considered to simulate the action of space constraints, and then the test joint was more in accordance with actual circumstance.
Fig. 6 gives the test design schematic diagram for the lateral cyclic shear test. The columns of four modules were connected by high-strength bolts and gusset plate. The short beam of upper right column was used to attach the loading equipment by a hinged connection, while the short beam of lower left column was fixed on the reacting-force frame by a hinged support. The bottom of the lower columns was connected with a fixed bearing on the reacting-force frame to realize the rigid connection constraint. The four-module connection node was selected as accessory structure of distal constraint part. The columns of this accessory structure were fixed on upper and lower beams of the distal reacting-force frame, while the beams in the left and right were connected to the two sides of reacting-force frame by hinged supports. This accessory structure was connected to test joint by longitudinal beams. Horizontal cyclic loads were only applied to the test joint to evaluate its hysteretic behavior.
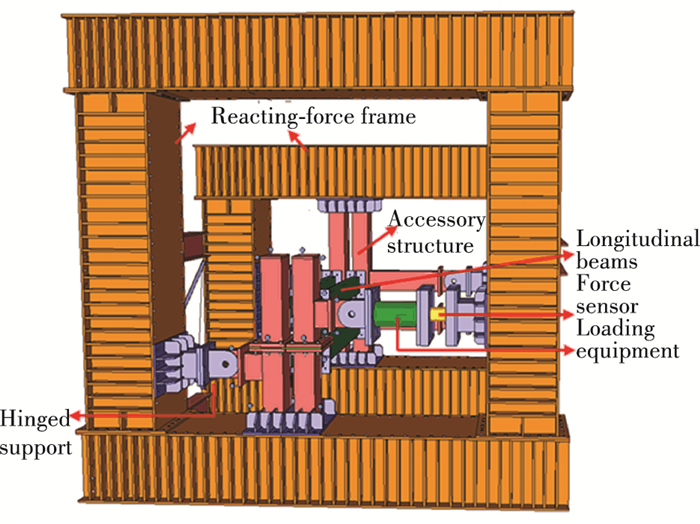
|
Fig.6 Experimental design of lateral cyclic shear test |
The arrangement diagram of displacement meters is shown in Fig. 7. There were twelve test points for displacement measurement in total. The results of test point 1~4 can calculate the horizontal lateral movement of the column, the deflection in the vertical plane, and the torsion angle of the node. The displacement value of test point 5~8 can present the dislocation deformation between the upper and lower column end plates of the node area caused by shear force under horizontal load. The arrangement diagram of strain gauges is shown in Fig. 8.

|
Fig.7 Arrangement diagram of displacement meters |
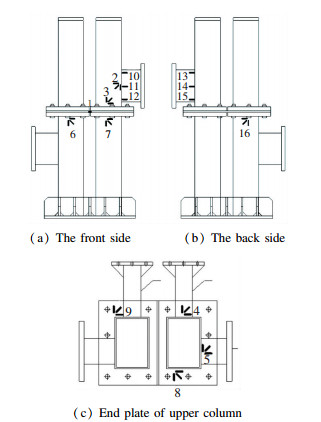
|
Fig.8 Arrangement diagram of strain gauges |
There were nine 45° strain-gauge rosettes and seven strain gauges for strain measurement in total. The strain-gauge rosettes were used to measure the equivalent stresses in plane of some complex stress position at end column and junction of the beam-column. The uniaxial tension or compression stresses were measured by the strain gauges. The loading system and scheme were the same as the longitudinal cyclic shear test.
2 Test Phenomena and Results Analysis 2.1 Longitudinal Cyclic Shear TestAt the beginning of cyclic loading, the test node had no significant changes. When the cyclic load increased to about 200 kN, the specimen began to show significant tilt, but it was still in recoverable elastic phase, which is shown in Fig. 9. As the cyclic load continued to increase, the load growth rate became slow. When it reached about 400 kN, obvious bulge damage occurred in the short beam connected to lower column due to the extrusion. Small cracks appeared in the weld of beam end due to continuing cyclic loading, as shown in Fig. 10. After unloading, the inclination of the specimen and the yielding of beam end were unrecoverable. The yielding failure of test joint occurred at this time and the load capacity was lost.
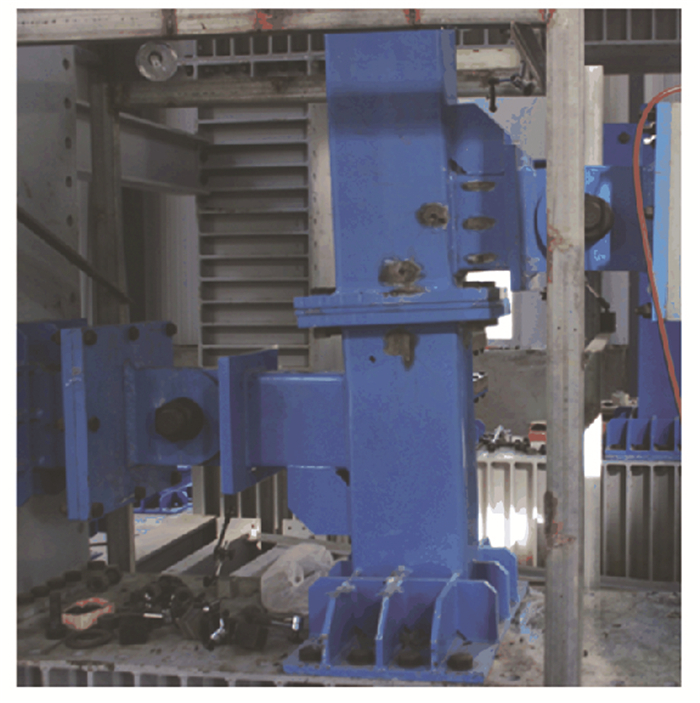
|
Fig.9 The tilt of the specimen |
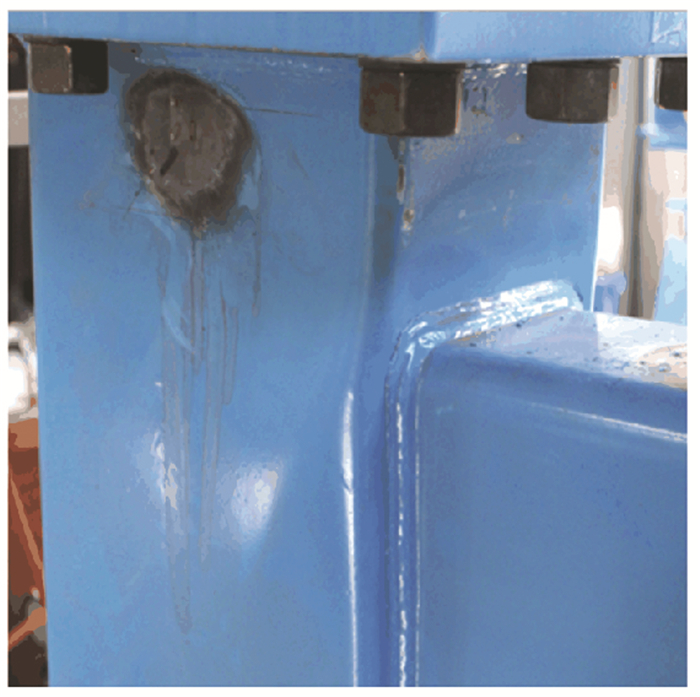
|
Fig.10 Bulge and cracks between the columns and short beam |
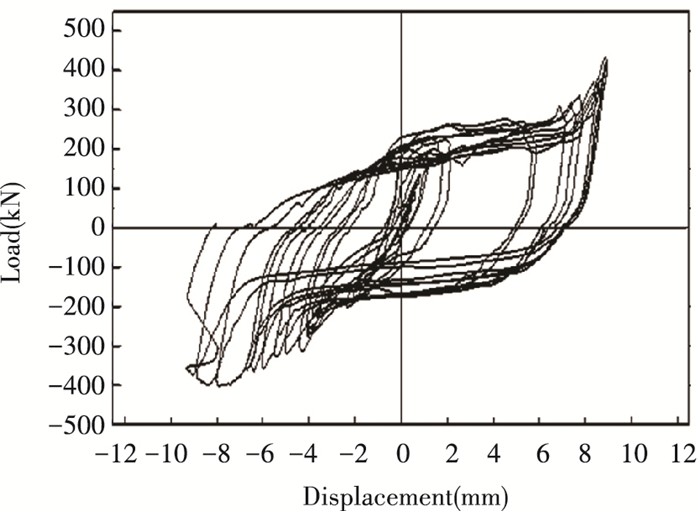
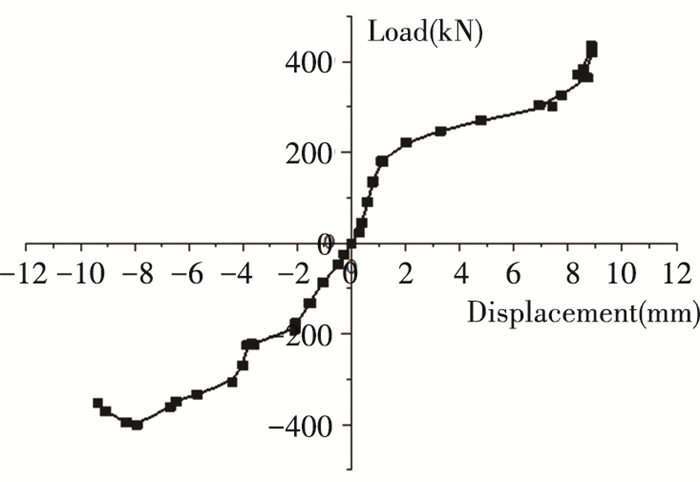
Fig. 11 shows the hysteretic curve of longitudinal cyclic shear test. The load is tension or pressure in the horizontal (tension is positive and pressure is negative). According to the hysteretic curve, at the initial stage of loading, the load and displacement were almost linear and the specimen was in the elastic stage. During the action of cyclic load, the curve changed almost linearly. After the end of each cycle, the displacement gradually recovered to approach 0. When the cyclic load increased to about 200 kN, the curve did not maintain linearity. The load growth rate slowed down and the displacement developed rapidly. Besides, envelope area of the curve had gradual expansion and the test joint presented good dissipation capacity. The test skeleton curve was obtained by connecting the peak points of each cycle in the hysteretic curve, as shown in Fig. 12. When the cyclic load increased to 400 kN, the curve of pressure zone began to decline because the steel plate of the column yielded, and it was close to ultimate load-bearing capacity of the test joint. But after tensile deformation of the test node, the column tilted and the node was no longer a pure shear stress state, but changed into a combination of tension and shear. Then the horizontal tension force showed an upward trend.
|
Fig.11 Hysteretic curve of longitudinal cyclic shear test |
|
Fig.12 Test skeleton curve of longitudinal cyclic shear test |
2.2 Lateral Cyclic Shear Test
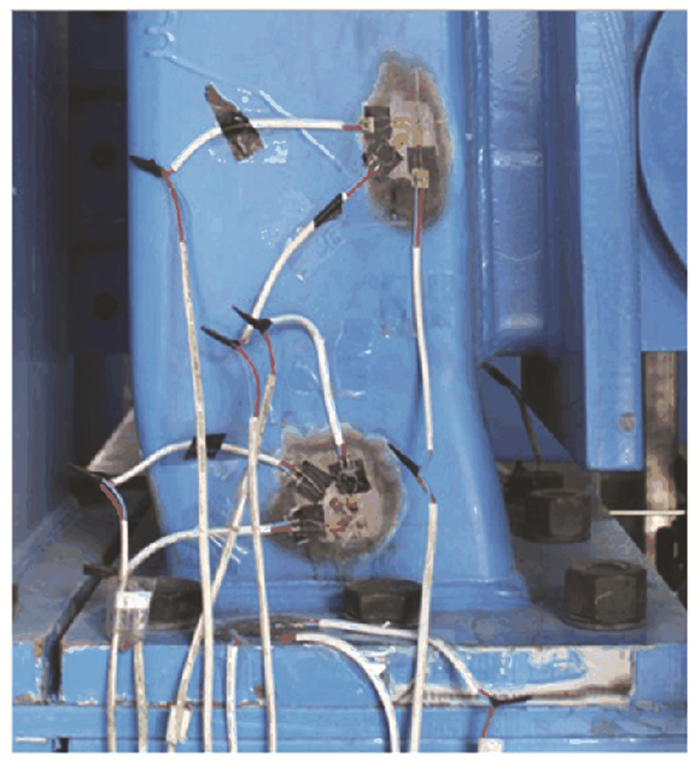
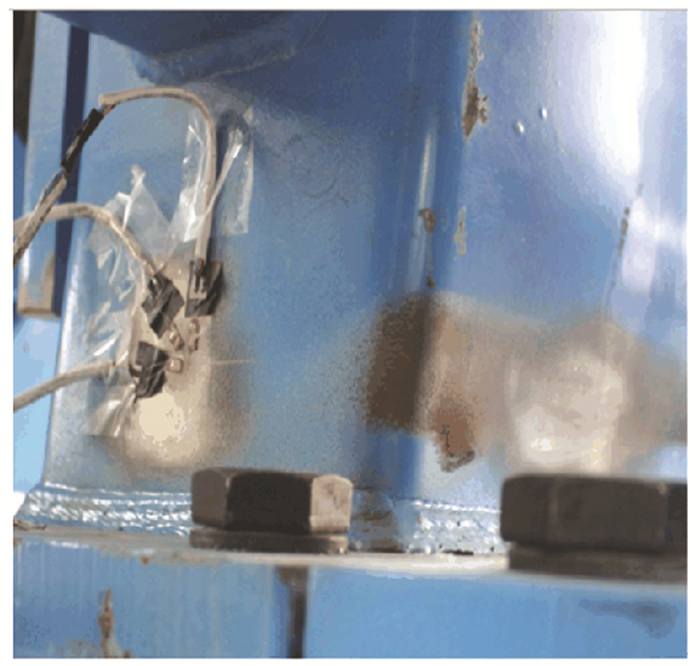
At the beginning of cyclic loading, the test node had no significant changes. When the cyclic load increased linearly, the specimen began to show significant tilt, but it was still in recoverable elastic phase. As the cyclic load continually increased to about 400 kN, obvious relative deformation appeared at the end of upper right column, as shown in Fig. 13. The stress of the nearby region increased rapidly to the yield strength of the material. When the cyclic load reaches about 600 kN, obviously bulge damage occurred at the upper right column sidewall without beam, and small cracks began to be formed at the weld of column end, as shown in Fig. 14. After unloading, the deformation of the specimen and the yielding area were unrecoverable, the yielding failure of test joint occurred at this time, and the load capacity was lost.
|
Fig.13 Significant lateral deformation at the end of column |
|
Fig.14 Weld crack and column bulge damage |
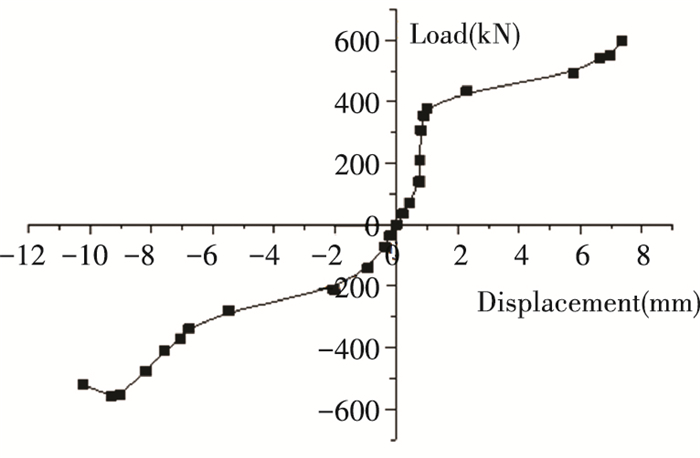
Fig. 15 shows the hysteretic curve of lateral cyclic shear test. It can be seen from the figure that the load and displacement were almost linear at the initial stage of loading. The curves were almost coincident, the envelope area was small, and the specimen was still in the elastic stage. The curve developed unevenly in the tension zone and the pressure zone. When the tensile force increased to about 400 kN and the pressure increased to about 200 kN, the load growth rate slowed down and the displacement developed rapidly. The envelope area of the curve had gradual expansion, while the area of pressure zone became larger than that of the tensile zone. The test joint presented good dissipation capacity. The test skeleton curve was obtained as shown in Fig. 16 which is similar to the longitudinal cyclic shear test. When the cyclic load increased to 600 kN, the curve of pressure zone began to decline because the steel plate of the column yielded, and it was close to ultimate load-bearing capacity of the test joint, while the curve of tensile zone could still grow.

|
Fig.15 Hysteretic curve of lateral cyclic shear test |
|
Fig.16 Test skeleton curve of lateral cyclic shear test |
2.3 Analysis of Seismic Performance Indicators
Through the above cyclic shear tests of these test joints, some key seismic performance indicators such as ductility coefficient, energy dissipation coefficient, and stiffness degradation are analyzed as follows.
According to the Chinese Specification of Testing Methods for Earthquake Resistant Building[9], the ductility ratio μ was used to analyze the ductility of the joint, which is the ratio of the ultimate displacement and the yield displacement. The yield displacement was taken from the displacement of loading cycle that the inflection point appeared in the load displacement curve, while the ultimate displacement was taken from the displacement of the maximum bearing capacity. For the longitudinal and lateral cyclic shear tests, the ductility coefficients μΔ were 4.54 and 4.98, respectively. Both of them are larger than the standard requirements of ductility coefficient 4.0 for the steel frame, which meet the requirements of engineering application.
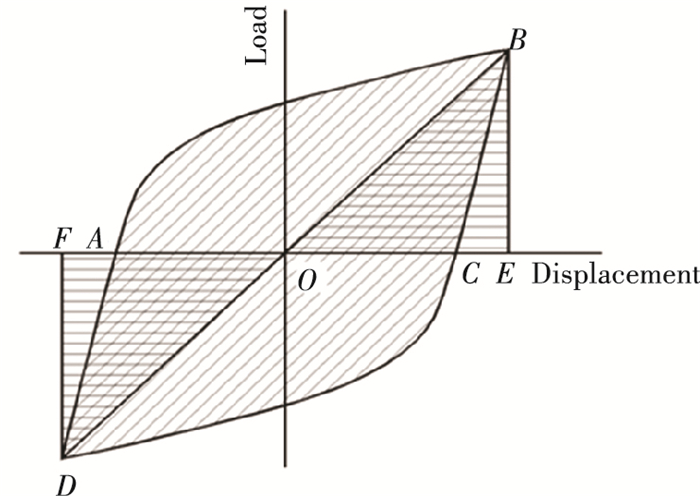
The energy dissipation coefficient is an important indicator to evaluate the seismic performance of test joint. According to the specification[9], the envelope area of hysteretic curve was used to represent the energy dissipation capacity of structural component. The energy dissipation coefficient E was calculated by Eq. (1) as shown in Fig. 17. The calculation results of E are given in Table 2. The ductility of structural component is directly reflected by its energy dissipation capacity, so the fuller the hysteretic curve is, the stronger energy dissipation capacity the component has under earthquake action.
| $ E=S_{(A B C+C A D)} / S_{(O B E+O D E)} $ | (1) |
|
Fig.17 Calculation diagram of energy dissipation coefficient |
| Table 2 Calculation of energy dissipation coefficient |
where S(ABC+CAD) is the envelope area of the hysteretic curve, and S(OBE+ODE) is the sum of triangle OBE and triangle ODE, as shown in Fig. 17.
The stiffness of the specimen was calculated by secant stiffness that is regulated by the specification[9]. To investigate of the stiffness variation of the test joints under cyclic load, stiffness degradation rate can be calculated by Eqs. (2) and (3):
| $ K_{i}=\left\{\left[+F_{i}\right]+\left[-F_{i}\right]\right\} /\left\{\left[+X_{i}\right]+\left[-X_{i}\right]\right\} $ | (2) |
| $ \lambda_{i}=K_{i} / K_{1} $ | (3) |
where Ki is the secant stiffness of the specimen, +Fi and -Fi are the load values of positive peak and negative peak of the i-th load cycle, +Xi and -Xi are the displacement values of positive peak and negative peak of the i-th load cycle, λi is the stiffness degradation rate.
Fig. 18 and Fig. 19 are stiffness degradation curves for the longitudinal and lateral cyclic shear tests, respectively. At the initial stage of loading, there was a certain fluctuation in the joint stiffness. After some time, local area began to yield, the joint stiffness decreased rapidly with the increase of loading cycles, and the stiffness degradation rate in the longitudinal cyclic shear test was similar to that in the lateral cyclic shear test. Besides, there was a certain stiffness jumping phenomenon, which indicates that the ductility development for such joints is unbalanced under the earthquake action.

|
Fig.18 Stiffness degradation curve of longitudinal cyclic shear test |

|
Fig.19 Stiffness degradation curve of lateral cyclic shear test |
3 Conclusions
In this paper, the seismic performance of a new type of fabricated connection joint for high-rise modular construction was investigated by the pseudo-static cyclic shear test. According to the test results and failure state of test joints, some conclusions can be drawn as follows:
1) A new type of fabricated connection joint for high-rise modular construction is proposed, which is convenient for rapid assembly and module recycle. The low-cycle in-plane shear tests were designed and completed. It provides significant reference for related study of similar assembly joints.
2) Under the action of in-plane cyclic shear load, the yield failure position of the specimen was mainly at the attachment area of the short beam and the junction of column end plate. After unloading, the loading column still had an obvious inclination and yielding area is unrecoverable. Plastic damage occurred at the test joint and the load capacity was lost.
3) For the longitudinal and lateral cyclic shear tests, the hysteretic curves of test joints were relatively plump in shapes. The ductility coefficients were 4.54 and 4.98, and the energy dissipation coefficients were 1.83 and 1.43, respectively. The test joints had good energy dissipation capacity and ductility. But the stiffness degradation curves show the ductility development for such joints is unbalanced.
| [1] |
Annan C D, Youssef M A, Naggar M H E. Experimental evaluation of the seismic performance of modular steel-braced frames. Engineering Structures, 2009, 31(7): 1435-1446. DOI:10.1016/j.engstruct.2009.02.024 (  0) 0) |
| [2] |
Giriunas K, Sezen H, Dupaix R B. Evaluation, modeling, and analysis of shipping container building structures. Engineering Structures, 2012, 43: 48-57. DOI:10.1016/j.engstruct.2012.05.001 (  0) 0) |
| [3] |
Tagawa H, Lei K, Yang B. Damage of steel buildings during earthquakes and their seismic upgrading. Building Structure, 2011, 41(12): 20-23. (in Chinese) DOI:10.19701/j.jzjg.2011.12.004 (  0) 0) |
| [4] |
Chen H Z, Wang Y L, Wang G L. Experimental study and FEM analysis of packaged cast-steel joints. Proceedings of the Third National Conference on Steel Structure Engineering Technology. Shaanxi: Xi'an, 2010. 560-563. (in Chinese)
(  0) 0) |
| [5] |
Fang Z G. Hysteretic behavior study on semi-rigid beam-column joints in steel residence. Qingdao: China University of Petroleum (East China), 2011. (in Chinese)
(  0) 0) |
| [6] |
Li J D. Numerical Simulation and Experimental Research of the New Adjustable Beam Height Fabricated Steel Frame Joints. Harbin: Harbin Institute of Technology, 2013. (in Chinese)
(  0) 0) |
| [7] |
Liu X C, Pu S H, Xu A X, et al. Experimental study on static and seismic performance of bolted joint in modularized multi-layer and high-rise prefabricated steel structures. Journal of Building Structures, 2015, 36(12): 43-51. (in Chinese) (  0) 0) |
| [8] |
Wu Y D. A Graphic method of strain rosette stress analysis. Journal of Nanjing University of Aeronautics and Astronautics, 1980, 1: 128-150. (in Chinese) (  0) 0) |
| [9] |
China Academy of Building Research. JCJ/T101-2015.
(  0) 0) |
 2022, Vol. 29


