The switchgear is a very crucial control device in the power plant, and its working state has a great influence on the power plant. According to long-term work experience, insulation failure is a crucial factor leading to internal operation problems of the switchgear[1-2]. The partial discharge of the switchgear is a crucial factor that leads to internal insulation failures in the switchgear[3-6]. Therefore, the analysis of PD fault signals in the switchgear is extremely crucial for the normal operation of the entire power plant. However, the working environment of the power plant is extremely complicated. There is noise interference of the equipment such as GIS, transformers and air compressors, and noise energy is high. The PD fault signal of the switchgear is extremely weak, often annihilated in the strong interference noise of the surrounding equipment of the power plant, affecting the results of the power plant switchgear PD fault signal detection. Therefore, extracting accurate switchgear PD signal is critical to improving the accuracy of detection results[7-9].
In the denoising methods of the PD signal, the wavelet threshold denoising algorithm is most commonly used[10-14]. In several common wavelet threshold denoising algorithms, Donoho[15] proposed that soft threshold and hard threshold noise functions are the most commonly used denoising functions, but there is a certain limitation, so many scholars have improved the threshold function on this basis. Ref. [16] proposed a new threshold function between hard and soft threshold functions, but the processing of high frequency signals will excessively denoise. Ref. [17] proposes a combined wavelet denoising algorithm based on genetic adaptive soft threshold, and the threshold is adaptively optimally selected by genetic algorithm, but the threshold function is not improved. Ref. [18] proposes a threshold function denoising algorithm with parameters, but the appropriate solution is not given for the selection of the parameters. This paper proposes a continuous adaptive threshold function, which can adaptively select parameters and adjust the threshold function according to the PD signal. This paper conducts denoising experiments on PD simulated signals and measured signals, and at the same time uses probabilistic neural networks (PNN) to perform pattern recognition on the denoised PD signals. The results show that the continuous adaptive threshold denoising method overcomes the traditional threshold noise reduction insufficiently, and has a good denoising effect on PD fault signals. It can better remove the interference of partial discharge noise in engineering.
1 Basic Algorithm Theory 1.1 Principle of Wavelet TransformWavelet transform is a signal processing tool that has gradually matured since the 1980s. It has dual analysis capabilities for time and frequency, and has multi-resolution characteristics. Compared with the Fourier transform, the wavelet transform inherits and develops the localization idea of the Fourier transform. At the same time, it provides a time-frequency window that can vary with frequency. Therefore, the wavelet transform can better process signals with transient mutation characteristics, and can efficiently analyze the local characteristics of the signal in the time domain and frequency domain. At present, wavelet transform is used in many fields such as signal processing and image processing[19-21].
The definition of wavelet transform is to translate a basic wavelet function ψ(t), and do the inner product with the signal x(t) under the action of the scale function, namely:
| $ \mathrm{WT}_x(a, \tau)=\frac{1}{\sqrt{a}} \int_{-\infty}^{+\infty} x(t) \psi^*\left(\frac{t-\tau}{a}\right) \mathrm{d} t $ | (1) |
where a is the scale factor, which is positive, τ is the displacement factor, which can be positive or negative, and * is the conjugate. a and τ in the formula are two continuous transform functions. ψ(t) is the wavelet function, which is also called the mother wavelet. Eq.(1) is expressed in the equivalent frequency domain, and Eq.(2) can be obtained:
| $ \mathrm{WT}_x(a, \tau)=\frac{\sqrt{a}}{2 \pi} \int_{-\infty}^{+\infty} X(\omega) \psi^*(a \omega) e^{+\mathrm{j} \omega \tau} \mathrm{d} \omega $ | (2) |
where X(ω) and ψ(aω) are obtained by Fourier transform of x(t) and ψ(aτ), respectively. The continuous wavelet reconstruction function is expressed as Eq.(3):
| $ f(t)=\frac{1}{C_\psi} \int_{-\infty}^{+\infty} \int_{-\infty}^{+\infty} \frac{1}{a^2} W_f(a, \tau) \psi\left(\frac{t-\tau}{a}\right) \mathrm{d} a \mathrm{~d} \tau $ | (3) |
If the parameters a and τ in Eq.(3) are taken as discrete values:
| $ a=a_0^j, \tau=k \tau_0, a_0^m, j, k \in Z, a_0 \neq 1 $ | (4) |
the discrete wavelet transform can be obtained, and the formula for solving the discretized wavelet transform coefficients is as follows:
| $ C_{j, k}=\frac{1}{\sqrt{a_0^j}} \int_{-\infty}^{+\infty} f(t) \psi^*\left(a_0^{-j} t-k \tau_0\right) \mathrm{d} t $ | (5) |
The function of discrete wavelet reconstruction is as follows:
| $ f(t)=C \sum\limits_{-\infty}^{+\infty} \sum\limits_{-\infty}^{+\infty} C_{j, k} \psi_{j, k}(t) $ | (6) |
where
Wavelet transform can be regarded as a kind of band-pass filter. The center frequency of the filter is related to the scalefactor a, and the smaller the value of the scale factor, the smaller the observation range in the time domain, but the higher the frequency resolution in the frequency domain. On the contrary, the larger the value of the scale factor, the larger the observation range in the time domain, but the lower the frequency resolution in the frequency domain. Wavelet transform has the characteristics of multi-scale, and the frequency resolution can be analyzed gradually from low to high. Commonly used mother wavelets include Db wavelet, Sym wavelet and Coif wavelet.
The calculation process of wavelet transform mainly includes the following 5 steps:
1) Determine the wavelet base function and a scale factor to compare it with the initial segment signal.
2) The formula of the wavelet transform is calculated to calculate the wavelet coefficient that the wavelet coefficient can reflect the similarity of the wavelet base function under the current scale factor and the corresponding initial signal segment.
3) Move the wavelet along the time axis by changing the translation factor. Repeat the above steps to complete an analysis.
4) Increase the scale factor, repeat the above 3 steps for the second analysis.
5) The four steps are circulated until the analysis requirements are met.
1.2 Principle of Wavelet Threshold DenoisingIn actual testing, the PD signal of the switchgear is often polluted by white noise. White noise is one of the main interferences in PD monitoring, with strong randomness and irregularity. Generally speaking, white noise is quite different from PD signal. The smoothness of PD signal is higher and the singularity is lower, but the singularity of white noise is higher. In order to eliminate the interference of white noise, the wavelet coefficients of the noise-stained signal need to be processed. The signal observation model measured by the actual sensor can be expressed as
| $ f(t)=s(t)+w(t) $ | (7) |
where f(x) is the real PD signal with white noise, s(x) is the PD signal without noise, w(t) is the white noise interference signal with a mean value of 0 and a standard deviation of δ. The commonly used method to eliminate the influence of white noise is the wavelet threshold method. This method was proposed by Donoho[15]. It has the advantages of small calculation amount and easy implementation. It is widely used to remove white noise interference. The basic principle of wavelet threshold to remove PD signal white noise is as follows: after the measured PD signal is wavelet transformed, according to the different properties of the wavelet coefficients of the white noise and the wavelet coefficients of the PD signal, the threshold and the threshold function can be used to process the measured PD signal. The processed wavelet coefficients are reconstructed by wavelet to obtain the reconstructed signal to achieve the purpose of removing white noise. The expression of the classical threshold λsqt is
| $ \lambda_{\text {sqt }}=\delta_E \sqrt{2 \ln N} $ | (8) |
where δE is the estimated value of δ, and N is the number of wavelet coefficients. Next, check whether the wavelet coefficient F[m] of the observed signal is smaller than λsqt. If F[m] < λsqt, set it to zero. Otherwise, keep it as the estimated value of the wavelet coefficient of the PD signal. Finally, the processed wavelet coefficients are inversely transformed to obtain the PD signal after the white noise is removed. This method is implemented by the hard threshold function wh. The hard threshold function adopts the strategy of "eliminating" or "retaining" the wavelet coefficients, and the function expression is
| $ w_h= \begin{cases}x, & |x| \geqslant \lambda \\ 0, & |x|<\lambda\end{cases} $ | (9) |
where wh is the estimated wavelet coefficient. In addition, Donoho[15] also constructed another threshold function, soft threshold function. The expression of ws is
| $ w_s= \begin{cases}|x|-\lambda, & |x| \geqslant \lambda \\ 0, & |x|<\lambda\end{cases} $ | (10) |
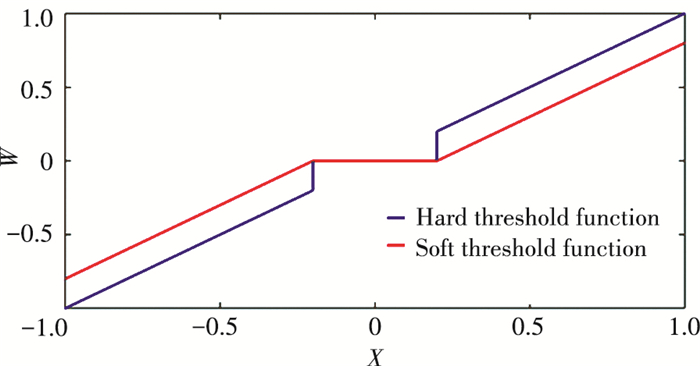
Compared with the hard threshold function adopting the "elimination" or "retention" strategy, the soft threshold function adopts the "shrinkage" or "retention" strategy. These two are the most common threshold functions. It can be seen that the main points of the threshold denoising method based on wavelet transform are the wavelet basis function and the threshold function. In fact, based on these two points, many scholars have improved the denoising method. The main methods include wavelet basis function selection, threshold selection and threshold function construction.
The function graphs of the hard threshold function and the soft threshold function are shown in Fig. 1. From Fig. 1, it can be seen that the hard threshold function zeroes the points whose absolute amplitude is not greater than the threshold, and retains the points whose absolute amplitude is greater than the threshold. However, the hard threshold function has discontinuities at the positive and negative thresholds, and the reconstructed signal will oscillate and blur. The soft threshold function is continuous at the threshold, but the whole is contracted, and the reconstructed signal has a constant deviation from the original signal.
|
Fig.1 Image of hard and soft functions |
1.3 Probabilistic Neural Network
Probabilistic Neural Network (PNN) is a kind of calculation method developed based on Bayesian minimum risk criterion. It can calculate the nonlinear discriminant boundary of the Bayesian optimal discriminant surface. Different from the back propagation algorithm used in traditional neural networks, PNN is a forward propagation algorithm based on statistics, which has better pattern classification performance, excellent fault tolerance and strong classification ability. It compares the samples to be recognized with the pattern samples in the sample library one by one. The more the pattern matching samples, the better the recognition effect, so it can meet the requirements of real-time processing in training[22-23]. The formula is as follows:
| $ f(x)=\frac{1}{N(2 \pi)^{n / 2} \sigma^n} \sum\limits_{i=1}^N \mathrm{e}^{\frac{\left|x-x_i\right|^2}{2 \sigma^2}} $ | (11) |
where N is the total number of training samples, x is the vector of random variables, xi is the training vector, and σ is the smoothing parameter.
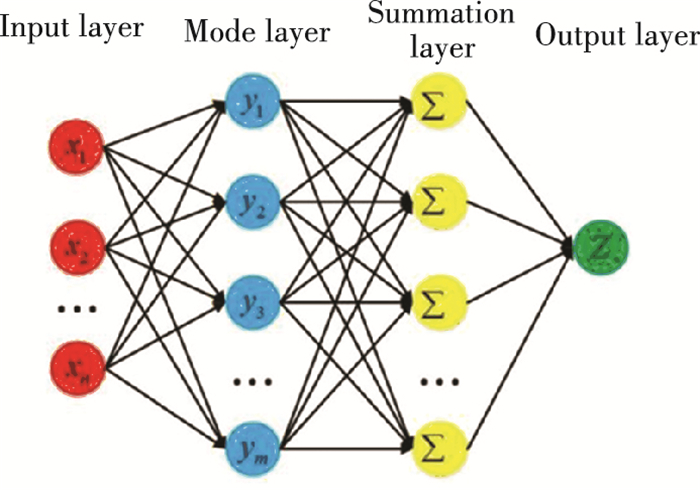
The PNN structure is shown in Fig. 2.
|
Fig.2 PNN structure diagram |
Input layer: The input layer calculates the Euclidean distance between the input vector and all training sample vectors. In this paper, the PD signal features are extracted and input to the input layer. The number of neurons is the dimension of the feature vector.
Pattern layer: The pattern layer includes all training samples. The number of neurons is equal to the number of known pattern matching samples. The more the number of known pattern matching samples, the more accurate the recognition result.
Summation layer: The summation layer aggregates and averages the output information of all neurons belonging to the same category, and classifies the sample X according to the Bayesian decision rule:
| $ Q(x)=\frac{1}{N} \sum\limits_{j=1}^N \phi(X) $ | (12) |
| $ Z(X)=\arg \max \left[Q_i(X)\right] $ | (13) |
where Z(X) is the final classification of sample X, which is output by the output layer.
Output layer: The output layer has only one neuron. This layer outputs the type with the highest probability as 1, and the rest are 0.
2 Continuous Adaptive Wavelet Threshold DenoisingFor the wavelet threshold denoising method, when the threshold function is continuous and differentiable in the wavelet domain, there is a better denoising effect. Considering the above characteristics, this paper constructs a continuous adaptive wavelet threshold function, whose formula is as follows:
| $ w_{x, k}= \begin{cases}(x-\lambda)^8+\lambda\left(\frac{e^{\lambda-|x|}}{k}-1\right)+x, & x \geqslant \lambda \\ \frac{\left|x^k\right|}{k \lambda^{k-1}} e^{\lambda-|x|}, & |x|<\lambda \\ -(x+\lambda)^8-\lambda\left(\frac{e^{\lambda-|x|}}{k}-1\right)+x, & x \leqslant-\lambda\end{cases} $ | (14) |
where wx, k is the wavelet coefficient after the threshold function is applied, λ is the threshold of the function, and k is the adjustment parameter of the continuous adaptive threshold function.
2.1 Proof of Continuity and Differentiability of Continuous Adaptive Wavelet Threshold FunctionIn this paper, the continuous adaptive wavelet threshold function is proposed to improve the denoising effect, and the proof of the continuity and derivability of the threshold function is as follows:
When x=λ
| $ \begin{gathered} \lim _{x \rightarrow \lambda^{-}} w_{x, k}=\frac{\left|\left(\lambda^{-}\right)^k\right|}{k \lambda^{k-1}} e^{\lambda-\left|\lambda^{-}\right|} \approx \frac{\lambda}{k} \\ \lim _{x \rightarrow \lambda^{+}} w_{x, k}=\left(\lambda^{+}-\lambda\right)^8+\lambda\left(\frac{e^{\lambda-\mid \lambda^{+}} \mid}{k}-1\right)+\lambda^{+} \approx \frac{\lambda}{k} \end{gathered} $ | (15) |
When x=-λ
| $ \begin{aligned} \lim _{x \rightarrow(-\lambda)^{-}} w_{x, k}=&-\left(-\lambda^{-}+\lambda\right)^8-\lambda\left(\frac{e^{\lambda-\left|-\lambda^{-}\right|}}{k}-1\right)+\\ &\left(-\lambda^{-}\right) \approx-\frac{\lambda}{k} \\ \lim _{x \rightarrow(-\lambda)^{+}} w_{x, k}=& \frac{\left|\left((-\lambda)^{+}\right)^k\right|}{k \lambda^{k-1}} e^{\lambda-\left|(-\lambda)^{+}\right|} \approx-\frac{\lambda}{k} \end{aligned} $ | (16) |
According to Eqs.(15) and (16), the proposed threshold function is continuous at both positive and negative thresholds.
The continuity of the first derivative is proved as follows:
When x=λ
| $ \begin{aligned} \lim _{x \rightarrow \lambda^{-}} \frac{\partial w_{x, k}}{\partial x}=& \frac{k\left(\lambda^{-}\right)^{k-1}}{k \lambda^{k-1}} \mathrm{e}^{\lambda-\left|\lambda^{-}\right|}-\frac{\left(\lambda^{-}\right)^k}{k \lambda^{k-1}} \mathrm{e}^{\lambda-\left|\lambda^{-}\right|} \approx \\ & 1-\frac{\lambda}{k} \\ \lim _{x \rightarrow \lambda^{-}} \frac{\partial w_{x, k}}{\partial x}=& 8\left(\lambda^{+}-\lambda\right)^7-\frac{\lambda}{k} e^{\lambda-\left|\lambda^{+}\right|}+1 \approx \\ & 1-\frac{\lambda}{k} \end{aligned} $ | (17) |
When x=-λ
| $ \begin{aligned} \lim _{x \rightarrow(-\lambda)^{-}} \frac{\partial w_{x, k}}{\partial x}=&-8\left((-\lambda)^{-}+\lambda\right)^7-\\ & \frac{\lambda}{k} \mathrm{e}^{\lambda-\left|(-\lambda)^{-}\right|}+1 \approx 1-\frac{\lambda}{k} \\ \lim _{x \rightarrow(-\lambda)^{+}} \frac{\partial w_{x, k}}{\partial x}=& \frac{k\left|(-\lambda)^{+}\right|^{k-1}}{k \lambda^{k-1}} \mathrm{e}^{\lambda-\left|(-\lambda)^{+}\right|}-\\ & \frac{\left|(-\lambda)^{+}\right|^k}{k \lambda^{k-1}} \mathrm{e}^{\lambda-\left|(-\lambda)^{+}\right|} \approx 1-\frac{\lambda}{k} \end{aligned} $ | (18) |
According to Eqs.(17) and (18), the first-order derivative of this function is continuous at the positive and negative thresholds. Therefore, the derivative of the function at the positive and negative thresholds is continuous, and the threshold function is a continuous and derivable threshold function, which meets the requirements of the threshold function.
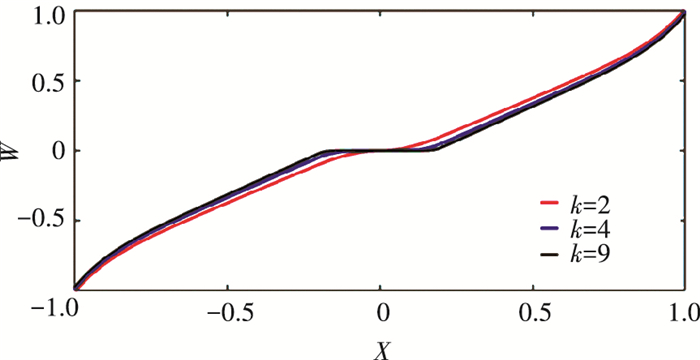
2.2 Characteristics of Continuous Adaptive Wavelet Threshold FunctionThere is an adjustment parameter k in the continuous adaptive threshold function formula proposed in this paper. The value of k will not affect the continuity and derivability of the function, but will only change the trend of the threshold function. Fig. 3 is an image of the change trend of the threshold function when k selects different values.
|
Fig.3 Image of continuous adaptive threshold function when k =2, 4, 9 |
The continuous adaptive threshold function is continuous and derivable in the wavelet domain, and the parameter of the threshold function can be changed by adjusting the adjustment parameter k. There is a transition interval. In this transition interval, the noise of the corresponding signal and the wavelet coefficient of the useful signal are not easy to distinguish. The ratio of noise removal can be adjusted by adjusting the adjustment parameters of this part of the function. According to the characteristics of the continuous adaptive threshold function, the larger the k is, the closer to the hard threshold function, which is more suitable for removing signals with large noise ratio; the smaller the k is, the more relaxed the transition interval is, and it is more suitable for removing signals with small noise ratio. The denoising method in this article is proposed for PD signal. Due to the high frequency characteristics of the PD signal, it is easy to be interfered with white noise. Therefore, it is necessary to adopt threshold functions of different adjustment parameters in each wavelet decomposition layer to reduce noise.
2.3 Selection of Adjustment Parameter kThe continuous adaptive threshold function proposed in this paper has an adjustment parameter k. For different PD signal decomposition, according to its characteristics and the noise energy ratio of different layers, each layer adaptively selects a different adjustment parameter k to adjust and determine the most suitable threshold function for this layer, so that it can achieve the best noise reduction effect. For the decomposition layer with a large proportion of noise energy, a threshold function with a larger k value should be selected, which has a better effect on removing strong noise. A decomposition layer with a small signal energy proportion and a threshold function with a smaller k value should be selected. More attention should be paid to retain useful signal. As the proportion of signal energy increases, the value of k is gradually reduced. A mathematical model of k can be established according to the energy distribution characteristics of the signal and noise:
| $ k_i=2+7 \frac{E_{n i}}{E_{d i}} $ | (19) |
where Edi is the energy of wavelet decomposing the signal containing noise in the i layer, and Eni is the energy of wavelet decomposing the noise in the i layer. When the i-th layer is all noise, En1≈Ed1, k takes the maximum value of 9. When the i-th layer signal is completely without noise, Eni=0 and k takes the minimum value of 2. Under normal operating conditions, the estimated value of En1 can be self-adapted to obtain the value of k, and the range of k is (2, 9].
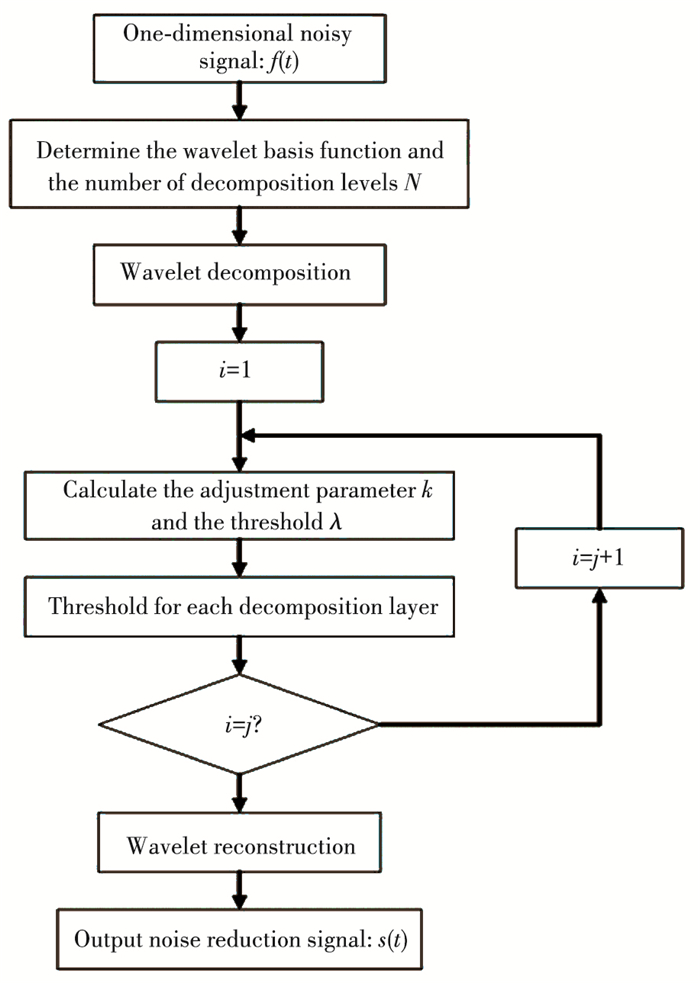
2.4 Continuous Adaptive Wavelet Threshold Denoising MethodThe denoising process of the noisy PD signal s(t) using the continuous adaptive wavelet threshold denoising method can be divided into the following steps:
1) Determine the wavelet basis function and the number of wavelet decomposition levels N. By comparing the denoising effects of different wavelet basis functions and different decomposition levels, the N value of wavelet basis functions and decomposition levels are determined.
2) Calculate the adjustment parameter k of each wavelet decomposition layer according to Eq.(19).
3) Calculate the threshold of each wavelet decomposition layer. Given a threshold λ, obtain its likelihood estimation threshold through Stein′s unbiased likelihood estimation principle, and then minimize the non-likelihood threshold to obtain the final optimal threshold.
4) The adjustment parameter k obtained in step (2) is introduced into Eq.(14) to obtain the threshold function of each wavelet decomposition layer, and the threshold value is applied to the N high frequency coefficients after wavelet decomposition and the threshold value is adjusted adaptively.
5) The low-frequency coefficients decomposed by the wavelet and the processed high-frequency coefficients are subjected to wavelet inverse reconstruction to obtain the denoised PD signal.
The flow chart is shown in Fig. 4.
|
Fig.4 Continuous adaptive wavelet threshold denoising method |
3 Simulation Analysis and Experimental Verification
In order to evaluate the denoising effect of continuous adaptive wavelet threshold denoising, firstly, this study simulate the signal through the widely recognized mathematical model of PD signals. At the same time, Gaussian white noise was added on the basis, and the continuous adaptive wavelet threshold denoising was used to denoise. The method performed noise reduction and compared it with the hard and soft threshold denoising methods widely used in PD signal denoising. Finally, the paper selects the signal-to-noise ratio (SNR) and root-mean-square error (RMSE) as the evaluation index of the denoising effect, defined as Eqs.(20) and (21). The higher the SNR of the signal after denoising, the smaller the RMSE of the standard signal, indicating that the closer the two values are, the better the denoising effect.
| $ \mathrm{SNR}=10 \cdot \lg \left(\frac{\sum\limits_{i=1}^n x^2(i)}{\sum\limits_{i=1}^n(x(i)-\hat{x}(i))^2}\right) $ | (20) |
| $ \mathrm{RMSE}=\sqrt{\frac{1}{n} \sum\limits_{i=1}^n(x(i)-\hat{x}(i))^2} $ | (21) |
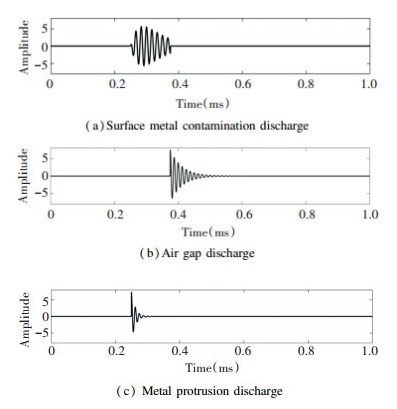
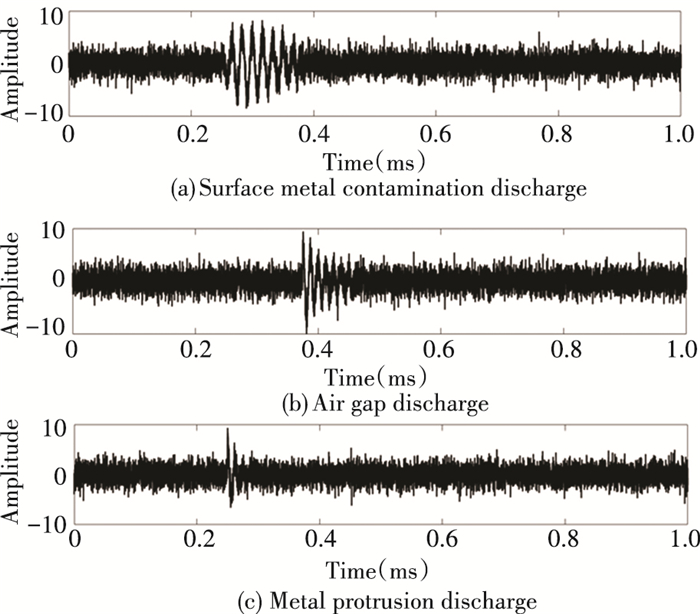
First, 3 kinds of PD simulation signals were selected for simulation analysis. The 3 types of PD simulation signals are air gap discharge, surface metal contamination discharge, and metal protrusion discharge signals. Set the sampling frequency of the signal models to 10 MHz. Each model contains 10000 sampling points, and the interval of each sampling point is 0.1 μs. The original signal waveform is shown in Fig. 5. After reading a large number of references, it is found that in reality, most of the PD white noise interference intensity is less than 2 dB. In order to verify the effectiveness of the algorithm, in this paper, Gaussian white noise with a SNR of 2 dB was added to the partial discharge signal, so that the original signal was completely annihilated in the white noise. Then MATLAB was used to randomly generate 200 groups of partial discharge signals of each type. The corresponding signal waveforms are shown in Fig. 6.
|
Fig.5 Original PD signal |
|
Fig.6 PD signal after adding noise |
Next, denoising and comparison of simulation signals were carried out. In order to perform denoising analysis of PD signals more accurately, and to conduct better analysis and research on subsequent recognition results, the appropriate number of wavelet function and wavelet decomposition levels must be firstly determined before denoising analysis of PD signals. The choice of the wavelet basis function has a certain impact on the denoising effect. The greater the correlation between the wavelet function and the signal, the better the denoising effect after decomposition. Therefore, this paper compares the denoising effects of the 4 different wavelet functions on the air gap discharge signal, the number of layers is decomposed to locate 4 layers. Table 1 is the SNR value obtained after denoising the signal using different wavelet functions. It can be seen from the SNR value of the experiment in Table 1 that the SNR value obtained by the Db function after denoising is relatively large, so this paper chooses the Db wavelet function for wavelet decomposition.
| Table 1 Influence of different wavelet basis functions on noise reduction |
At the same time, the number of decomposition layers of wavelet has a great impact on the denoising effect of wavelet. When the number of wavelet decomposition levels is too small, the denoising effect is generally not good. Therefore, this paper uses 3 decomposition layers as the starting decomposition layer to compare and determine the most optimal decomposition layer number. Table 2 shows the SNR value obtained after denoising the air gap discharge signal under different decomposition layer numbers. From the SNR value of the experiment in Table 2, it can be seen that the decomposition layer number is 4 layers after denoising and the SNR value is the largest, so the number of decomposition layers for denoising in this paper is determined to be 4 layers.
| Table 2 Influence of different decomposition layers on noise reduction |
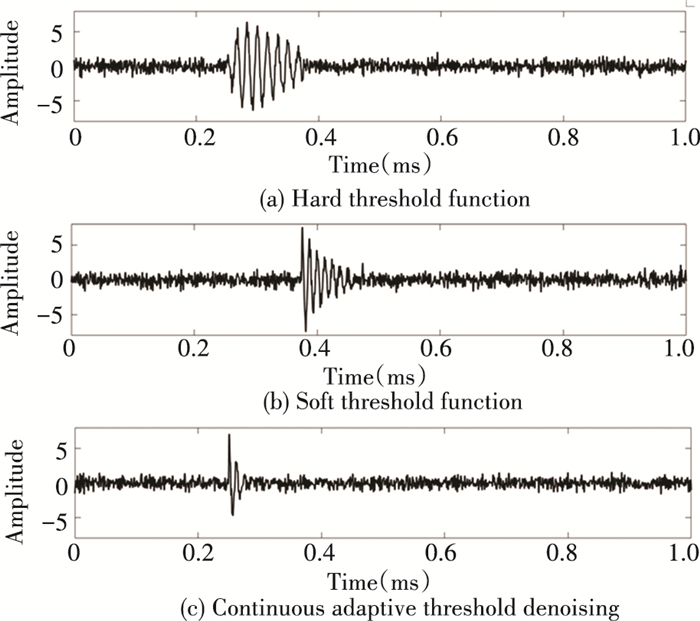
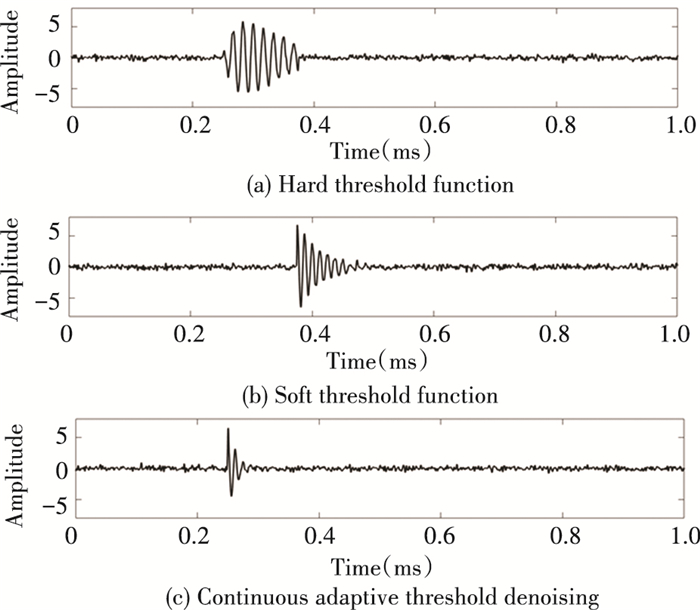
Next, the hard threshold function, soft threshold function and the continuous adaptive threshold denoising were used to denoise the simulated signals after noise addition. The denoising results are shown in Figs. 7, 8, 9, respectively.
|
Fig.7 PD signal after hard threshold denoising |

|
Fig.8 PD signal after soft threshold denoising |
|
Fig.9 PD signal after continuous adaptive threshold denoising |
Comparing the wavelet threshold denoising in Figs. 7, 8, 9, the hard threshold function and soft threshold function denoising method do not remove enough signal noise. The signal after denoising the method proposed in this paper not only retains the original signal well, but also remove the noise more thoroughly, which can better reflect the characteristics of the PD signal.
Table 3 calculates the evaluation indicators of PD signal denoising by each method. No matter what the air gap discharge, surface metal contamination discharge and metal protrusion discharge is, the SNR and RMSE of the method in this paper are better than the traditional threshold denoising algorithm, and the proposed algorithm is more suitable for the denoising of PD signals.
| Table 3 Evaluation index of each method after denoising PD signal |
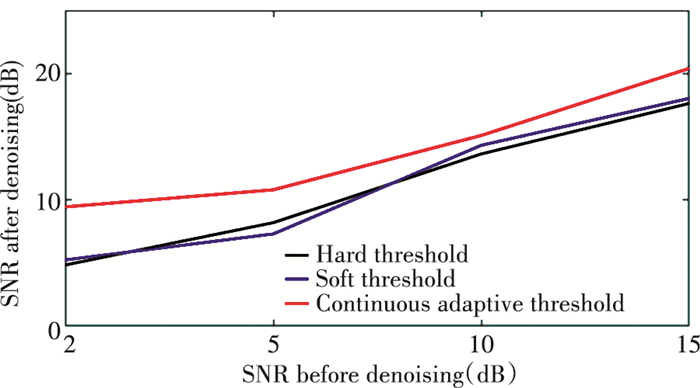
At the same time, in order to verify the universal applicability ofthe continuous adaptive wavelet threshold denoising algorithm, the denoising effect under different working conditions were simulated, the air gap discharge signal was added to the white noise with SNR of 5 dB, 10 dB and 15 dB, respectively. Fig. 10 compares the noise of different intensities to different denoising methods. Comparison result of the SNR value after denoising is shown in Fig. 10.
|
Fig.10 Comparison of noise denoising with different intensities |
It can be seen from Fig. 10 that under different noise intensities, the SNR values of the PD signals after the continuous adaptive wavelet threshold denoising proposed in this paper are all greater than the values after denoising the hard and soft thresholds. It indicates that the continuous adaptive wavelet threshold denoising can be applied to PD under various working conditions, which proves the universality of the method in this paper.
3.2 PD Classification Results AnalysisTo further verify the effectiveness of the noise reduction method in this paper, PNN was used to compare the effect of pattern recognition on the signals processed by different denoising methods. This paper extracts a total of 20 features of PD signals as the input features of PNN, which includes average value, effective value, peak value, crest factor, kurtosis, form factor, pulse factor, margin factor, average frequency, center of gravity frequency, frequency root mean square, frequency standard deviation, and sub-band wavelet energy ratio after 8 wavelet decomposition.
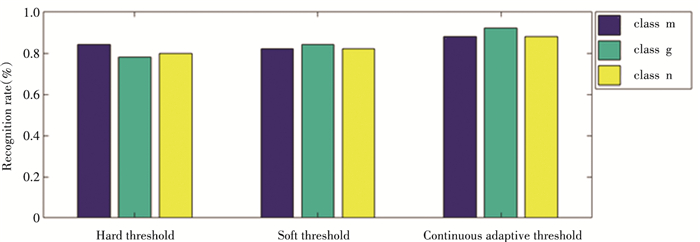
The characteristic parameters of the PD signals after denoising in the three methods were input into the PNN model for training and testing. Firstly, the signal feature vectors after different noise reduction methods were used as input, and 450 samples of surface metal pollution discharge, air gap discharge and metal protrusion discharge were selected and input into the network for training to build a pattern recognition model and classify and train until the best model parameters were found. Next, the 150 samples of test data was taken from three types of denoising to test the accuracy of PD pattern recognition for each type of samples. The comparison result is shown in Fig. 11 and the recognition results are shown in Table 4. After adopting continuous adaptive threshold to denoising, the recognition accuracy of partial discharge signals has been improved to a certain extent. Therefore, it shows that the denoising method in this paper has practical value in the field of partial discharge pattern recognition.
|
Fig.11 Comparison result |
| Table 4 Identification accuracy comparison |
3.3 Measured Signal Denoising Analysis
Acoustic emission sensor was used to measure a real PD signal. The signal contains a strong white noise signal, which is shown in Fig. 12.

|
Fig.12 Measured PD signal with white noise |
Using the hard threshold and soft threshold and the algorithm in this paper to reduce the noise of the measured PD signal, the denoising result is shown in Figs. 13, 14, 15. It can be seen that the hard threshold denoising result has a lot of impulse noise remaining, and it is difficult to achieve the optimal denoising. The soft threshold denoising cannot effectively remove noise, not only the residual white noise but also the loss of the PD signal. The PD signal denoised by the continuous adaptive threshold denoising method retains better details, which can well remove the interference of white noise and restore the PD signal better.

|
Fig.13 Hard threshold denoising |

|
Fig.14 Soft threshold denoising |

|
Fig.15 Continuous adaptive threshold denoising |
The measured PD signal cannot obtain a completely pure ideal PD signal, so denoising evaluation parameters such as SNR and RMSE are no longer suitable for the comparison of the effects of denoising methods here. This paper introduces the noise suppression ratio (NRR) to quantitatively evaluate the denoising effect. The larger the value of NRR, the better the denoising effect of the noise reduction method[24-25]. The specific definition of NRR is shown as follows:
| $ \mathrm{NRR}=10\left(\lg \delta_1^2-\lg \delta_2^2\right) $ | (22) |
In the equation, δ1 and δ2 are the standard deviations before and after signal noise reduction. After calculation, NRR=5.731 after denoising by wavelet hard threshold method, NRR=6.481 after denoising by wavelet soft threshold method and NRR=9.121 after denoising by the method in the paper, showing that the method can effectively remove the interference of white noise, so the method in this article has certain advantages in denoising.
4 ConclusionsIn the PD signal processing of the switchgear, the denoising effect of the PD signal plays an important role in the feature extraction of the PD signal. The continuous adaptive threshold function constructed in this paper not only overcome the shortcomings of the traditional threshold function, but also adjust the parameters adaptively according to the signal characteristics of each wavelet decomposition layer, change the threshold function, and further improve the denoising effect. The denoising experiments of simulated and measured signals show that the continuous adaptive threshold denoising method is significantly better than the traditional hard threshold and soft threshold denoising methods. It can effectively retain fault information and reduce noise at the same time, and realize the separation of signal and noise. In addition, the continuous adaptive threshold denoising method can improve the pattern recognition rate of PD signals to a certain extent, and prove the effectiveness of the continuous adaptive wavelet threshold denoising method.
| [1] |
Hussain G A, Kumpulainen L, Kluss J V, et al. The smart solution for the prediction of slowly developing electrical faults in MV switchgear using partial discharge measurements. IEEE Transactions on Power Delivery, 2013, 28(4): 2309-2316. DOI:10.1109/TPWRD.2013.2266440 (  0) 0) |
| [2] |
Hu MY, Hu Z J, Wang X, et al. Reliability evaluation of distribution network taking switch faults into account based on bidirectional hierarchical structure. Power System Technology, 2016, 40(5): 1476-1481. DOI:10.13335/j.1000-3673.pst.2016.05.027 (  0) 0) |
| [3] |
Li YX, Wang T Z, Jin T, et al. Detection and analysis of high voltage switchgear internal partial discharge based on multiple detection technology. Gaoya Dianqi/High Voltage Apparatus, 2017, 53(1): 45-50. DOI:10.13296/j.1001-1609.hva.2017.01.008 (  0) 0) |
| [4] |
Ye Y, Yong Q, Liang C, et al. Anonline monitoring terminal for partial discharge of switch cabinets based on TEV method. Electrical Automation, 2017, 39(4): 115-118. (in Chinese) (  0) 0) |
| [5] |
Xu W D, Zhou W W, Peng D, et al. Pattern recognition of partial discharge in solid insulated switchgear based on ASVDD algorithm. Electrical & Energy Management Technology, 2018, 13: 19-25. DOI:10.16628/j.cnki.2095-8188.2018.13.004 (  0) 0) |
| [6] |
Renforth L A, Giussani R, Mendiola M T, et al. Online partial discharge insulation condition monitoring of complete high-voltage networks. IEEE Transactions on Industry Applications, 2019, 55(1): 1021-1029. DOI:10.1109/TIA.2018.2866983 (  0) 0) |
| [7] |
Li Q Q, Qin B Y, Si W, et al. Estimation algorithm for adaptive threshold of hybrid particle swarm optimization wavelet and its application in partial discharge signals de-noising. High Voltage Engineering, 2017, 45(3): 1485-1492. DOI:10.13336/j.1003-6520.hve.20170428013 (  0) 0) |
| [8] |
Jahangir H, Hajipour E, Vakilian M, et al. A method to capture and de-noising partial discharge pulses using discrete wavelet transform and ANFIS. International Transactions on Electrical Energy Systems, 2016, 25(11): 2696-2712. DOI:10.1002/etep.1986 (  0) 0) |
| [9] |
Sun Z H, Feng J L, Ouyang L, et al. Research on anti-interference methods of switchgear ultrasonic PD detection. 2016, 36(2): 46-49. DOI: 10.3969/j.issn.1008-0198.2016.02.011
(  0) 0) |
| [10] |
Ye H S, Chen X L, Zhou T, et al. Application of white-noise suppression in gas insulated switchgear partial discharge monitoring based on lifting dual-tree complex Wavelet transform. High Voltage Engineering, 2017, 43(3): 851-858. DOI:10.13336/j.1003-6520.hve.20170303022 (  0) 0) |
| [11] |
Liu Z K, Ding X Z, Chen F M, et al. Application of wavelet de-noising in fault detection of MV switchgear. Power System Technology, 2017, 41(9): 3090-3094. DOI:10.13335/j.1000-3673.pst.2016.2554 (  0) 0) |
| [12] |
Altay Ö, Kalenderli Ö. Wavelet base selection for de-noising and extraction of partial discharge pulses in noisy environment. Science Measurement & Technology IET, 2014, 9(3): 276-284. DOI:10.1049/iet-smt.2013.0114 (  0) 0) |
| [13] |
Lu G J, Wang Y, Luan L, et al. Suppressing white noise in PD signal based on wavelet entropy and improved threshold function. Proceedings of the IEEE 2017 IEEE 11th International Symposium on Diagnostics for Electrical Machines, Power Electronics and Drives (SDEMPED). Piscataway: IEEE, 2017.475-479. DOI: 10.1109/DEMPED.2017.8062397.
(  0) 0) |
| [14] |
Li M Z, Wang Z Q, Luo J, et al. Wavelet denoising of vehicle platform vibration signal based on threshold neural network. Shock and Vibration, 2017, 2017(2): 7962828-7962828(1). DOI:10.1155/2017/7962828 (  0) 0) |
| [15] |
Donoho D L, Johnstone I M. Adapting to unknown smoothness via wavelet shrinkage. Journal of the American Statiscal Association, 1995, 90(432): 1200-1224. DOI:10.1080/01621459.1995.10476626 (  0) 0) |
| [16] |
Yang H X, Wang X S, Xie P P, et al. Infrared image denoising based on improved threshold and inter-scale correlations of wavelet transform. Acta Automatica Sinica, 2011, 37(10): 1167-1174. DOI:10.3724/SP.J.1004.2011.01167 (  0) 0) |
| [17] |
He Y S, Liu C, Xu Z M, et al. Combined wavelet denoising for vehicle braking noise signal based on both soft threshold and genetic algorithm-based adaptive threshold. Automotive Engineering, 2014, 36(6): 703-708. DOI:10.19562/j.chinasae.qcgc.2014.06.013 (  0) 0) |
| [18] |
Li H Y, Zhou Y L, Tian F, et al. Wavelet-based vibration signal de-noising algorithm with a new adaptive threshold function. Chinese Journal of Scientific Instrument, 2015, 36(10): 2200-2206. DOI:10.19650/j.cnki.cjsi.2015.10.006 (  0) 0) |
| [19] |
Long J C, Wang X P, Dai D D, et al. Denoising of UHF PD signals based on optimised VMD and wavelet transform. IET Science Measurement & Technology, 2017, 11(6): 753-760. DOI:10.1049/iet-smt.2016.0510 (  0) 0) |
| [20] |
Hussein R, Shaban K B, El-Hag A H. Energy conservation-based thresholding for effective wavelet denoising of partial discharge signals. IET Science Measurement and Technology, 2016, 10(7): 813-822. DOI:10.1049/iet-smt.2016.0168 (  0) 0) |
| [21] |
Vargas R N, Veiga A C P. Seismic trace noise reduction by wavelets and double threshold estimation. IET Signal Processing, 2018, 11(9): 1069-1075. DOI:10.1049/iet-spr.2017.0061 (  0) 0) |
| [22] |
Wei Q, Cui H B, Xie Y G, et al. A study on feature extraction and recognition of fatigue crack AE signals of oil and gas pipelines in offshore platforms. Journal of Vibration and Shock, 2021, 40(8): 70-78. DOI:10.13465/j.cnki.jvs.2021.08.009 (  0) 0) |
| [23] |
Jiang Y X, Zhao X H, Deng Y W. Fault diagnosis of electronic throttle pedal based on probabilistic neural network. Journal of Central South University (Science and Technology), 2019, 50(6): 1370-1377. DOI:10.11817/j.issn.1672-7207.2019.06.015 (  0) 0) |
| [24] |
Zhang M N, Li C M, Liu K, et al. Noise reduction optimization of partial discharge signal based ongeneralized S transform and singular value decomposition. Power System Technology, 2021, 45(8): 3305-3313. DOI:10.13335/j.1000-3673.pst.2020.0940 (  0) 0) |
| [25] |
Niu H Q, Song T H, Luo X, et al. Partial discharge signal denoising method based on S-transform and singular value decomposition. Journal of South China University of Technology (Natural Science Edition), 2020, 48(2): 9-15. DOI:10.12141/j.issn.1000-565X.190328 (  0) 0) |
 2022, Vol. 29


