2. Department of Computer Science and Engineering, Anil Neerukonda Institute of Technology and Sciences, Vishakhapatnam 531162, Andhra Pradesh, India
This study investigates different machine learning (ML) methods utilized for heart disease detection. Heart is the primary organ of every living being. Any heart functional issue has direct effects on human survival, since it impacts on organs like cerebrum, lungs, urinary tract, liver, etc. Heart diseases depict the scope of conditions that influences the heart and remain a main cause of human death.
Heart diseases occur due to improper habits like smoking and drinking, and also due to such diseases as hypertension which results in a high level of cholesterol[1]. According to the WHO, every year 10 million people die of heart diseases in the world. In order to assist the early detection of heart diseases and reduce the deaths caused by such diseases, this study reviews and evaluates the machine learning (ML) approaches applied in heart disease detection, which includes Logistic Regression, Support Vector Machine (SVM), k-Nearest Neighbor (k-NN), t-Distributed Stochastic Neighbor Embedding (t-SNE), Naïve Bayes, and Random Forest. The results show that Random Forest had the best performance with an accuracy of 97%, which is higher than other algorithms.
Data mining and neural network approaches are utilized to detect heart diseases. The intensity of the disease is characterized by using ML methods including k-NN, Decision Trees, Genetic Algorithm, and Naïve Bayes[2-3].
The primary challenges in current medical care industry are the arrangement of the best quality administration and accurate diagnosis[3]. In recent years, the death rate has been increased mostly because of heart failures, thus it is critical to consider the factors leading to such diseases.
The goal of this study is to investigate if the patients' medical data can indicate their likelihood of being diagnosed with any heart disorders. After applying the feature selection procedure, 14 features were taken from the dataset to predict whether or not they contribute to heart diseases. The attributes were trained using six algorithms: Logistic Regression, SVM, k-NN, t-SNE, Naïve Bayes, and Random Forest. Their accuracy score, precision score, recall score, and F1 score were compared. Random Forest produced the highest accuracy of 97%. It is thus concluded that this approach can cost-effectively predict heart diseases.
The remaining part of this paper is arranged as follows. Related literature is reviewed in Section 1. Methodology is discussed in Section 2. Dataset evaluation and the experimental setup are examined in Section 3, and Section 4 concludes this paper and gives suggestions for future work.
1 Literature SurveyMohan et al.[1] proposed a new model called Hybrid Random Forest with a Linear Model (HRFLM) which exhibits appropriate features using ML methodologies and improves the accuracy of cardiovascular disease detection. This newly developed model provides better accuracy.
Golande and Kumar[4] conducted a study on the accuracy of various ML techniques to process medical disease datasets to identify heart disease. This study finds that the accuracy can be increased by combining various techniques with various tuning attributes.
Alotaibi[5] worked on five different ML classifiers. Rapid Miner Studio produced higher accuracy compared with Matlab and Weka. Among all classification techniques, Decision Trees generated the highest accuracy.
Nagamani et al.[6] worked on the data mining approach Map Reduce Algorithm. Their study shows that working on the medical repository with 45 records on a test set, Map Reduce produced higher accuracy than a conventional fuzzy artificial neural network did. Because of its employment of dynamic schema and linear transformation, this method has a high accuracy of heart disease identification.
Aslandogan and Mahajani[7] used Dempsters' rule which combines three classifiers, k-NN, Decision Trees, and Naïve Bayes to make final decision. The combined classifier produced higher accuracy than other individual classifier.
Rajdhan et al.[8] studied different approaches to identify cardiovascular diseases. In order to calculate the risk level of a patient's disease, a model was implemented using several data mining approaches including Naïve Bayes, Decision Trees, Logistic Regression, and Random Forest. They conducted a comparative analysis of various algorithms based on their performance. Compared with other algorithms, Random Forest produced a more accurate result.
Jindal et al.[9] employed a variety of ML models including Logistic Regression and k-NN. Compared with previously utilized classifiers such as Naïve Bayes and others, the adopted methods showed better accuracy. The proposed system not only facilitates medical treatment but also lowers costs. k-NN algorithm had the highest accuracy of 88.52%.
Revi et al.[10] studied different ML classification algorithms such as Naïve Bayes, Decision Trees, and k-Mean. Among them, Naïve Bayes produced more accurate results on smaller dataset, whereas the other algorithms such as Decision Trees performed better on bulk data datasets.
Latha and Jeeva[11] implemented an ensemble classification method which combines various base models to make the best predictive model. It produces higher accuracy from weak algorithms. The research was conducted not only to improve prediction accuracy, but also to demonstrate how the suggested algorithm can be used to predict diseases at an early stage. The weak classifier accuracy was increased 7% compared with previous result. Only by using ensemble classification can this be achieved.
Shorewala[12] used a risk factor strategy to predict coronary heart disease. Comparison among k-NN, Binary Logistic Classification, and Naïve Bayes was undertaken and they were validated as k-Fold. Ensemble approaches like bagging, boosting, and stacking were applied for better accuracy to k-NN, Random Forest, hybrid models, and SVM. SVM was proved to be the most efficient technique to predict the disease with an accuracy of 75.1%.
Ali et al.[13] proposed a hybrid deep learning model and added feature fusion approaches to predict diseases. The performance of the model was improved by including the conditional probability that works out with weights which must be unique for each class. The proposed method uses heart disease dataset with feature extraction techniques like feature fusion, feature selection, and weighting algorithms. It is compared with traditional classifiers and results show that it outperformed other existing system in terms of accuracy. The hybrid model attained an accuracy of 98.5%, which is higher than previously tested models.
Garg et al.[14]utilized k-NN and Random Forest to forecast heart diseases. Scrubbing and pre-processing procedure were applied to data and only necessary features were given to predict the disease. A correlation was observed between selected features and its impact on the target output. The medical data sample was split into two parts in 80∶20 ratio, the former part is for training and the latter for testing. The target attribute was found to have a positive relationship with features called chest pain and the maximum heart rate. With k-NN, this model had an accuracy of 86.885%, while with Random Forest, the accuracy was 81.967%.
Pandita et al.[15] created a prediction model that incorporates five artificial intelligence techniques and employed the technique with the greatest accuracy to create a web-based framework. The framework needs patients' medical information as an input and provides output as predicted class label value (YES/NO) which identifies disease. Front end can be developed using HTML/CSS and Flask python standard library was used to create application. k-NN had the highest accuracy of 89.06%, while Logistic Regression had the lowest accuracy of 84.38%.
Razia et al.[16] suggested a web-based algorithm to diagnose heart diseases. Random Forest and k-NN were used in this study. The medical data was acquired from a heart hospital. After scrubbing and pre-processing, feature selection was applied to get attributes. Random Forest and k-NN had an accuracy of 100% and 91.36% respectively in disease detection. The ensemble model also provided better prediction accuracy of 98.77% and 95.06% respectively when using and not using Logistic Regression.
Akella and Akella[17] investigated six predictive models, including Decision Trees, Random Forest, SVM, k-NN, Generalized Linear Model, and Neural Network on coronary heart data records. Neural Networks obtained a higher accuracy of 93.03% and a sensitivity of 93.8%, indicating that there are fewer chances of getting false negative values in performance metrics and it is thus a highly precise result, while the others had an accuracy of 80% and above.
Ravindhar et al.[18] studied ML classification strategies such as Logistic Regression, Naïve Bayes, Fuzzy k-NN, k-Means Clustering, and back propagation Neural-Network. In the experimental investigation of heart conditions, a 10-fold cross validation procedure was performed. Back propagation Neural Networks provided the highest accuracy, with an accuracy of 98.2%, a recall score of 87.64%, and a precision score of 89.65%, while the other methods such as Fuzzy k-NN and Logistic Regression had the performance metrics of 80% and above.
Zhang et al.[19] developed a new strategy incorporating deep neural networks with feature selection. Linear SVC algorithm was used to identify features, which selects a subset of features strongly linked with heart diseases. The outliers in the dataset were successfully removed and all data were normalized using the IQR approach, resulting in dependable input. The chosen features were then sent to create deep neural network. The proposed method yielded performance measures of 98.56% (recall), 99.35% (precision), 97.84% (F1-score), and 98.3% (accuracy), indicating that the embedded method is effective and trustworthy in predicting heart diseases.
Goel[20] provided a methodology that necessitates the use of a variety of ML algorithms. The analysis was carried out utilizing a confusion matrix and other ML techniques after training and testing. In this study, the accuracy of each algorithm was compared, and SVM was shown to be the best with an accuracy of 86%.
Salhi et al.[21] carried out various data analytics approaches to predict disease. After pre-processing phase, the correlation matrix was used to select the 13 most relevant features, whereby the set was partitioned into 80% and 20% parts, and then three data analytics techniques, namely, neural networks, SVM, and k-NN, were applied to patient records of various sizes to determine whether the patient has heart disease or not based on the target label. Neural networks were easy to configure and produced substantially better results, according to performance measurements (accuracy of 93%).
Table 1 summarizes the literature demonstrating the role of ML in heart disease detection.
| Table 1 Summary of the literature demonstrating the role of ML in heart disease detection |
According to the literature review, the most commonly used algorithms for heart disease prediction are k-NN, Naïve Bayes, Logistic Regression, SVM, and Random Forest. The statistical analysis is given in Table 2. These algorithms have been implemented into this research for the purpose of testing.
| Table 2 Statistical analysis for ML algorithms |
2 Methodology
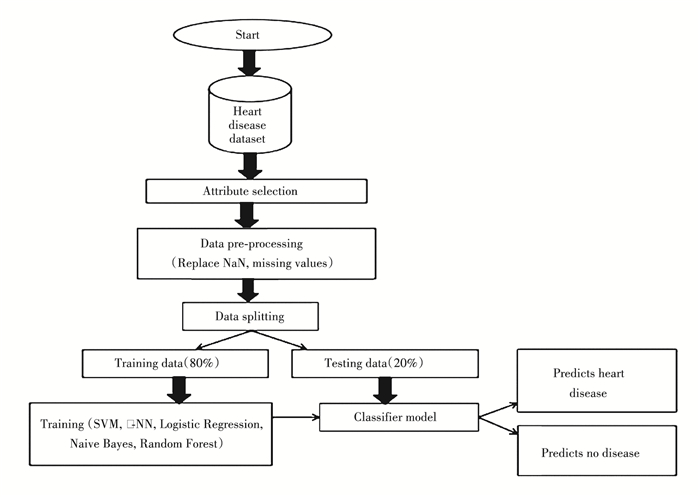
The proposed methodology is a step-by-step process that converts raw data into recognizable data patterns for users to understand. The goal of this study is to accurately predict whether or not the patient has heart diseases. The input values from the patients' health report were entered by the health professional. The information was incorporated into a model that forecasts the patients' likelihood of developing heart disease. The process is illustrated in Fig. 1.
|
Fig.1 The process from data cleaning to prediction |
2.1 Process of Heart Disease Prediction
The steps involved in the process of heart disease prediction is as follows:
Step 1 Data collection.
Data collection refers to the process of information gathering. Dataset is a collection of data in a certain format for a specific problem.
Step 2 Pre-processing.
In this phase, the data is further explored.
The dataset contained noisy data, which is modified, without values, or with useless formats thus cannot be utilized directly in ML algorithms. Noisy data also includes NaN values. Because algorithms cannot process NaN values, these values must be converted into numerical values. In order to replace NaN values, the mean of the column was calculated and was substituted. This step was the most essential for data cleaning.
Step 3 Splitting.
In this phase, significant values were extracted.
Pre-processed chosen dataset was divided into two parts to be processed. 80% of the data were trained and 20% of the data were tested. It is important to perform data since it improves the performance of our model in terms of accuracy.
Step 4 Classification.
In this phase, data was trained and classified into new categories. The data mining technique aided in classifying the data into several categories. After data cleaning and splitting, ML algorithms such as SVM, t-SNE, k-NN, Logistic Regression, and Naïve Bayes were applied to training the data.
SVM, t-SNE, k-NN, Logistic Regression, Naïve Bayes, and Random Forest were utilized to predict the disease. These algorithms help medical analysts effectively detect heart diseases.
2.2 ML Classification AlgorithmsML classification algorithms can be divided into two categories: linear and non-linear. The linear algorithms include Logistic Regression and SVM; the non-linear algorithms include k-NN, t-SNE, Naïve Bayes, and Random Forest.
2.1.1 Logistic RegressionMost binary classification problems are solved by Logistic Regression. The categorical features which are dependent from a predicted set of variables are independent. Examples of numeric or categorical data are Yes/No, 0/1, true/false. It resolves binary problems and provides probability values from the range between 0 to 1 rather than providing exact numbers like 0 and 1.
Logistic Regression applies a function, namely, logistic, instead of placing hyper-plane or a linear line to place the linear equation output between 0 and 1. The chosen dataset had 13 independent variables, and Logistic Regression was the correct choice.
The following steps are used to obtain the regression of logistic equations:
1) The linear line equation is
| $ y=b_0+b_1 x_1+b_2 x_2+b_3 x_3+\ldots \ldots \ldots+b_n x_n $ | (1) |
2) The variable y is Logistic Regression between 0 and 1.
| $ \frac{y}{1-y} ; 0 \text { for } y=0 \text {, and infinity for } y=1 $ | (2) |
3) The range should be between -[∞] and +[∞]. In order to get infinity, the below logarithm is used:
| $ \log \left[\frac{y}{1-y}\right]=b_0+b_1 x_1+b_2 x_2+b_3 x_3+\ldots \ldots \ldots+b_n x_n $ | (3) |
SVM divides the data in a dataset into various groups in dimensional space with labels. If any extra data are added, they can be categorized to respective groups based on labels. The groups were split by a line called optimum line and also by boundary lines for making decisions. The division boundary line is a hyper-plane of the optimum line. As many optimum lines as necessary can be drawn, but among those only one will be used to split the data groups. In a data space, the boundary line was the widest path between two groups.
The nearest points to that line which help to design the hyper-plane were selected using SVM. The name of "Support Vector Machine" (SVM) comes from the fact that support vectors are utmost samples of the line. The closure points of the hyper-plane boundaries were referred to as support vectors.
2.1.3 k-NNk-NN is one of the most basic classification methods. It classifies new data points based on previous ones. The learning process of k-NN does not take previously trained data, rather it reserves the dataset and takes action on it. That is why it is called lazy learning.
k-NN is used to choose the correct location for the trained dataset. It can be found how close each data point in the trained dataset is to the newly observed data point using the Euclidean distance formula. After computing the distance between points, the grade was assigned as 1 to which the point is within the shortest distance, and it will be regarded as the closest neighbor k.
The work flow of k-NN is as follows:
Step 1 Choose the number k value among the neighbors;
Step 2 Determine the Euclidean distance between k neighbors;
Step 3 Use the obtained Euclidean distance, and find the k closest neighbors;
Step 4 Count the number of data points in each category among these k neighbors;
Step 5 Assign the new data points to the category with the greatest number of neighbors;
Step 6 The model is complete.
2.1.4 t-SNEt-SNE is a dimensionality reduction approach for high-dimensional datasets and is also utilized for visualization. Stochastic variance is a type of variance used to identify neighboring points in a cluster. The t-SNE package includes T-Distribution, stochastic variance, and neighboring points. t-SNE is helpful in avoiding overlapping in reducing 2-D plane to 1-D plane clustering points. t-SNE technique calculates a similarity measure between pairs of instances in high and low dimensional space. It then uses a cost function to try to maximize these two similarity measures. All of the C-F non-bonding energies of Per- and Polyfluoroalkyl Substances (PFAS) were clustered using t-SNE[22].
2.1.5 Naïve BayesThe Naïve Bayes used Bayes theorem to solve classification problems. It produces predictions depending upon the probability of each instance. That is why it is called probabilistic classifier. It is simple, quick, and precise and works with excellency when it maintains assumptions independently.
The mathematical equation for Bayes theorem evaluates probability by Bayes' Rule which gives prior information about the hypothesis, which is conditional probability.
The posterior probability of an event (A)is calculated by Bayes theorem, which provides a probability of an event (B), presented as P(A/B)[10]:
| $ {\rm{P}}({\rm{A}}|{\rm{B}}) = ({\rm{P}}({\rm{B}}|{\rm{A}}) \cdot {\rm{P}}({\rm{A}}))/{\rm{P}}({\rm{B}}) $ | (4) |
where a posterior probability (P(A|B)) is the probability of hypothesis "A" on the observed event "B"; P(B|A) is a likelihood probability: a probability of the evidence given that the probability of a hypothesis is true; P(A) is a prior probability of a hypothesis before seeing the evidence; P(B) is a marginal probability: a probability of evidence.
2.1.6 Random ForestRandom Forest is used for both classification and regression. It is in the form of tree structure, by which it produces predictions. This is the best approach to generate the same results, even when a large number of records are missing. The samples produced by the Decision Trees could be applied to additional data. Random Forest works in two phases: in the first phase, it generates a tree, and in the second, it utilizes classifier to predict on the tree produced in the previous phase.
3 ExperimentationThe information about heart diseases taken from the Kaggle was used in this experiment. The collection has 14 attributes, each of which has a set of values with 303 instances. The cleaned data were given as input into the proposed methodology. Instances were reduced to 297 after the cleaning process. The dataset is described as follows in Table 3.
| Table 3 Dataset description for heart diseases |
The implementation was done in a"jupyter-notebook" using python. After uploading and data cleaning, the data were separated into two categories: input and target. The input data were trained by the six ML algorithms listed above. To achieve the goal, all 14 features were considered. To improve the accuracy of disease prediction, k-NN, t-SNE, Random Forest, Logistic Regression, Naïve Bayes, and SVM algorithms were used. When compared with other methods, Naïve Bayes and Random Forest produced the highest accuracy.
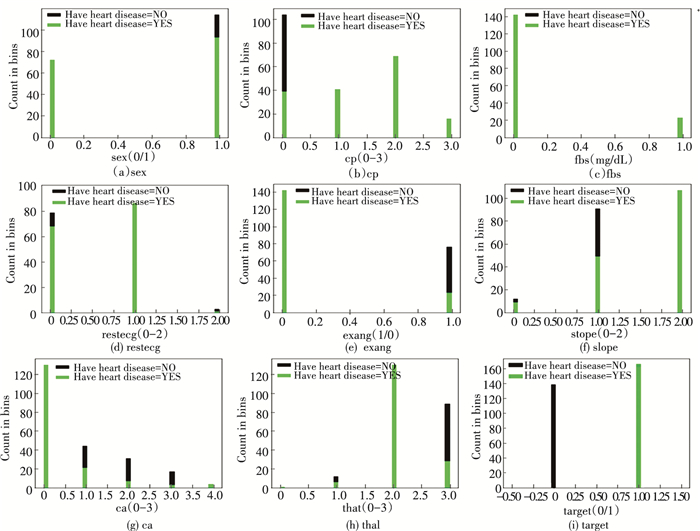
Fig. 2 and Fig. 3 show how basic data and statistics can be easily displayed using a histogram plot. The target column, which has an equal distribution of categories and continuous data, was utilized to determine if the patient had disease or not.
|
Fig.2 Histograms of features'sex', 'cp', 'fbs', 'restecg', 'exang', 'slope', 'ca', 'thal', and 'target' |

|
Fig.3 Histograms of features'age', 'trestbps', 'chol', 'thalach', 'oldpeak' |
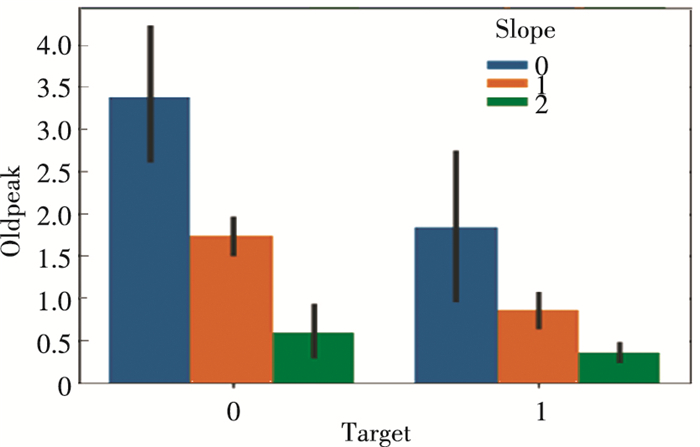
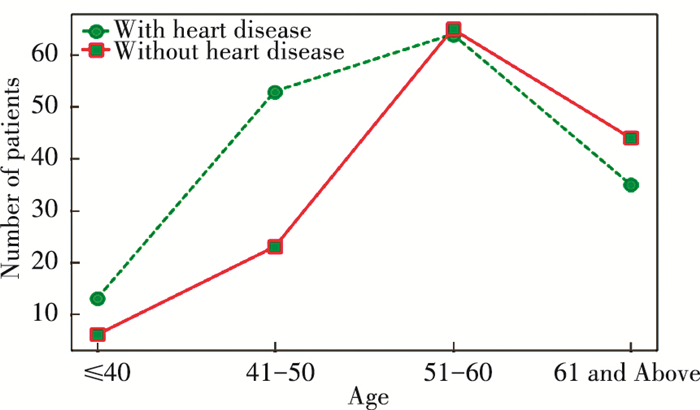
The fundamental statistics of data utilizes a cat plot, a subplot that equalizes categorical data distribution. The depression (slope) under the initial point in a cat plot is shorter than usual, which can contribute to heart diseases. This demonstrates that strong Shock Toxicity (ST) depression is regarded healthy and normal. In Fig. 4, slope represents the peak exercise for ST segment. The target attribute in horizontal axis has two values 0 and 1. 0 predicts there is no disease and 1 predicts there is disease. 0, 1, 2 are the feature values of slope, where 0 indicates down slope, 1 indicates flat, and 2 indicates up slope. The low ST depression is associated with a higher risk of heart diseases. By applying an age-based subplot, it was found that patients above the age of 45 are more likely to be affected by the disease, as shown in Fig. 5.
|
Fig.4 People with no heart disease based on ST depression |
|
Fig.5 Relationship between people with and without heart disease and their age |
The correlation matrix is as follows:
All values of matrix lies between -1 and +1. -1 indicates negative correlations, +1 indicates positive correlations. Fig. 6 shows the correlation between every two variables. 3 cases are adopted to observe the relationship between two variables.

|
Fig.6 Correlation between every two variables |
Case 1 If two feature values are +1, it indicates increase or decrease together in the diagonal of a matrix.
Case 2 If any one of the feature value is negative, correlation will increase and the other will decrease.
Case 3 If the feature value is near 0, this indicates that there is no relation between two variables.
The confusion matrix is as follows. It is another strategy to express the algorithm's classification measures on data (Fig. 7).

|
Fig.7 Confusion matrix for heart disease prediction |
1) True Positives (TP): This value predicts"yes" if the patient has disease.
2) True Negatives (TN): This value predicts "no" if the patient does not have the disease.
3) False Positives (FP): This value predicts "yes" even patient does not have the disease.
4) False Negatives (FN): This value predicts "no" even a patient has the disease.
Table 4 shows the accuracy score, precision score, recall score, and F1 score of the six algorithms used in this research. Each score represents the following meaning, respectively:
| Table 4 Comparison of different algorithms |
1) Accuracy Score: It refers to the percentage of values identified as correct.
2) Precision Score: It indicates how many of the predicted positive numbers are truly positive.
3) Recall Score: It considers how many of the original positive numbers have been properly defined.
4) F1 Score: It is the mean of precision and recall values. It is essential if both precision and recall values are important for the task.
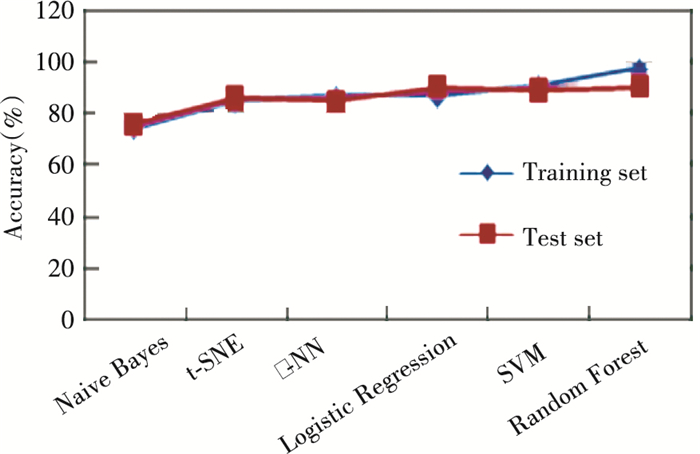
After the analysis of the prior findings, it is found that Random Forest is the best algorithm since its findings are consistent and it provides the highest accuracy, as is shown in Table 4 and Fig. 8.
|
Fig.8 Line graph of accuracy of the algorithms |
4 Conclusions
The objective of this research is to find the most powerful system for detecting heart diseases. SVM, t-SNE, k-NN, Logistic Regression, Random Forest, and Naïve Bayes were used to process heart disease dataset available in Kaggle to predict patient's disease. According to the analysis, Random Forest was the most powerful algorithm to detect disease in patients, which produced an accuracy of 97%. This research can be improved in the future by creating an web application using Random Forest to work with a larger dataset, which would be helpful for health specialists to accurately and efficiently predict heart diseases.
| [1] |
Mohan S, Thirumalai C, Srivastava C. Effective heart disease prediction using hybrid machine learning techniques. IEEE Access, 2019, 7: 81542-81554. DOI:10.1109/ACCESS.2019.2923707 (  0) 0) |
| [2] |
Durairaj M, Revathi V. Prediction of heart disease using back propagation MLP algorithm. International Journal of Scientific and Technology Research, 2015, 4(8): 235-239. (  0) 0) |
| [3] |
Gavhane A, Kokkula G, Pandya I, et al. Prediction of heart disease using machine learning. Proceedings of the 2018 Second International Conference on Electronics, Communication and Aerospace Technology (ICECA). Piscataway: IEEE, 2018. 1275-1278. DOI: 10.1109/ICECA.2018.8474922.
(  0) 0) |
| [4] |
Golande A, Kumar T P. Heart disease prediction using effective machine learning techniques. International Journal of Recent Technology and Engineering, 2019, 8(S1): 944-950. (  0) 0) |
| [5] |
Alotaibi F S. Implementation of machine learning model to predict heart failure disease. International Journal of Advanced Computer Science and Applications, 2019, 10(6): 261-268. DOI:10.14569/IJACSA.2019.0100637 (  0) 0) |
| [6] |
Nagamani T, Logeswari S, Gomathy B. Heart disease prediction using data mining with mapreduce algorithm. International Journal of Innovative Technology and Exploring Engineering, 2019, 8(3): 137-140. (  0) 0) |
| [7] |
Aslandoganet Y A, Mahajani G A. Evidence combination in medical data mining. Proceedings of the International Conference on Information Technology: Coding and Computing, 2004. Piscataway: IEEE, 2004. 8117280. DOI: 10.1109/ITCC.2004.1286697.
(  0) 0) |
| [8] |
Rajdhan A, Sai M, Agarwal A, et al. Heart disease prediction using machine learning. Inernational Journal of Engineering Research and Technology, 2020, 9(4): 659-662. (  0) 0) |
| [9] |
Jindal H, Agrawal S, Khera R, et al. Heart disease prediction using machine learning algorithms. IOP Conference Series: Materials Science and Engineering, 2021, 1022: 012072. DOI:10.1088/1757-899X/1022/1/012072 (  0) 0) |
| [10] |
Revi S, Sambath M, Thangakumar J, et al. Prediction of heart disease using machine learning algorithms. International Journal of Engineering & Technology, 2021, 36(1): 260-264. DOI:10.47059/alinteri/V36I1/AJAS21039 (  0) 0) |
| [11] |
Latha C B C, Jeeva S C. Improving the accuracy of prediction of heart disease risk based on ensemble classification techniques. Informatics in Medicine Unlocked, 2019, 16: 100203. DOI:10.1016/j.imu.2019.100203 (  0) 0) |
| [12] |
Shorewala V. Early detection of coronary heart disease using ensemble techniques. Informatics in Medicine Unlocked, 2021, 26: 100655. DOI:10.1016/j.imu.2021.100655 (  0) 0) |
| [13] |
Ali F, El-Sappagh S, Riazul Islam S M, et al. A smart healthcare monitoring system for heart disease prediction based on ensemble deep learning and feature fusion. Information Fusion, 2020, 63: 208-222. DOI:10.1016/j.inffus.2020.06.008 (  0) 0) |
| [14] |
Garg A, Sharma B, Khan R, et al. Heart disease prediction using machine learning techniques. IOP Conference Series: Materials Science and Engineering, 2021, 1022: 012046. DOI:10.1088/1757-899X/1022/1/012046 (  0) 0) |
| [15] |
Pandita1 A, Vashisht S, Tyagi A, et al. Prediction of heart disease using machine learning algorithms. International Journal for Research in Applied Science and Engineering Technology, 2021, 9(V): 2422-2429. DOI:10.22214/ijraset.2021.3412 (  0) 0) |
| [16] |
Razia S, Babu J C, Baradwaj K H, et al. Heart disease prediction using machine learning. International Journal of Recent Technology and Engineering, 2019, 8(4): 10316-10320. DOI:10.35940/ijrte.D4537.118419 (  0) 0) |
| [17] |
Akella A, Akella S. Machine learning algorithms for predicting coronary artery disease: efforts toward an open source solution. Future Science OA, 2021, 7(6): FSO698. DOI:10.2144/fsoa-2020-0206 (  0) 0) |
| [18] |
Ravindhar N V, Anand H S, Ragavendran G W, et al. Intelligent diagnosis of cardiac disease prediction using machine learning. International Journal of Innovative Technology and Exploring Engineering, 2019, 8(11): 1417-1421. DOI:10.35940/ijitee.J9765.0981119 (  0) 0) |
| [19] |
Zhang D Q, Chen Y Y, Chen Y X, et al. Heart disease prediction based on the embedded feature selection method and deep neural network. Journal of Healthcare Engineering, 2021, 2021: 6260022. DOI:10.1155/2021/6260022 (  0) 0) |
| [20] |
Goel R. Heart disease prediction using various algorithms of machine learning. Proceedings of the International Conference on Innovative Computing and Communication. Singapore: Springer, 2021. 1-5. DOI: 10.2139/ssrn.3884968.
(  0) 0) |
| [21] |
Salhi D E, Tari A A K, Kechadi M-T. Using Machine Learning for Heart Disease Prediction. https://www.researchgate.net/publication/349470771.
(  0) 0) |
| [22] |
Raza A, Bardhan S, Xu L H, et al. A machine learning approach for predicting defluorination of per- and polyfluoroalkyl substances (PFAS) for their efficient treatment and removal. Environmental Science and Technology Letters, 2019, 6(10): 624-629. DOI:10.1021/acs.estlett.9b00476 (  0) 0) |
 2022, Vol. 29


