 2023, Vol. 30


Centrifugal pumps (CPs) belong to the family of turbo-machines. They are used for transportation of the fluid by raising a defined volume flow to a desired pressure level. In a generic chemical plant, it is anticipated that the employee headcount nearly equals the number of CPs utilised in it[1].In addition, about 20% of the globally generated power is consumed to drive varied CPs[2].Thus, it is apparent that CPs are significant equipment in industries and their efficient and effective running is indispensable for the continual operation of plants.
CPs have great importance in varied fields, with the applications ranging from miniature CPs of a few Watts to large CP turbines of more than 250 MW. Some CP applications are given in Refs. [3-5], which shows that owing to CP's versatility, simple design and efficient working, they are widely used[6].Also, CPs are not merely supplementary equipment but can also be critical components that ensure the process flow of the industry. Hence, it is imperative that they are sufficiently maintained to have sustained operation of the plant and to ensure operator's safety. According to a study published in 1995 by the specialists of Verband Deutscher Maschinen-und Anlagenbau (VDMA, German Engineering Federation), the average maintenance period of CP is 3 months, whereas the average period for unscheduled repairing of the pump systems due to failure is 9 months[7].But prior to the CP maintenance strategies, it is important to discuss its various failure mechanisms.
CPs are widely applied and many factors account for their failure. These factors may be related to mechanical vibration, hydraulic vibration, the motor running the CP, and the complete pumping system. A detailed description of CP failure is given in Appendix A.
Condition based monitoring (CBM) is one of the strategies to counter CP failures. In CBM, systematic observations are taken from the CP system[8-9]. In modern days, the signals are taken from the CPs by using sensors. The signals are pre-processed before being analyzed. Different aspects of CBM and its philosophy are discussed in Section 1. Suitable CBM processes used by the majority of the researchers are also provided. In Section 2, different types of spectral analysis of signals used for finding CP defect is elaborated. In classical methodology, visual inspection of spectra is performed and machine learning tools are used for distinguishing the healthy and faulty CP spectra. Case studies for CP fault detection are given in Section 3. Section 4 concludes this review and Section 5 draws the future research directions.
1 Condition Based Maintenance of CPsFailure mechanisms of CPs motivate the design of maintenance strategy to safeguard CP and its allied components. Different types of fault management strategies are depicted in Fig. 1. The maintenance for a process or equipment in a plant could be broadly classified as the planned maintenance or unplanned maintenance. The scope of this review is limited to on-demand maintenance scheme, also known as the CBM or structural health monitoring. CBM has gained popularity in industries as it reduces undesired break-down of the plant and recommends maintenance only when required, which is time and cost efficient.

|
Fig.1 Plant fault maintenance strategies |
CBM encompasses evaluating the "condition" of the system. This is done by closely observing the current working status of the system via some useful measured parameters and/or signals. The basic steps for CBM are given in Fig. 2.

|
Fig.2 Flowchart of the working of CBM |
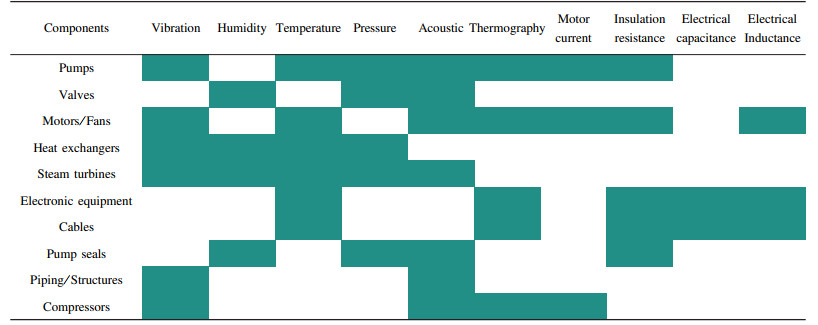
From Fig. 2, it is clear that the choice of the signals (or sensors) used in CBM is crucial and must be judiciously made. The types of signals used to monitor the mechanical systems are given in Table 1 (Coloured boxes indicate the suitable sensors for components). The suitable locations for sensor installation in CP are shown in Fig. 3.
| Table 1 Typical signals used to monitor various mechanical/electrical components |

|
Fig.3 CP sensor locations for acquiring different signals |
Different approaches to implement CBM are classified as follows: visual signal inspection of sensor data methods, physical-model based methods (parametric/non-parametric), and expert system-based data driven methods. In the subsequent section, the application of these methods for the fault diagnosis of CPs is explained.
2 CP Fault Diagnosis Using CBM TechniquesSome conventional techniques used for the health-monitoring of CPs are given in Table 2. Most of these techniques use evaluation of geometric or hydraulic conformity through manually inspecting the respective components. However, these methods are time-consuming and may not be very beneficial for online monitoring of CP systems. The alternative is to use sensor data to understand the absence or presence of the faults. Ning et al.[10]presented a discussion on the usage of various hardware-software combinations to acquire data from a CP system. McKee et al.[11]studied various state of the art techniques used in the fault diagnosis of CPs.
| Table 2 Conventional techniques used for diagnosis of some mechanical/hydraulic faults in CPs |
2.1 Visual Signal Inspection of Sensor Data
Visual inspection of sensor data is a classical approach for fault detection. It is generally done either by observing the spectral patterns of the acquired signals or by extracting some useful statistical features from the signals and studying their variation over the time. Visual signal inspection using spectral study can be done by using vibration-based spectral analysis, acoustic emission spectral analysis, motor current spectral analysis, instantaneous angular speed spectral analysis, noise spectrum analysis, and pressure spectrum analysis. To analyse the data using visual signal inspection using statistical methods, the patterns of the features extracted from these signals are used. A comparison of different works in the area of CP fault diagnosis using visual signal inspection methods are tabulated in Table 3. Visual inspection techniques are instrumental in identifying faults when their characteristic frequencies are known. However, there are some significant disadvantages of these methods: 1) Highly skilled and experienced professionals are necessary to monitor the signal; 2) It is challenging for a human being to monitor the signal continuously and may be subject to human errors due to fatigue; 3) The spectrum pattern would change with any change in the operating speed of the CP; 4) Proper filtering techniques need to be employed to keep the spectrum immune to noise.
| Table 3 Various visual inspection techniques for classification of CP faults |
2.2 Mathematical Modeling of Dynamic Systems
Mathematical modeling of a system involves systematic representation of the physical attributes of the system so that it imitates the actual operating system as closely as possible. Generally, to simplify a system modeling, many assumptions are taken into consideration. The mathematical models usually use stiffness (spring elements), dampers and distribution of loads or point loads (masses). For instance, a four-wheeler can be modeled as a mass being suspended on four springs and four dampers, which gives rise to a second order differential equation to describe the system. Even a system as complex as a human body can be modeled mathematically[31]. The advantage of mathematical modeling techniques is that they give a deeper understanding of the system functioning. Some reviews on different mathematical modeling techniques employed in fault diagnosis of machinery are given in Refs.[32-34]. A typical mathematical model-based fault diagnosis system's flow chart is shown in Fig. 4.

|
Fig.4 Flow chart of a model-based fault detection system |
Mathematical modeling of the CP system is very useful to estimate the physical performance of the processes. From the survey, the following observations are obtained: 1) It requires a complex model to accurately define the CP system. 2) The models developed are highly sensitive to the operating state (or change in operating state) of the CP. Sometimes the model is also sensitive to the noise. 3) The chosen signals and threshold limit play a vital role in ensuring no false alarm generation. 4) Each fault in the CP needs to be modeled separately using separate functions, as it is very difficult to model combination of faults.
2.3 Machine Learning TechniquesMachine learning and data driven techniques utilize existing sensor data and perform the fault detection-based on various schemes. These techniques assist in realizing quick and reliable fault detection with minimum human intervention. Hence, these techniques help in reducing the cost and improve the energy system performance.
For successful application of any machine learning algorithm, the pre-requisite is the availability of the data. The machine learning algorithm employs a collection of features to represent the data. These features can have either continuous values or discreet values, or both. When the examples are denoted by recognized labels (known correct outputs), the learning algorithm is said to be supervised[35]. However, in unsupervised learning, the examples are not labelled[36].A brief review on machine learning algorithms is given in Ref. [37].
Features play a vital role in understanding the fault characteristics, thereby enhancing the working of the machine learning algorithm. These features may be mined from the signal in time domain[38-46], frequency domain[47-53] or in time-frequency space[42, 54-60] of the sensor data. Statistical features, such as mean, variance, standard deviation, kurtosis, skewness, crest factor, entropy, energy, root mean square, shape factor, impulsive index, and power to average, are extracted from raw data/signals. The choice of features, and feature subset selection needs to be made judiciously. The feature subset selection involves removing unnecessary redundant feature data, thereby reducing its dimensionality[61]. In general, features can be relevant (having influence on the outcome), irrelevant (having low or no influence on the outcome) or redundant (one feature can be represented by another)[62]. A detailed analysis for feature selection for blockage and cavitation detection in a CP (OberdorferTM 60P CP) is given in Ref.[63].
According to Refs.[35, 62], supervised machine learning algorithms may be categorised as logic-based, neural-network-based, statistical-learning-based, and support vector machines.
2.3.1 Logic-based classifiersThe logic-based classification algorithms can be of many types, of which decision trees and rough sets are dealt in this section. A basic understanding of decision tree algorithm is given by Murthy[64]. "Decision trees" are tree structures that sort examples based on their feature attribute/value. Here, each node signifies a feature value of a sample to be sorted and every division (branch) denotes a value that the feature can take. Samples are sorted beginning from the origin/root level depending on the value of features they assume. A general structure of the decision tree is given in Fig. 5.The popularly used decision tree algorithms are C4.5[65] and J48 algorithms. Refs. [39-40, 43, 56-57] used decision trees for the classification of CP faults.

|
Fig.5 Basic structure of a decision tree |
Sakthivel et al.[39] developed a methodology using C4.5 decision tree algorithm for CP fault classification. The development of the decision tree is comprised of four stages: building phase, pruning phase, discretization of continuous valued attribute, and feature selection using the decision tree. Decision tree structure/construction largely depends on the selection of feature attributes. Entropy-based information gain was used as a selection criterion in algorithm C4.5. The detailed steps for decision tree information gain are given in Appendix B. Muralidharan and Sugumaran[57] utilized energy features extracted from various wavelet families that were used for discrete wavelet transform (DWT) to construct J48 classification algorithm. CP faults, like the healthy CP, cavitation, CP with bearing faults, CP with impeller defects and CP with both bearing faults and impeller defects were considered.
Another rule-based classification technique is rough sets. Rough set theory was first developed by Pawlak as a mathematical tool to characterize imprecise knowledge[66-67]. The appearance of the "boundary region" marks the key dissimilarity between a classic set and a rough set, as shown in Fig. 6, where the uncertain elements exist[68]. Another tool to take care of imprecise knowledge is fuzzy-set. The main difference between fuzzy set and rough set is that the former requires a membership function to account for the grade of elements contribution, whereas the latter does not need it. An overview of the fuzzy-logic-based classifiers is given by Bonarini[69]. The fuzzy logic helps to improve the classification by permitting the use of overlying class definitions. Refs. [47, 70] used fuzzy logic for CP fault identification. Refs. [42, 40, 56] used the rough set fuzzy theory for CP fault classification.

|
Fig.6 Rough set representation |
2.3.2 Neural-network-based classifier
The classifiers based on the artificial neural network (ANN) can classify the data that are not linearly separable. Zhang[71] reviewed the work done on ANNs. The construction of a multi-layered ANN is illustrated in Fig. 7. It comprises a number of units (neurons) linked together in a systematic arrangement. These neurons are broadly classified into three layers, i.e., the input layer, hidden layer(s) and output layer. Note that there will be only one input and output layer, but there can be more than one hidden layer. The feed-forward ANNs allow signals to travel from the input to output layer (only in one direction). In general, it is very complicated to decide the number of hidden layers or neurons. Too few neurons may lead to poor generalization and too many may lead to an over fit condition and ultimately makes it difficult to search for the global optimum. Camargo and Yoneyama[72] provided a good argument on this. Computation/data processing in an ANN are explained in Appendix C.

|
Fig.7 ANN architecture |
Many researchers have successfully employed ANNs and their modified versions to classify CP faults[38, 41, 44-45, 49-51, 73-75]. Zouari et al.[38] developed a CP fault identification system based on neural network (NN) and neuro-fuzzy techniques. To handle the problem of dealing with unlearned classes, neuro-fuzzy networks were considered.
Wang and Chen[73] developed a method to classify CP faults at early stages with frequency-based symptom parameters using the rough sets, wavelet transform (WT), and partially-linearized NN (PNN). The WT was used to obtain features from an optimal frequency range. The rough sets were employed to acquire the identification knowledge. The PNNs learned from the acquired knowledge. In another work, Wang and Chen[74] proposed a sequential fault detection method using PNN. In this technique, the non-dimensional symptom parameters (NSPs) were defined from time-domain data. To identify the sensitivity of non-dimensional symptom parameters to detect the faults, a synthetic detection index was proposed. The proposed method was then tested to identify the CP faults. In continuation, Wang and Chen[75] developed a fault diagnosis approach based on the DWT, rough sets, and PNN. Rbio 2.8 wavelet was used to extract the fault information from each of the faulty conditions on the CP. NSPs were calculated for the recomposed signal at each level. The PNN could then denote intricate relationships between fault types and symptoms.
Nasiri et al.[50] developed a method to classify different severities of cavitation using vibration signature in NN. Also, a study was presented regarding the number of sensors to be used and their optimal position. The study reveals that in case of availability of a single sensor, it may be placed in the radial location on the CP. If two sensors are available, they may be placed at the radial and back locations of the CP. To minimize the error of fault detection further, vibration sensors at the radial, back and front locations may be used. Farokhzad et al.[51] diagnosed seal defects, impeller faults, and cavitation in CP with 100% accuracy using features extracted from the vibration spectra with ANN algorithm.
Kumar et al.[76] introduced a novel convolutional NN for bearing defect detection. To make the algorithm robust for small data set, cost function was modified by adding sparsity cost function. This helps to stop the unnecessary activation of the neurons of hidden layers. This approach is highly suitable when there is lack of classifier training data. Tiwari et al.[63] identified the blockage and cavitation and their severity in the centrifugal pump by using pressure signal features with the application of deep learning algorithm. The used algorithm was able to detect the presence of blockage with 100% accuracy. It was also shown that the data classification accuracies were related to the severities of the blockage fault.
Kumar et al.[76] identified the blockage severity in centrifugal pump by using deep learning multiclass data classification technique. Pressure, acceleration, and motor line current signals were considered for blockage severity identification. It was found that the pressure signal gave the best qualitative indication of blockage intensity (high blockage and low blockage), whereas acceleration signal was the best indicator for quantitative blockage level prediction. It was also found that the use of multisource data was very helpful to improve the blockage prediction accuracy (approx. 100%). The blockage level prediction was tested at unseen data using different combination of sensors, data sets and input features. The obtained accuracy was also good enough to predict the blockage level using unseen data. Along with the fault detection, researchers have also tried to work on the prognostics of the CP using data driven techniques. Heng et al.[77] proposed a new methodology in which the information of population characteristics and the trending data of suspended condition was used to predict the remaining life of the CP. ANN was considered to predict the survival of the components in future. It was observed that the proposed method was able to predict the future survival. In order to monitor the condition of the rotary machines and their future survival, an excellent review of prognostic techniques is given by Lee et al.[78]
2.3.3 Statistical learning-based classifierThese techniques are identified by their characteristic probability model. According to this model, the probability of a sample belonging to a specific class is defined, which is different from the standard classification problems. Bayesian networks[79] and k nearest neighbours (k-NN) (instance-based learning technique) fall under this category of machine learning techniques.
Usually, the learning of a Bayesian network is split into two tasks: learning of the direct acyclic graph (DAG) network structure and estimation of parameters. The probabilistic parameters are encrypted into a set of tables in the form of local conditional distributions of variable given its parents. The joint distribution is calculated by multiplying these tables[62]. When there are too many features defining the datasets, it is highly involved to construct complex network structures[80].
The naïve Bayes network is a simplified Bayesian algorithm in which the DAGs are constructed based on a single parent and several child nodes. It involves a very strong underlying assumption of independency of all the child nodes with respect to their parent[62]. The advantage of this algorithm is that the training is much less time consuming computationally. However, the features may not be independent of each other, when naïve Bayesian networks may not work as good as other high-level machine learning algorithms. Refs. [43, 54] used Bayes net and naïve Bayes algorithms for the CP fault diagnosis. Muralidharan and Sugumaran[54] compared the CP fault classification performance using algorithms based on the naïve Bayes and Bayes net. They used the DWT based features to classify various CP faults, like cavitation, bearing faults, impeller defects, and CP with coexisting bearing faults and impeller defects. In most cases, Bayes net outperformed naïve Bayes. They obtained 100% classification accuracy using the sym3 and rbio2.6 wavelets and the Bayes net algorithm.
Another machine learning algorithm in this category is a k-NN technique, which is an example-based learning technique. It is built on the knowledge that an example belonging to a particular dataset lies in the close proximity to other examples with similar attributes. If each example is marked with its respective class label, an un-classified example could be assigned as the label of its nearest neighbour. k-NN identifies k nearest neighbours to unclassified example, and the class which occurs the most frequently is assigned. Sakthivel et al.[43] categorized CP faults such as impeller faults, seal faults, bearing faults, combination of impeller and bearing faults, and cavitation, using the decision trees, naïve Bayes, Bayes net, and k-NN algorithms. Various dimensionality reduction techniques (both linear and non-linear) were used to consolidate the features. The PCA-decision tree combination was found to give the best classification performance.
2.3.4 Support vector machine classifierSupport vector machine (SVM) is based on the statistical learning theory, and is one of the latest machine learning techniques[81-82]. An excellent review on the applications of SVMs for machinery fault identification was given by Widodo and Yang[83]. SVMs are non-probabilistic, binary, and linear classifiers. They revolve around the concept of construction of a linear hyperplane to separate two classes of data as shown in Fig. 8. By solving the optimization problem of maximizing the margin, the hyperplane's (decision boundary) location and orientation can be found. Here, margin is defined as the maximum distance of the support vectors (data points closest to the hyperplane) from the hyperplane. The working of SVM is given in Fig. 8 (Refer to more details in Appendix D), where X is the input data vector in which the data points belong to known classes, and they are linearly separable, the equation of the hyperplane separating the two classes can be written as
| $ f(\boldsymbol{X})=\boldsymbol{W}^{\mathrm{T}} \boldsymbol{X}+b=0 $ |

|
Fig.8 Binary classification hyperplane in SVM |
in which W is a multidimensional vector, and b is a scalar.
The advantages of SVMs are as follows: 1) they require much fewer data to construct a reliable classifier; 2) their training time is less; 3) because of the convex function optimization, they find the global minimum. However, the disadvantage is that classifier's performance majorly depends upon the values of SVM parameters and kernel parameters. Many optimization and cross validation techniques have been used by the researchers to construct an optimum SVM classifier. Various CP fault classification algorithms are given in Refs. [41, 48-49, 52, 58, 60, 84-92].
Yuan and Chu[48] used the multi-class SVM algorithm to classify various pump-rotor faults, such as the gear damage, structure resonance, vane rupture, shaft crack, bearing damage, bearing looseness, rotor part looseness, rotor eccentricity, rotor radial touch friction, body join looseness, pressure pulse, cavitation, and shaft bend. They used feature dimensionality reduction technique PCA. They compared various multiclass SVM strategies, and found that "one to others" gave the maximum precession ratio and took the least training time. Zhao et al.[49] used the neighbourhood rough set models to select the features for slurry CP fault classifications. It was illustrated that utilizing the method of a shared neighbourhood size for every feature might miscalculate feature's degree of dependency. Therefore, the neighbourhood rough set model was revised by setting different neighbourhood sizes for various features. To check the effectiveness of feature selection probabilistic neural networks, k-NN and SVM algorithms were used.
Sakthivel et al.[84] matched the classification accuracy of the gene expression programming (GEP) technique with other pattern recognition techniques, like the SVM, wavelet-GEP and PSVM in classifying the same faults. It has been observed that both SVM and GEP outdo the rest of the methods, giving a classification accuracy of 99.93%. Saberi et al.[41] compared the performance of ANN and SVM to classify CP faults with noisy data. It was found that the SVM outperformed ANN in the fault classification. To extract suitable features from the vibration data, Zhu and Zhao[52] used empirical mode decomposition (EMD) and intrinsic mode functions (IMFs). They classified CP faults such as the misalignment, unbalance, and looseness. The classification algorithm adapted was least square support vector machine (LSSVM). They obtained a classification accuracy of 92.6%.
Muralidharan et al.[58] used the CWT analysis in conjugation with the SVM to diagnose the CP faults. They compared the performances of various wavelet families at different levels. The best classification accuracy was found with db8 wavelet. Azadeh et al.[85] proposed the SVM-based flexible algorithm with the hyper parameter optimization and ANN. The optimization techniques used were the genetic algorithm (GA) and particle swarm optimization (PSO). A binary CP fault classification was attempted in the normal as well as noisy states of the signals. The SVM with hyper parameter optimization gave better prediction performance than ANN.
Panda et al.[92] used vibration signal for prediction of cavitation and flow blockage in centrifugal pump. Kernel parameter were optimally chosen to get best performance of the SVM classifier. Five blockage conditions and blockage level at the start of cavitation were considered in this study. Features such as the mean, standard deviation, skewness, kurtosis, crest factor and entropy were extracted, which were tried for binary classification and a multiclass classification of all the blockage faults. The binary classification gave better results over the multiclass classification.
Rapur and Tiwari[87] used frequency domain vibration signals to identify four severities of blockage in a CP with the help of SVM. It was found that the low severity of blockage could be classified with an accuracy of 70.2%, and the high severity could be classified with an accuracy of 99.82%. In other works[88-90], Rapur and Tiwai classified co-existing blockage and impeller defect faults used features from the time-domain vibration data and the SVM algorithm. They observed that the classification accuracy was speed dependent and faults were more classifiable at higher speeds.
New CBM techniques like fault detection using thermal imaging can also be applied to CPs. Data collection and condition monitoring using thermal imaging has been applied on various electrical and mechanical machines[93-94]. Glowacz[93] used SVM for condition monitoring of angle grinder with thermal imaging. Air blockage fault was analysed by capturing the thermal images of the grinder, and SVM was used for image processing and fault classification. Similarly, thermal imaging can also be used with other AI techniques like, ANN, DL, DT, etc.[76] The thermal imaging related methods mentioned above are very useful for the electric machine in which the first-hand information of the fault emerges in the form of temperature is generated. But it is not guarantee of the suitability of the thermal techniques for CP systems. The continuous flow of water in CP systems may affect (in negative sense) the thermal signal/images.
3 Case Studies for CP Blockage and Cavitation Severity DetectionIn order to show the fault detection in an actual experimental setup, case studies for identification of suction pipe blockage and cavitation in a CP (OberdorferTM) are given in this section. Deep-learning-based binary data classification techniques are used here for fault identification. The experimental setup for fault simulation is shown in Fig. 9. The important components of the experimental setup are 1) machinery fault simulator (MFS), 2) tri-axial accelerometer, 3) DC power supply unit, 4) data acquisition system, and 5) fault simulation valve.

|
Fig.9 Experimental setup for fault simulation |
In experimental setup, CP mounted on the MFS is driven by an induction motor. Motor shaft is connected to the pump shaft using a belt and pulley drive system. Acceleration data acquired from the tri-axial accelerometer is used for fault detection. Accelerometer is mounted on the casing of the CP, as shown in Fig. 10. For simulation of the suction pipe blockage fault, a modulating valve was used, as shown in Fig. 11 (a).

|
Fig.10 Accelerometer mounting on CP |

|
Fig.11 Blockage valve (a) and blockage level (b) |
3.1 Experimentation Details
The experiments were performed to simulate the suction pipe blockage fault and cavitation fault in CP. For blockage fault simulation, acceleration data was acquired at different blockage levels/severity. Division of the blockage levels (B0 to B5) is shown in Fig. 11. To show the robustness of the methodology, data collection was done at different running speeds of the pump by running the induction motor from 30 Hz to 65 Hz with the interval of 5 Hz. Here, all the combinations of B0 blockage (Fig. 11) and speed indicate healthy pump conditions (Table E1 in Appendix E), whereas the rest of the combinations of speed and blockage indicate fault conditions. Data collection statistics of the experiment are given in Table E2 in Appendix E.
3.2 Fault Detection MethodologyThe data acquired from the sensor contain fault information, for which binary data classification is used for fault detection. Fault features present in the data help the algorithms/technique capture the important aspects by removing the redundant information. Choice of the features depends on the faults as well as acquired data. Based on the references available in the literature, mean, standard deviation, kurtosis and skewness are extracted from acceleration signals for all the healthy and fault combinations. These extracted features are input to the ANN for data classification. Adaptive moment estimation (Adam) deep learning optimizer is used for finding the optimum value of weights and bias in the network. The basic details of ANN are already given in previous section. The details of the structure of the used ANN are given in Table E3 (Appendix E). The performance of classifier not only depends on the used algorithm and structure, but also depends on the chosen hyperparameters. The details of the hyperparameters used in the network are given in Table E4. Ref. [95] is referred to for hyperparameter selection and tuning. The computation was done in Python (Scientific Python Development Environment, Spyder) software using an open source "Tensorflow" deep learning library[96]. For data classification, total available data is divided in 80∶20 train test ratio.
3.3 Case Study 1: Blockage Fault Severity DetectionThis section deals with the identification of the severity of the suction pipe blockage fault. In order to differentiate the blockage data from the healthy (no blockage) pump data, binary data classification is performed. Each blockage level (B1, B2, B3, B4, B5) data is classified against the healthy pump (B0) data (Note: data of all the running speeds are considered). The results of the data classification are shown in Table 4. It can be observed that the classification accuracy of the classifier to separate the data of B0 and B1 level is around 85%. This indicates that the classifier has some difficulty in separating the data of two blockage levels (B0 vs B1) with high accuracy (above 95%). The reason is the very low blockage level (16.6% blockage in pipe cross sectional area), for which complete separation of the data is quite difficult. The classification accuracy for B0 v.s. B2 is above 95%, which indicates that the healthy pump data (B0) is relatively easily separable against B2 (33.3% blockage) data. Similarly, as the blockage level severity is increasing, the classification accuracy is also increasing. This shows that the proposed approach can be used to identify the severity of the blockage fault, where low classification accuracy (below 85%) indicates low blockage severity (arpprox. 15% blockage), and high classification accuracy (above 90%) indicates high blockage severity (above 30% blockage).
| Table 4 Data classification accuracy for blockage severity detection |
3.4 Case Study 2: Cavitation Detection with Increasing Blockage Level
This section deals with the identification of cavitation in CP with increasing blockage levels. During the experimentation, it was observed that the presence of blockage at high running speed formed cavitation bubbles in CP, as shown in Fig. 12. Hence, the data of each blockage level is divided into two categories: bubble formation/cavitation data and no bubble formation/no cavitation data.

|
Fig.12 Cavitation development with speed and blockage severity |
The data classification is performed at each blockage level to separate the cavitation data with no cavitation data (including healthy pump B0 data). The results of the data classification are given in Table 5. It can be observed that the classification accuracy is above 95%. This indicates that the classifier is able to separate the cavitation data with no cavitation data. Hence, it can be concluded that the presence of cavitation is accurately predicted.
| Table 5 Data classification accuracy for cavitation severity detection |
3.5 Case Study 3: Cavitation Severity Detection with Increasing Pump Running Speed
During the experimentation, it was observed that at high speed, a large number of bubbles were formed at all blockage levels. In practical application, identification of the cavitation severity is very important for the proper working of pump system. In this section, an attempt was made to identify the severity of cavitation in CP using binary data classification approach. Total available data is divided into two categories, cavitation and no cavitation data. Data classification is performed for data at each running speed of CP (including all blockage levels). The classification accuracies are shown in Table 6. It can be observed that at 30 Hz classification accuracy is relatively low (82%). This shows that the cavitation data and no cavitation data are not easily separated at low speed. The reason of this may be just initiation of the cavitation in CP at different blockage levels. It can also be observed that at 35 Hz the classification accuracy suddenly increases to around 92%. This indicates that the data are easily separable compared with 30 Hz data. The reason of this may be developed cavitation at 35 Hz with blockage. Similarly, it can be seen that the classification accuracy is very high for 50 Hz to 65 Hz data, which may be due to fully developed cavitation in CP. This indicates that the severity of cavitation is related to the blockage level, which is directly reflected in the classification accuracy of classifier.
| Table 6 Data classification accuracy for cavitation severity detection with speed |
4 Conclusions
In this paper, a review has been presented on the state-of-art methods used for the diagnosis of various CP faults. This review is expected to be useful to give a head-start to new researchers in this field. Notably, such a review would help to identify the un-touched areas, which are given in the future work pertaining to CP fault diagnosis and would avoid repetition of previous works. From the literature review, it is vivid that there is a significant amount of work that has been done on the fault diagnosis of CPs. However, we are still far from achieving one-step solution for the detection of all types of faults in CPs. Overlaps are also frequently observed between works by various researchers. It is the need of the hour to design an online system in the industry that can perform CP fault diagnosis and prognosis in real time. The notable points from the review are as follows:
1) Condition monitoring/maintenance requirement
a) Rotating machines are prone to failures due to various reasons, including the unbalance, misalignment, mechanical component damages, electrical faults, hydraulic faults, etc.
b) To increase the longevity/useful life of the system (rotating equipment), it is important to identify the system faults at their inception. Therefore, CBM techniques are gaining popularity in industrial applications. They reduce the maintenance costs by using the information collected from the equipment to monitor their states.
c) Centrifugal pumps are very important fluid energizers used in many industrial and household applications. They maintain the processes in the plant, and any breakdown directly affects the process flow. Therefore, researchers and industry practitioners are trying to understand their various failure mechanisms and are working out on the strategies to curb the progression of faults in them. This helps to improve their durability and avoids any unscheduled breakdown or maintenance.
2) The analysed fault category
a) The CP generally fails due to fluid flow instabilities or mechanical component faults or a combination of both. Fluid-related anomalies in a CP are due to the fluid-recirculation, cavitation and dry-run condition. Mechanical faults in a CP may be attributed to the seal defects, bearing faults, rotor misalignment, rotor unbalance, CP internal surface damages and impeller defects.
b) Faults in the CPs can be either independently existing or co-existing with some other faults. When the faults independently exist, it is straight forward to identify them. However, when faults co-exit, it becomes quite involved to identify them. But identifying co-existing faults is important as they can expedite the CP failure mechanism.
c) Identification of severity of the fault is also essential as it can help initiate a more specific corrective action. A single fault detection scheme for the identification of independently existing and co-existing faults in a CP system along with the estimation of the fault severity is still not very common in the literature. Identification of CP faults with the marginal change in severity is difficult as faults belonging to close severities produce similar fault patterns. The co-existence of blockage and cavitation fault in a CP has been analysed, and fault (blockage and cavitation) severity is identified using binary data classification technique. Interdependence of cavitation on the blockage severity is also observed.
d) The CP fault manifestation changes greatly with the change in operating speeds. Therefore, any CBM technique designed must take into account this factor and ensure that good fault identification performance is obtained at different speeds of operation. The blockage and cavitation severity detection have been performed over a range of speed to show the robustness of the proposed approach.
3) Signals, sensors and data
a) The common choices of signals are the vibrations, acoustic emissions, pressure measurements, and motor line current measurements. Vibration signals are very versatile and closely change with the faulty condition of the system. However, the signal choice depends upon various factors including the availability of measuring equipment, the access to the equipment mounting location and the most importantly the type of faults monitored. In general, flow related faults (e.g., the cavitation, turbulence, etc.) are very well identifiable using acoustic measurements or vibration measurements and/or pressure measurements. In addition, mechanical faults and/or electrical faults are identifiable using the vibration and the motor line current measurements.
b) The domain in which the signals are processed in any of the aforementioned CBM techniques is also very crucial. In general, rotor faults have characteristic fault frequencies and can be identified in frequency domain. However, faults like the flow anomalies, cavitation, bubble formation and collapse produce short lived transient signals, which can be either captured in time-domain or in time-frequency domain. Therefore, the processing of fault data in relevant domain plays a deciding role in the accuracy of identifying faults.
c) It has also been found that the data acquisition sampling rate of the signals has an effect on the classification accuracy of the faults in the CP. However, there is no thumb rule for the choice of the sampling rate.
4) Methodology/technique
a) Each of the CBM techniques discussed in literature has its own advantages and disadvantages. The choice of any of the techniques depends on the comfort level and understanding of the user. A brief comparison of these techniques is given in Table 7.
| Table 7 Comparison of CBM methodologies |
b) Visual signal inspection methods deal with observation of raw signal patterns (especially in frequency domain) or inspection of change in patterns of the parameters/attributes extracted from the signals. The visual inspection of the raw frequency spectrum signal needs a lot of expertise to avoid unnecessary comprehension errors. This technique works very well especially for faults that generate stationary characteristic frequencies (e.g., the bearing fault, impeller defects, etc.).
c) Mathematical modelling techniques try to approximate the system dynamics using certain assumptions to simplify comprehension. The signals from the CP system are fed to the mathematical model, and the output is compared with the benchmark condition. In the case of a complex system, it is highly involved to design an accurate system model, which is independent of its operating conditions. Also, setting a threshold limit on the generated residuals also needs a lot of field experience.
d) Machine learning techniques involve extracting useful features from the raw data of the CP and trying to classify or identify different states in it. However, the drawback of these methods is that there is a requirement of "big data base" for every condition of the CP that needs to be classified. Obtaining such data base may not always be possible.
e) Thermal imaging techniques have been used for fault detection of various electrical and mechanical equipment. Captured thermal images were found to give satisfactory results for CBM.
5 Future DirectionsThe following areas offer the scope for future work in this field:
1) Exploration in fault category and testing experiments
a) Most of the works in the literature considered independently existing mechanical or hydraulic CP faults. What is more, very few works have been done in the detection of fault severities of various faults. These two areas are very challenging, and works considering these aspects have not shown very good performance. In CPs, it is very rare to find the mechanical and flow related faults independent of each other. Most of the research papers have considered one or more specific type of fault, which belong to a particular fault category. All the faults of CP have not been considered together for fault diagnosis. Therefore, it is very important to develop a methodology, which can tackle all the faults of CP system.
b) In addition, the study of the effect of geometric tolerance variation (for the same configuration of the CP) on the fault classification accuracy would be interesting. Because if the algorithm is very sensitive to the slight geometric variations, it would make it highly difficult to identify healthy or fault CP states.
c) Limited work has been done on the estimation of the remaining useful life of CP and its components. This is another area that needs to be worked on.
d) In this research, a steady state CP fault identification was done. However, it will be interesting to see if the run-up or run-down data (producing transients) would be useful to identify CP faults.
2) Exploration in methodologies
a) Most of the CBM methods have confined themselves to component (of CP) level problems. It would be interesting to develop methodologies that can be dealing with system level problems (e.g., the CP, motor, valves, pipes combination).
b) Most of the condition-based monitoring techniques are dependent on the operating speed of the CPs. Therefore, devices/algorithms capable of handling different CP operating speeds with satisfactory accuracies need to be developed. In addition, techniques that can deal with unavailability of fault history data need to be devised (unsupervised learning methods).
c) It would be interesting to apply a laboratory developed algorithm on another CP system of different configuration. Since the statistical features carry the general tendency of the signals, it is expected that they show similar feature variation in specified conditions. If this works well, it would ensure that the methodology becomes applicable to wider variety of CP geometries and assemblies.
d) The sensors cannot always be placed at the desired locations on the CP. Therefore, it would be significant to see if the methodology could be extended in such a way that vibration measurements on the induction motor can be directly used to identify the CP fault state.
e) There is also a need of a technique or methodology to detect faults in multiple number of CPs.
f) New hybrid simulation technique can be explored, in which model of one part of the system will interact with the actual components of remaining part of the system. For example, model of the induction motor can be made to interact with the actual CP, or vice versa.
3) Exploration in signal/data category
a) Each signal type (i.e., vibration, AE, motor current, etc.) has its own share of advantages. Signal processing tools that can use data fusion techniques to this effect need to be developed.
b) Furthermore, it would be interesting if the algorithm training data could be acquired from numerical simulations packages (like finite element analysis packages ABAQUS, ANSYS, etc.) using multi-physics modelling, and be tested with the real-time data. This would eliminate the problem of data generation for the algorithm training. In this case, modelling of the system for different types of faults will be a challenging part.
c) Instead of using the conventional sensors (accelerometer, pressure transducer, acoustic sensor, etc.) for data collection, data acquisition can be explored in the form of thermal images.
d) Use of different types of filters in signals during signal processing will help to keep significant features and avoid redundant data/noise.
4) Exploration in application of AI techniques
a) Other emerging machine learning techniques, like the deep learning techniques or hybrid machine learning algorithms can be adapted to carry out the fault identifications and future survival (prognostics) of the system and its components.
b) Application of unsupervised learning techniques can be the most emerging and challenging for fault detection and prognosis.
c) Other CBM techniques, for instance, thermal imaging with AI, can be used for fault detection of CPs. The advantage of this approach is that it can easily detect the faulty component by using thermal imaging, but the challenge would be to identify the reason of fault in the same component. Moreover, it would be interesting to see the effect of water flow on the captured images, which depends on the physics of working of CP.
5) Future research plans
a) The authors are planning to perform different types of experiments and tests for different combinations of fault (e.g., impeller crack, discharge blockage, motor fault in CP system, etc.) detection using the proposed methodology. The outcomes of the proposed approach can be compared with the existing literature.
b) The data classification algorithm can also be tested for fault detection without manual feature extraction. This will help to reduce information loss due to limited manually extracted features.
c) For further exploration, the proposed approach can also be applied to the data of thermal images to monitor system condition using real time image processing. This will help to capture the system information from the thermal images that are absent in other conventional data collection techniques.
Supplementary Materials Appendix AFailure modes of Centrifugal Pump
The most common reasons for CP failures can be broadly divided into 1) mechanical vibration factors, 2) hydraulic vibration factors, 3) motor factors, and 4) degradation of pumping system.
1) Mechanical vibration factors
The major mechanical failure factors of CPs are the impeller and seal rubs, unbalanced rotor, misalignment, damaged bearings, and miscellaneous causes (vibrating piping system, too loose or too tight fixtures, flexible foundations, unequal tightening of bolts, damaged impeller, shaft cracks).
2) Hydraulic vibration factors
The major hydraulic failure factors of CPs are the water hammer, stall, cavitation and flashing, turbulence, and dry run.
3) Motor factors
The common causes of failures of CP motors are the bearing faults (approx. 41% failures), stator faults (approx. 37% failures), rotor faults (approx. 10% failures), unbalance, misalignment, etc. (altogether approx. 12% failures).
4) Degradation of pumping systems
The common causes of CP degradation are corrosion, erosion, abrasion, wear, fractures, cracks, extrusions and dents. Fractures, cracks, dents and extrusions usually occur due to excessive stresses in the CP system.
A list of common problems observed on the CP, and their credible causes are listed in Table A[97].
| Table A Problems in CPs and their probable causes |
Appendix B
Detailed Steps of the Decision Tree Information Gain
Decision tree information gains can be obtained by using the following steps, which help to decide the root node of the tree:
Step 1 Use training data set (S) to obtain Info(S):
| $ \operatorname{Info}(S)=-\sum\limits_{i=1}^k\left\{\left[\operatorname{freq}\left(C_i, S /|S|\right)\right]\right.·\\ \left.\log _2\left[\operatorname{freq}\left(C_i, S /|S|\right)\right]\right\} $ | (b1) |
where |S| represents the number of cases in training data set, Ci represents the i-th class (i =1, 2, 3…, k), freq (Ci, S) is the cases in Ci.
Step 2 Calculate expected information value for test X:
| $ \operatorname{Info}_X(S)=-\sum\limits_{i=1}^k\left[\left(\left|S_i\right|\right) /|S| \operatorname{Info}\left(S_i\right)\right] $ | (b2) |
where Si shows the subset in S for i-th output.
Step 3 Calculate information gain for test X:
| $\operatorname{Gain}(X)=\operatorname{Info}(S)-\operatorname{Info}_X(S) $ | (b3) |
Details on the Computation/Data Processing in ANN
The ANN construction relies on three major aspects, namely, activation and input functions of the unit, the construction of the network, and the weight of each connection (Wij, Wjk)[62]
Computation/data processing in an active node of ANN is shown in Fig. C. Most common activation function for hidden layers is "rectified linear unit" (ReLU), and most common activation function for output layer is "Softmax". "Cross entropy loss" function is the most common way to estimate the loss (L) (error between predicted class (
| $ L(\hat{y}, y)=-y \log \hat{y}-(1-y) \log (1-\hat{y}) $ | (c1) |
where y is the actual class/label and

|
Fig.C Computation at nodes of ANN |
If activation function and structure of the network are fixed, the neural network performance depends on the values of existing weights. Weights (W, in vector form) can be related to the input training data set vector (X) as
| $ \boldsymbol{Z}=\boldsymbol{W}^{\mathrm{T}} \boldsymbol{X}+\boldsymbol{b} $ | (c2) |
where b is the bias vector, and Z is the input function for activation function of the neuron.
These weights are originally set to some random numbers. Later the training set instances are recurrently exposed to the ANN. The outcome (y) is matched to the anticipated output (
Detailed Working of SVM
A detailed diagram of hyperplane orientation for binary data classification is shown in Fig. 8. If X is the input data vector in which the data points belong to known classes (yi=1for positive class of vector Xi and yi=-1 for negative class of vector Xi, where i = 1, 2, 3, …), and they are linearly separable, the equation of the hyperplane separating the two classes can be written as
| $ f(\boldsymbol{X})=\boldsymbol{W}^{\mathrm{T}} \boldsymbol{X}+b=0 $ | (d1) |
where W is a multidimensional vector, and b is a scalar.
The position of the hyperplane is decided by W and b. Data points closest to the hyper plane are called support vectors, and equation of the plane is decided by those support vectors by maximizing the margin. The following optimization problem gives the position of hyperplane:
| $ \operatorname{Minimize} \frac{1}{2}\|W\|^2+C \sum\limits_{i=1}^n \xi_i $ | (d2) |
| $\text { Subjected to } y_i\left[\boldsymbol{W}^{\mathrm{T}} \boldsymbol{X}_i+b\right] \geqslant 1-\xi_i $ | (d3) |
| $\xi_i \geqslant 0, i=1, 2, 3, \cdots, n $ | (d4) |
where ξi is slack variable, which will account for wrong predictions or noise, and C indicates cost function.
The above approach works well for linearly distinguishable data. However, when the data is not linearly classifiable, a kernel transformation to a greater dimensional space is carried out. In such a space, the data can be linearly classifiable.
Appendix EData Collection Statistics of the Experiment
| Table E1 Blockage level and motor speed combination for data collection |
| Table E2 Data acquisition statistics |
| Table E3 ANN structure |
| Table E4 Hyperparameter values |
| [1] |
Hennecke F W. Reliability of pumps in chemical industry. Proceedings of Pump Users International Forum. Frankfurt am Main, Germany: VDMA, 2000. 7-21.
(  0) 0) |
| [2] |
Hart R J. Pumps and Their Systems-a Changing Industry. https://oaktrust.library.tamu.edu/bitstream/handle/1969.1/164034/13.pdf?sequence=1&isAllowed=y.
( 0) |
| [3] |
Beebe R S. Predictive Maintenance of Pumps Using Condition Monitoring. Kidlington: Elsevier Science & Technology Books, 2004: 65-91.
( 0) |
| [4] |
Nelik L. Centrifugal and Rotary Pumps: Fundamentals with Applications. Boca Raton: CRC Press, 1999: 25-92.
( 0) |
| [5] |
Gülich J F. Centrifugal Pumps. Heidelberg: Springer, 2008: 25-37.
( 0) |
| [6] |
Garay P N. Pump Application Desk Book. Upper Saddle River, NJ: Distributed by Prentice-Hall, 1990: 18-29.
( 0) |
| [7] |
Thomas M. Marktanalyse zur Störungsfrüherkennung bei Pumpen mittels einer Betreiberumfrage. Stuttgart: Fachhochschule für Technik Stuttgart, 1995. 10.
( 0) |
| [8] |
Rao B K N. Handbook of Condition Monitoring. Kidlington: Elsevier Advannced Technology, 1996: 15-19.
( 0) |
| [9] |
Girdhar P, Moniz O. Practical Centrifugal Pumps. Burlington, MA: Elsevier, 2011: 155-169.
( 0) |
| [10] |
Ning B, Cheng X X, Wu S. Research on centrifugal pump monitoring system based on virtualization technology. Procedia Engineering, 2011, 15(1): 1077-1081. DOI:10.1016/j.proeng.2011.08.199 ( 0) |
| [11] |
McKee K K, Forbes G L, Mazhar I, et al. A review of machinery diagnostics and prognostics implemented on a centrifugal pump. Lee J, Ni J, Sarangapani J, et al. Engineering Asset Management 2011. London: Springer, 2014. 593-614.
( 0) |
| [12] |
Chudina M. Noise as an indicator of cavitation in a centrifugal pump. Acoustical Physics, 2003, 4: 463-474. DOI:10.1134/1.1591303 ( 0) |
| [13] |
Alfayez L, Mba D, Dyson G. The application of acoustic emission for detecting incipient cavitation and the best efficiency point of a 60 kW centrifugal pump: case study. NDT & E International, 2005, 38(5): 354-358. DOI:10.1016/j.ndteint.2004.10.002 ( 0) |
| [14] |
Alfayez L, Mba D. Detection of incipient cavitation and determination of the best efficiency point for centrifugal pumps using acoustic emission. Proceedings of the Institution of Mechanical Engineers, Part E: Journal of Process Mechanical Engineering, 2005, 219(4): 327-344. DOI:10.1243/095440805X33225 ( 0) |
| [15] |
Alfayez L, Mba D, Dyson G. Detection of incipient cavitation and the best efficiency point of a 2.2 MW centrifugal pump using acoustic emission. Journal of Acoustic Emission, 2004, 22: 77-82. ( 0) |
| [16] |
Al-Hashmi S, Gu F S, Li Y H, et al. Cavitation detection of a centrifugal pump using instantanous angular speed. Proceedings of the ASME 7th Biennial Conference on Engineering Systems Design and Analysis. New York: ASME, 2004. 185-190. DOI: 10.1115/ESDA2004-58255.
( 0) |
| [17] |
Chini S, Rahimzadeh H, Bahrami M. Cavitation detection of a centrifugal pump using noise spectrum. Proceedings of the International Design Engineering Technical Conferences and Computers and Information in Engineering Conference. New York: ASME, 2005. 13-19. DOI: 10.1115/DETC2005-84363.
( 0) |
| [18] |
Kamiel B, Forbes G, Entwistle R, et al. Impeller Fault Detection for a Centrifugal Pump Using Principal Component Analysis of Time Domain Vibration Features. https://surveillance7.sciencesconf.org/conference/surveillance7/37_impeller_fault_detection_for_a_centrifugal_pump_using_principal_component_analysis_of_tim.pdf.
( 0) |
| [19] |
Tan C Z, Leong M S. An experimental study of cavitation detection in a centrifugal pump using envelope analysis. Journal of System Design and Dynamics, 2008, 2(1): 274-285. DOI:10.1299/jsdd.2.274 ( 0) |
| [20] |
Čudina M, Prezelj J. Detection of cavitation in situ operation of kinetic pumps: effect of cavitation on the characteristic discrete frequency component. Applied Acoustics, 2009, 70(9): 1175-1182. DOI:10.1016/j.apacoust.2009.04.001 ( 0) |
| [21] |
Halligan G R, Jagannathan S. PCA-based fault isolation and prognosis with application to pump. The International Journal of Advanced Manufacturing Technology, 2011, 55(5): 699-707. DOI:10.1007/s00170-010-3096-2 ( 0) |
| [22] |
Mohanty A R, Pradhan P K, Mahalik N P, et al. Fault detection in a centrifugal pump using vibration and motor current signature analysis. International Journal of Automation and Control, 2012, 6(3-4): 261-276. DOI:10.1504/IJAAC.2012.051884 ( 0) |
| [23] |
Abdulkarem W, Amuthakkannan R, Al-Raheem K F. Centrifugal pump impeller crack detection using vibration analysis. Proceedings of the 2nd International Conference on Research in Science, Engineering and Technology (ICRSET). Dubai: Diamond Scientific Publishing, 2014. 206-211.
( 0) |
| [24] |
Stopa M M, Filho B J G, Martinez C B. Incipient detection of cavitation phenomenon in centrifugal pumps. IEEE Transactions on Industry Applications, 2014, 50(1): 120-126. DOI:10.1109/TIA.2013.2267709 ( 0) |
| [25] |
McKee K K, Forbes G L, Mazhar I, et al. A vibration cavitation sensitivity parameter based on spectral and statistical methods. Expert Systems with Applications, 2015, 42(1): 67-78. DOI:10.1016/j.eswa.2014.07.029 ( 0) |
| [26] |
Luo Y, Xiong Z X, Sun H, et al. Research on the induction motor current signature for centrifugal pump at cavitation condition. Advances in Mechanical Engineering, 2015, 7(11): 1-13. DOI:10.1177/1687814015617134 ( 0) |
| [27] |
Lu J X, Yuan S Q, Luo Y, et al. Numerical and experimental investigation on the development of cavitation in a centrifugal pump. Proceedings of the Institution of Mechanical Engineers, Part E: Journal of Process Mechanical Engineering, 2016, 230(3): 171-182. DOI:10.1177/0954408914557877 ( 0) |
| [28] |
Alabied S, Hamomd O, Daraz A, et al. Fault diagnosis of centrifugal pumps based on the intrinsic time-scale decomposition of motor current signals. Proceedings of the 23rd International Conference on Automation and Computing (ICAC). Piscataway: IEEE, 2017. 1-6. DOI: 10.23919/IConAC.2017.8082027.
( 0) |
| [29] |
Lima C A, Stopa M M, Filho B J C, et al. Cavitation detection in centrifugal pumps driven by frequency inverter fed motors. Proceedings of the 2017 IEEE Industry Applications Society Annual Meeting. Piscataway: IEEE, 2017. 17354877. DOI: 10.1109/IAS.2017.8101833.
( 0) |
| [30] |
Hamomd S, Alabied S, Xu Y D, et al. Vibration based centrifugal pump fault diagnosis based on modulation signal bispectrum analysis. Proceedings of the 23rd International Conference on Automation and Computing (ICAC). Piscataway: IEEE, 2017. 17289803. DOI: 10.23919/IConAC.2017.8082029.
( 0) |
| [31] |
Yang J K, Lövsund P. Development and validation of a human-body mathematical model for simulation of car-pedestrian collisions. Proceedings of the 1997 International IRCOBI Conference on the Biomechanics of Impact. Hannover: IRCOBI, 1997. 133-149.
( 0) |
| [32] |
Frank P M. Analytical and qualitative model-based fault diagnosis-a survey and some new results. European Journal of Control, 1996, 2(1): 6-28. DOI:10.1016/S0947-3580(96)70024-9 ( 0) |
| [33] |
Isermann R. Model-based fault-detection and diagnosis-status and applications. Annual Reviews in Control, 2005, 29(1): 71-85. DOI:10.1016/j.arcontrol.2004.12.002 ( 0) |
| [34] |
Isermann R, Ballé P. Trends in the application of model-based fault detection and diagnosis of technical processes. Control Engineering Practice, 1997, 5(5): 709-719. DOI:10.1016/S0967-0661(97)00053-1 ( 0) |
| [35] |
Kotsiantis S B. Supervised machine learning: a review of classification techniques. Maglogiannis I G, Karpouzis, K, Wallace M, et al. Emerging Artificial Intelligence Applications in Computer Engineering. Amsterdam: IOS Press, 2007. 3-24.
( 0) |
| [36] |
Jain A K, Murty M K, Flynn P J. Data clustering: a review. ACM Computing Surveys (CSUR), 1999, 31(3): 264-323. DOI:10.1145/331499.331504 ( 0) |
| [37] |
Dutton D M, Conroy G V. A review of machine learning. The Knowledge Engineering Review, 1997, 12(4): 341-367. DOI:10.1017/S026988899700101X ( 0) |
| [38] |
Zouari R, Sieg-Zieba S, Sidahmed M. Fault Detection System for Centrifugal Pumps Using Neural Networks and Neuro-Fuzzy Techniques. http://perso.univ-lemans.fr/~jhthomas/78_ZOUARI.pdf.
( 0) |
| [39] |
Sakthivel N R, Sugumaran V, Babudevasenapati S. Vibration based fault diagnosis of monoblock centrifugal pump using decision tree. Expert Systems with Applications, 2010, 37(6): 4040-4049. DOI:10.1016/j.eswa.2009.10.002 ( 0) |
| [40] |
Sakthivel N R, Sugumaran V, Nair B B. Comparison of decision tree-fuzzy and rough set-fuzzy methods for fault categorization of mono-block centrifugal pump. Mechanical Systems and Signal Processing, 2010, 24(6): 1887-1906. DOI:10.1016/j.ymssp.2010.01.008 ( 0) |
| [41] |
Saberi M, Azadeh A, Nourmohammadzadeh A, et al. Comparing Performance and Robustness of SVM and ANN for Fault Diagnosis in a Centrifugal Pump. https://www.researchgate.net/profile/Morteza-Saberi-3/publication/267857796_Comparing_performance_and_robustness_of_SVM_and_ANN_for_fault_diagnosis_in_a_centrifugal_pump/links/551af7ef0cf2bb7540787620/Comparing-performance-and-robustness-of-SVM-and-ANN-for-fault-diagnosis-in-a-centrifugal-pump.pdf.
( 0) |
| [42] |
Sakthivel N R, Sugumaran V, Nair B B. Automatic rule learning using roughset for fuzzy classifier in fault categorization of mono-block centrifugal pump. Applied Soft Computing, 2012, 12(1): 196-203. DOI:10.1016/j.asoc.2011.08.053 ( 0) |
| [43] |
Sakthivel N R, Nair B B, Elangovan M, et al. Comparison of dimensionality reduction techniques for the fault diagnosis of mono block centrifugal pump using vibration signals. Engineering Science and Technology, 2014, 17(1): 30-38. DOI:10.1016/j.jestch.2014.02.005 ( 0) |
| [44] |
Zhao W L, Wang Z L, Lu C, et al. Fault diagnosis for centrifugal pumps using deep learning and softmax regression. Proceedings of the 2016 12th World Congress on Intelligent Control and Automation (WCICA). Piscataway: IEEE, 2016. 165-169. DOI: 10.1109/WCICA.2016.7578673.
( 0) |
| [45] |
Azizi R, Attaran B, Hajnayeb A, et al. Improving accuracy of cavitation severity detection in centrifugal pumps using a hybrid feature selection technique. Measurement, 2017, 108: 9-17. DOI:10.1016/j.measurement.2017.05.020 ( 0) |
| [46] |
Bordoloi D J, Tiwari R. Identification of suction flow blockages and casing cavitations in centrifugal pumps by optimal support vector machine techniques. Journal of the Brazilian Society of Mechanical Sciences and Engineering, 2017, 39(8): 2957-2968. DOI:10.1007/s40430-017-0714-z ( 0) |
| [47] |
Perovic S, Unsworth P J, Higham E H. Fuzzy logic system to detect pump faults from motor current spectra. Proceedings of the Conference Record of the 2001 IEEE Industry Applications Conference. 36th IAS Annual Meeting. Piscataway: IEEE, 2001. 274-280. DOI: 10.1109/IAS.2001.955423.
( 0) |
| [48] |
Yuan S F, Chu F L. Support vector machines-based fault diagnosis for turbo-pump rotor. Mechanical Systems and Signal Processing, 2006, 20(4): 939-952. DOI:10.1016/j.ymssp.2005.09.006 ( 0) |
| [49] |
Zhao X M, Hu Q H, Lei Y G, et al. Vibration-based fault diagnosis of slurry pump impellers using neighbourhood rough set models. Proceedings of the Institution of Mechanical Engineers, 2010, 224(4): 995-1006. DOI:10.1243/09544062JMES1777 ( 0) |
| [50] |
Nasiri M R, Mahjoob M J, Vahid-Alizadeh H. Vibration signature analysis for detecting cavitation in centrifugal pumps using neural networks. Proceedings on the 2011 IEEE International Conference on Mechatronics. Piscataway: 2011. 12144418. DOI: 10.1109/ICMECH.2011.5971192.
( 0) |
| [51] |
Farokhzad S, Ahmadi H, Jaefari A, et al. Artificial neural network based classification of faults in centrifugal water pump. Journal of Vibroengineering, 2012, 14(4): 1734-1744. ( 0) |
| [52] |
Zhu Y L, Zhao P. Vibration fault diagnosis method of centrifugal pump based on emd complexity feature and least square support vector machine. Energy Procedia, 2012, 17: 939-945. DOI:10.1016/j.egypro.2012.02.191 ( 0) |
| [53] |
Xue H T, Li Z X, Wang H Q, et al. Intelligent diagnosis method for centrifugal pump system using vibration signal and support vector machine. Shock and Vibration, 2014, 2014: 1-14. DOI:10.1155/2014/407570 ( 0) |
| [54] |
Muralidharan V, Sugumaran V. A comparative study of naïve bayes classifier and bayes net classifier for fault diagnosis of monoblock centrifugal pump using wavelet analysis. Applied Soft Computing, 2012, 12(8): 2023-2029. DOI:10.1016/j.asoc.2012.03.021 ( 0) |
| [55] |
Muralidharan V, Sugumaran V. Feature extraction using wavelets and classification through decision tree algorithm for fault diagnosis of mono-block centrifugal pump. Measurement, 2013, 46(1): 353-359. DOI:10.1016/j.measurement.2012.07.007 ( 0) |
| [56] |
Muralidharan V, Sugumaran V. Rough set based rule learning and fuzzy classification of wavelet features for fault diagnosis of monoblock centrifugal pump. Measurement, 2013, 46(9): 3057-3063. DOI:10.1016/j.measurement.2013.06.002 ( 0) |
| [57] |
Muralidharan V, Sugumaran V. Selection of discrete wavelets for fault diagnosis of monoblock centrifugal pump using the J48 algorithm. Applied Artificial Intelligence, 2013, 27(1): 1-19. DOI:10.1080/08839514.2012.721694 ( 0) |
| [58] |
Muralidharan V, Sugumaran V, Indira V. Fault diagnosis of monoblock centrifugal pump using SVM. Engineering Science and Technology, an International Journal, 2014, 17(3): 152-157. DOI:10.1016/j.jestch.2014.04.005 ( 0) |
| [59] |
Ebrahimi E, Javidan M. Vibration-based classification of centrifugal pumps using support vector machine and discrete wavelet transform. Journal of Vibroengineering, 2017, 19(4): 2586-2597. DOI:10.21595/jve.2017.18120 ( 0) |
| [60] |
Kumar A, Kumar R. Time-frequency analysis and support vector machine in automatic detection of defect from vibration signal of centrifugal pump. Measurement, 2017, 108: 119-133. DOI:10.1016/j.measurement.2017.04.041 ( 0) |
| [61] |
Liu Y, Liu H. Efficient feature selection via analysis of relevance and redundancy. Journal of Machine Learning Research, 2004, 5: 1205-1224. ( 0) |
| [62] |
Kotsiantis S B, Zaharakis I D, Pintelas P E. Machine learning: a review of classification and combining techniques. Artificial Intelligence Review, 2006, 26: 159-190. DOI:10.1007/s10462-007-9052-3 ( 0) |
| [63] |
Tiwari R, Bordoloi D J, Dewangan A. Blockage and cavitation detection in centrifugal pumps from dynamic pressure signal using deep learning algorithm. Measurement, 2021, 173: 108676. DOI:10.1016/j.measurement.2020.108676 ( 0) |
| [64] |
Murthy S K. Automatic construction of decision trees from data: A multi-disciplinary survey. Data Mining and Knowledge Discovery, 1998, 2(4): 345-389. DOI:10.1023/A:1009744630224 ( 0) |
| [65] |
Quinlan J R. C4.5: Programs for Machine Learning. California: Morgan Kauffman Publishers, 2014: 6-25.
( 0) |
| [66] |
Pawlak Z. Some issues on rough sets. Peters J F, Skowron A. Transactions on Rough Sets I. Berlin: Springer, 2004. 2-59.
( 0) |
| [67] |
Pawlak Z, Skowron A. Rudiments of rough sets. Information Sciences, 2007, 177(1): 3-27. DOI:10.1016/j.ins.2006.06.003 ( 0) |
| [68] |
Liao C-C, Hsu K-W. A rule-based classification algorithm: a rough set approach. Proceedings of the 2012 IEEE International Conference on Computational Intelligence and Cybernetics. Piscataway: IEEE, 2012. 1-5. DOI: 10.1109/CyberneticsCom.2012.6381605.
( 0) |
| [69] |
Bonarini A. An introduction to learning fuzzy classifier systems. Lanzi P L, Stolzmann W, Wilson S W. Classifier Systems. Berlin: Springer, 1999. 83-104.
( 0) |
| [70] |
Azadeh A, Ebrahimipour V, Bavar P. A fuzzy inference system for pump failure diagnosis to improve maintenance process: the case of a petrochemical industry. Expert Systems with Applications, 2010, 37(1): 627-639. DOI:10.1016/j.eswa.2009.06.018 ( 0) |
| [71] |
Zhang G P. Neural networks for classification: a survey. IEEE Transactions on Systems, Man, and Cybernetics, Part C, 2000, 30(4): 451-462. DOI:10.1109/5326.897072 ( 0) |
| [72] |
Camargo L, Yoneyama T. Specification of training sets and the number of hidden neurons for multilayer perceptrons. Neural Computation, 2001, 13(12): 2673-2680. DOI:10.1162/089976601317098484 ( 0) |
| [73] |
Wang H Q, Chen P. Intelligent method for condition diagnosis of pump system using discrete wavelet transform, rough sets and neural network. Proceedings of the 2007 Second International Conference on Bio-Inspired Computing: Theories and Applications. Piscataway: IEEE, 2007. 24-28. DOI: 10.1109/BICTA.2007.4806411.
( 0) |
| [74] |
Wang H, Chen P. Sequential condition diagnosis for centrifugal pump system using fuzzy neural network. Neural Information Processing-Letters and Reviews, 2007, 11(3): 41-50. ( 0) |
| [75] |
Wang H Q, Chen P. Intelligent diagnosis method for a centrifugal pump using features of vibration signals. Neural Computing and Applications, 2009, 18(4): 397-405. DOI:10.1007/s00521-008-0192-4 ( 0) |
| [76] |
Kumar D, Dewangan A, Tiwari R, et al. Identification of inlet pipe blockage level in centrifugal pump over a range of speeds by deep learning algorithm using multi-source dat. Measurement, 2021, 186: 110146. DOI:10.1016/j.measurement.2021.110146 ( 0) |
| [77] |
Heng A, Tan A C C, Mathew J, et al. Intelligent condition-based prediction of machinery reliability. Mechanical Systems and Signal Processing, 2009, 23(5): 1600-1614. DOI:10.1016/j.ymssp.2008.12.006 ( 0) |
| [78] |
Lee J, Wu F J, Zhao W Y, et al. Prognostics and health management design for rotary machinery systems-reviews, methodology and applications. Mechanical Systems and Signal Processing, 2014, 42(1-2): 314-334. DOI:10.1016/j.ymssp.2013.06.004 ( 0) |
| [79] |
Jensen F V. An Introduction to Bayesian Networks. Oxfordshire: Taylor & Francis, 1996: 17-43.
( 0) |
| [80] |
Cheng J, Greiner R, Kelly J, et al. Learning bayesian networks from data: an information-theory based approach. Artificial Intelligence, 2002, 137(1-2): 43-90. DOI:10.1016/S0004-3702(02)00191-1 ( 0) |
| [81] |
Vapnik V N. The Nature of Statistical Learning Theory. New York: Springer-Verlag, 1995: 2-15.
( 0) |
| [82] |
Vapnik V N. Statistical Learning Theory. New York: Wiley, 1998: 2-11.
( 0) |
| [83] |
Widodo A, Yang B S. Support vector machine in machine condition monitoring and fault diagnosis. Mechanical Systems and Signal Processing, 2007, 21(6): 2560-2574. DOI:10.1016/j.ymssp.2006.12.007 ( 0) |
| [84] |
Sakthivel N R, Nair B B, Sugumaran V. Soft computing approach to fault diagnosis of centrifugal pump. Applied Soft Computing, 2012, 12(5): 1574-1581. DOI:10.1016/j.asoc.2011.12.009 ( 0) |
| [85] |
Azadeh A, Saberi M, Kazem A, et al. A flexible algorithm for fault diagnosis in a centrifugal pump with corrupted data and noise based on ANN and support vector machine with hyper-parameters optimization. Applied Soft Computing, 2013, 13(3): 1478-1485. DOI:10.1016/j.asoc.2012.06.020 ( 0) |
| [86] |
Rapur J S, Tiwari R. Automation of multi-fault diagnosing of centrifugal pumps using multi-class support vector machine with vibration and motor current signals in frequency domain. Journal of the Brazilian Society of Mechanical Sciences and Engineering, 2018, 40(6): 278. DOI:10.1007/s40430-018-1202-9 ( 0) |
| [87] |
Rapur J, Tiwari R. Severity Assessment and Classification of Blockage of Centrifugal Pumps in Frequency Domain of Vibration Data Using Support Vector Machine Algorithms. https://www.researchgate.net/profile/Shruti-Rapur/publication/320700956_Severity_Assessment_and_Classification_of_Blockage_of_Centrifugal_Pumps_in_Frequency_Domain_of_Vibration_Data_Using_Support_ Vector_Machine_Algorithms/links/5a1d04110f7e9b2a5316df28/ Severity-Assessment-and-Classification-of-Blockage-of-Centrifugal-Pumps-in-Frequency-Domain-of-Vibration-Data-Using-Support-Vector-Machine-Algorithms.pdf.
( 0) |
| [88] |
Rapur J S, Tiwari R. Multi-Class Experimental Fault Severity Assessment and Classification in Centrifugal Pumps Using Support Vector Machine Algorithm. https://www.researchgate.net/profile/Rajiv-Tiwari/publication/320700961_MULTI-CLASS_EXPERIMENTAL_FAULT_SEVERITY_ASSESSMENT_AND_CLASSIFICATION_IN_CENTRIFUGAL_PUMPS_USING_SUPPORT_VECTOR_MACHINE_ALGORITHM/links/61cd37c0e669ee0f5c72d843/MULTI-CLASS-EXPERIMENTAL-FAULT-SEVERITY-ASSESSMENT-AND-CLASSIFICATION-IN-CENTRIFUGAL-PUMPS-USING-SUPPORT-VECTOR-MACHINE-ALGORITHM.pdf.
( 0) |
| [89] |
Rapur J S, Tiwari R. A compliant algorithm to diagnose multiple centrifugal pump faults with corrupted vibration and current signatures in time-domain. Proceedings of the ASME 2017 Gas Turbine India Conference. New York: ASME, 2018. 1-10. DOI: 10.1115/GTINDIA2017-4615.
( 0) |
| [90] |
Rapur J S, Tiwari R. Experimental time-domain vibration-based fault diagnosis of centrifugal pumps using support vector machine. ASCE-ASME Journal of Risk and Uncertainty in Engineering Systems Part B: Mechanical Engineering, 2017, 3(4): 044501-044507. DOI:10.1115/1.4035440 ( 0) |
| [91] |
Shervani-Tabar M T, Ettefagh M M, Lotfan S, et al. Cavitation intensity monitoring in an axial flow pump based on vibration signals using multi-class support vector machine. Proceedings of the Institution of Mechanical Engineers, Part C: Journal of Mechanical Engineering Science, 2017, 332(17): 3013-3026. DOI:10.1177/0954406217729416 ( 0) |
| [92] |
Panda A K, Rapur J S, Tiwari R. Prediction of flow blockages and impending cavitation in centrifugal pumps using Support Vector Machine (SVM) algorithms based on vibration measurements. Measurement, 2018, 130: 44-56. DOI:10.1016/j.measurement.2018.07.092 ( 0) |
| [93] |
Glowacz A. Thermographic fault diagnosis of ventilation in BLDC motors. Sensors, 2021, 21(21): 7245. DOI:10.3390/s21217245 ( 0) |
| [94] |
Glowacz A. Ventilation diagnosis of angle grinder using thermal imaging. Sensors, 2021, 21(8): 2853. DOI:10.3390/s21082853 ( 0) |
| [95] |
Goodfellow I, Bengio Y, Courville A. Deep Learning. Cambridge: MIT Press, 2016: 117-119.
( 0) |
| [96] |
Raybaut P. Spyder-Documentation. https://pythonhosted.org/.
( 0) |
| [97] |
Tiwari R. Rotor Systems: Analysis and Identification. Boca Raton: CRC Press, 2017: 962-968.
( 0) |