 2023, Vol. 30


2. China Academy of Transportation Sciences, Beijing 100081, China;
3. School of Civil Engineering, Shandong University, Jinan 250061, China
Corrosion, as a primary cause of the performance degradation of steel bridges, severely threatens the normal operation of the bridges, and greatly reduces the performance and service quality of the structure. In severe cases, the entire bridge would collapse due to corrosion[1-6]. The popular anti-corrosion strategy is to coat steel bridges with paint. But this strategy has a poor effect. Paint-coated bridges will be corroded seriously shortly after entering operation[7-9].
High-strength bolts (HSBs) are more susceptible to corrosion than other parts of steel bridges. First, the bolt heads and nuts have so many angles that the coating is always not thick enough in some places. The paint coating is therefore very likely to peel off, exposing the bolts to corrosive media. The numerous angles also hinder the antiseptic treatment with inorganic zine. Second, nut tightening damage will occur during the construction of HSB clamping force, which tears off the protective layer. Third, most steel bridges are above rivers or seas, where the moisture containing corrosive gases and chloride ions can easily adhere to the bolt heads or nuts, resulting in serious local corrosion and decay. Although various anti-corrosion measures have been tried, it is inevitable to eliminate the bolt degradation caused by corroded nuts[10-12].
Dongming Yellow River Highway Bridge is China's first long-span continuous prestressed concrete box girder bridge reinforced with a cable-stayed system (CSS). The CSS enhancement uses the steel bracket, which is a friction-type HSB (FHSB). The FHSB connects the concrete girder with the steel joist, breaking down the cable force into two parts: a component in the normal direction of the anchor point of the girder, and a component in the tangential direction of the anchor point at the bottom plate of the girder[13]. The larger the former component, the more compressed the contact surface, and the greater the lifting force of the main girder; the larger the latter component, the more sheared the contact surface, and the stricter the demand for the shear capacity of the connection. In fact, the shear capacity of the connection depends on two issues: the friction generated by the bolt clamping force, and the normal component on the contact surface of the connection. Located in a corrosive environment of moisture and industrial waste gases, Dongming Yellow River Highway Bridge witnessed the corrosion of FHSB connections only one year after the application of anti-corrosion coating (Fig. 1). With the expansion of the corroded section, the residual clamping force (RCF) of the corresponding bolt gradually decreases, resulting in a decline in the shear capacity of the connection. Therefore, it is urgent to evaluate the RCF of corroded bolts.

|
Fig.1 Corroded nuts of FHSB connections in Dongming Yellow River Highway Bridge |
Currently, the RCF of HSBs is mainly evaluated by percussion method, ultrasonic method, and residual section measurement. The percussion method offers a low-cost, no-risk, and convenient way to diagnose the RCF: the target bolt is hit with a hammer, and the echo is listened to by engineering manually. But the effectiveness of this approach largely depends on the experience and intuitive judgment of the engineers[14]. This calls for a more effective and accurate strategy for inexperienced engineers. Hirokane et al.[15] collected the sound waves of the said echo, performed pattern recognition on the waves, and derived the RCF from the wave frequency. However, their strategy cannot pinpoint the RCF of the HSBs plated with inorganic zinc or the corroded ones. The ultrasonic method is mainly applicable to detecting the initial clamping force (ICF) during the construction of HSB and evaluating the overall mechanical properties of HSB connections. Yet there is not report on RCF evaluation of corroded HSBs[16].
There is an obvious correlation between the clamping force of the corroded FHSB and the residual size of nut or (and) bolt head. Yang and DeWolf[17] considered that corrosion can reduce the clamping force of FHSB and cause the relaxation of FHSB connections. A study conducted by Kulak et al.[18] concluded that the clamping force is more dependent on the corrosion rate of the whole sample. To quantify the RCF of corroded HSBs, Natori et al.[19] simulated bolt corrosion by mechanically cutting nut sections, and correlated the RCF with the cutting amount of the bolt head or nut thickness. By finite-element method (FEM), Shimozato et al.[20] studied the relationship between the cutting height of the bolt head and the RCF, and observed the gradual decline of the RCF with the growing corrosion of the bolt head; but their numerical results deviated from the test results by as much as 40%. Tai et al.[21] found that the nut height within 12 mm from the gasket has a negligible effect on the clamping force. Ahn et al.[10-11] simulated the corrosion of bolt head or nut by manual cutting method, established the formulas for nut volume loss ratio, weight loss ratio, and RCF, and further proposed a quantification model of the equivalent radius and RFCF of corroded nuts.
Moreover, the anti-slip coefficient is also one of the main factors affecting the anti-slip capacity of the corroded FHSB connections. When the corrosion degree was in the range of 10%-20%, Wang et al.[22] found that the joint contact surface will be damaged, resulting in the reduction of anti-slip coefficient. Hashimoto et al.[23] considered that the anti-slip coefficient and the IFL of FHSB connections increase at the initial stage of corrosion, and then decrease with the deterioration of connection corrosion. Xu and Zhang[24-25] obtained that the IFL of FHSB increases linearly with the increase of overall weight loss rate after corrosion. However, the effect of corrosion on the clamping force was not considered in the study.
Overall, there is a severe lacking of design methods and research results for the residual anti-slip capacity of FHSB T-stub connections with corroded nuts. It is impossible to scientifically replace or maintain such connections after nut corrosion. To solve the problem, this paper tries to quantify the residual anti-slip capacity of FHSB T-stub connections with corroded nuts. Firstly, 48 nuts were manually cut for nut corrosion simulation, which reveals the relationship between the degree of nut sectional damage and the RCF of the bolt. Next, the authors carried out static tests on 24 FHSB connections with nuts whose sections are corroded to different degrees, and determined the failure modes of these connections. Then, a detailed discussion was held on the initial friction load (IFL) and ultimate strength (US) of each connection with corroded nuts, and multiple finite-element (FE) models were established for comparative analysis. Finally, the parameters of 96 FE models for FHSB T-stub connections were analyzed, and used to derive the calculation formulas for the degree of damage for each nut and the residual anti-slip of each connection. The research provides a good reference for replacing and maintaining the FHSB T-stub connections with corroded bolts.
1 Compressive Strength Tests 1.1 SpecimensThe nut corrosion of FHSB T-stub connections was simulated by cutting nut sections with a power reciprocating saw[12]. A total of 24 specimens with different degrees of nut corrosion were prepared, with nut sections with one, two, or three cuts, respectively. Each specimen consists of two connecting plates, two pressure plates, four washers, two bolts, and two nuts. The yield strength and the ultimate tensile strength of the pressure plates were 355.6 MPa and 600.8 MPa, respectively, and the corresponding strength of the connecting plates were 250.3 MPa and 420.4 MPa, respectively. The HSB was M20 bolt and the steel strength grade of the bolt was 10.9S, which means that the yield strength and the ultimate strength of the HSB are 940 and 1040 MPa, respectively. The dimensions and material properties of HSBs are shown in Tables 1 and 2.
| Table 1 Dimension of HSBs |


| Table 2 Material properities of HSBs |
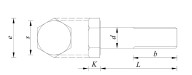
The angle θ between the load direction and the axial direction of the bolt was set to 35° and 60°, respectively. Thus, the shear-compression ratio λ, i.e., tanθ, was set to 0.70 and 1.73, respectively. The components and dimensions of the specimens are illustrated in Fig. 2 and Table 3, where NXS and XS are no sectional damage and sectional damage, respectively; 01-09 are the serial number. The assembly parts, mechanical properties and standard dimensions of the specimens are specified by the Refs.[13] and [26].

|
Fig.2 Components and dimensions of specimens |
| Table 3 Specimens for compressive strength tests |
Then, static load tests were carried out with a pressure testing machine (PTM) to observe the compressive strength of FHSB T-stub connections with the corroded nuts. Two specimens without sectional damage (NXS-35-01-03 and NXS-60-01-03) were selected as control specimens to reveal how the compressive strength changes in the specimens with varied degrees of nut damages (Fig. 3). During the tests, the clamping forces of the 48 bolts on the specimens were measured by the strain gauge, i.e., bolt force sensor (BFS) installed on each bolt[27]. The target clamping force of BFS was set to 170 kN, about 10% higher than the design level. According to the Technical Specification for High Strength Bolt Connections of Steel Structures (JGJ 82-2011), the friction coefficient of contact surfaces was measured as 0.588[28].

|
Fig.3 Artificial sectional damages of FHSB T-stub connections |
1.2 Experimental Procedure
The RCF of each FHSB T-stub connection depends on the decrement of compressive strength induced by the reduced section of bolts. Here, the RCF of each connection is estimated based on the measured residual strain of the bolts, and used to derive the residual IFL and US of FHSB T-stub connections. Clamping forces of 50%, 100%, and 110% of the design level were loaded in advance to the FHSBs of T-stub connections in turn. The strains corresponding to the three-stage clamping force were calculated by BFS linear regression equation. After the bolt strain was stabilized for 48 h, the initial strain of each bolt was recorded before the tests. The bolt clamping force was also deduced by the BFS regression equation. The artificial cutting of nut section was implemented in the following steps:
1) For a one-cut section, cut 4 mm into the washer 4 times along the height of the nut from the outer edge;
2) For a two-cut section, cut 4 mm into the washer 1 time along the height of the nut from one side to the outer edge, and then cut into the washer 4 times from the other side;
3) For a three-cut section, cut 4 mm into any two adjacent sides of the nut in sequence along the height of the nut from the outer edge, and then cut into the washer 4 times along the height of the nut from the other edge.
During the tests, the depth of each cut and the corresponding bolt strain were measured by a vernier caliper and a TDS-530 data logger, respectively. Fig. 4 shows the workflow of the artificial cutting of nut section and the compressive strength tests on the FHSB T-stub connections with cut nuts.

|
Fig.4 Flow chart of the artificial cutting of nut section and the compressive strength tests on the FHSB T-stub connections with cut nuts |
1.3 Load Conditions and Instruments
Each specimen was preloaded at 0.6 mm/min, using a 5MN PTM with a servo hydraulic controller. Two linear variable displacement transformers (LVDTs) were fixed on the connecting plates of the specimen. Then, the bolt strain and the relative slippage along the connecting plate interface were recorded by a TDS-530 data logger. The positions of LVDTs and BFSs are shown in Fig. 5. The test setup is shown in Fig. 6.

|
Fig.5 The positions of LVDTs and BFSs |

|
Fig.6 Test set-up |
2 Relationship Between RCF and Degree of Nut Corrosion 2.1 Variation of Clamping Force with Degrees of Sectional Damage
To evaluate the loss of bolt clamping force with corroded nuts, the authors recorded the degree of sectional damage, cutting depth, and the strain change with degree of sectional damage of each bolt. Prior to the compressive strength tests, the ICFs of all bolts fell between 155.14 kN and 165.89 kN. Fig. 7 shows the relationship between the volume loss ratio of corroded nuts and the clamping force loss ratio (CFLR) of bolts. After nut cutting, all bolts saw different degrees of reduction in clamping force. Since the cutting tool is a handheld power reciprocating saw, it is inevitable to have some cutting errors. Therefore, the degree of damage for each section was only approximately simulated. Despite the inconsistency in cutting degree and depth, different bolts experienced similar trends of clamping force loss. For each specimen, the mean clamping force loss ratio (MCFLR) κ of n bolts can be calculated by
| $ \kappa=\frac{1}{n} \sum\limits_{i=1}^n \frac{P_{i, R}-P_{i, I}}{P_{i, I}} \times 100 \% $ | (1) |

|
Fig.7 Relationship between volume loss ratio of corroded nuts and CFLR of bolts |
where Pi, I, Pi, R are the ICF and RCF of the i-th bolt, respectively.
For the bolts with one-, two-, and three-cut nut sections, the volume loss ratio was 14.19%, 25.44%, and 36.69%, and the mean value of CFLR was 7.68%, 14.45%, and 28.11%, respectively (Table 4).
| Table 4 CFLRs of corroded nuts |
2.2 Derivation of RCF from Degree of Nut Damage
For the FHSBs, the sectional damage of nuts must be considered to ensure the safety and performance of the steel structure. During the maintenance of bolt-connected steel structures, it is no easy task to measure the RCF of FHSB T-stub connections with corroded nut sections. A viable option is to measure the RCF of FHSB T-stub connections through visual inspection or simple measurement of the specimens. Previous studies[10-12] considered the diameter and volume (mass) loss of nuts to estimate the variation in the clamping force of FHSB T-stub connections.
Fig. 8 shows the relationship between the equivalent radius loss ratio of nut and the CFLR of the bolt. The decrement of nut diameter was calculated by the damaged volume of nut. Formulas (2) - (4) are helpful for measuring the degree of RCF of FHSB T-stub connections with severely corroded nut sections in steel structures. The CFLR p′ of each bolt can be calculated by the following regression equation, whose coefficient of determination (R-squared) was calculated as 0.8561:
| $ p^{\prime}=0.403 d^{\prime}-0.013 d^{\prime 2} $ | (2) |

|
Fig.8 Relationship between the equivalent radius loss ratio of nut and CFLR of bolt |
where d′ is the mean decrement of the nut diameter ratio:
| $ d^{\prime}=100 \% \times\left(D^{\prime}-D\right) / D $ | (3) |
where D is the radius of uncorroded nut, D′ is the equivalent radius of corroded nut.
The CFLR p′ value of each bolt can also be calculated by
| $ p^{\prime}=100 \% \times\left(P_{\mathrm{R}}-P_{\mathrm{I}}\right) / P_{\mathrm{I}} $ | (4) |
where PI is the ICF of each bolt, PR is the RCF of each bolt after nut cutting.
Fig. 9 shows the comparison results between the existing literature and this paper. As can be seen from the figure, the clamping force decreases with the decrease of the nut thickness. The equivalent radius loss ratio is 25%, the CFLR is the largest in Ref. [10], and its value is 39.03%; Ref. [20] is the smallest, and its value is 11.05%. The result of this paper is somewhere in between, which is close to the regression results of Ref. [20] in the range of 0-25%.

|
Fig.9 Comparison between the results of existing literature and this paper |
3 Test Results and Analysis 3.1 Failure Modes
All specimens suffered from bolt shear failure, but it was rare for both bolts to be cut off at the same time. A string of crisp sounds was heard when the static friction of the connecting plate interface was overcome. Finally, an ultra-loud sound was heard when the specimen failed. In general, the sound level is negatively correlated with the shear-compression ratio. In addition, the deformation of hole wall is positively correlated with the size of worn area at the center of the interface and around the bolt hole. Fig. 10 shows the failure modes observed during the compressive strength tests.

|
Fig.10 Failure modes |
3.2 Relationship between Compressive Load and Bolt Clamping Force
The relationship between compressive load and bolt clamping force of several specimens is recorded in Fig. 11, where bolts 07-08, bolts 15-16, and bolts 35-38 correspond to nuts 07-08, nuts 15-16, and nuts 35-38, respectively. The bolt clamping force decreased once the connecting plate interface slipped, and the loss belonged to the range of 1.59%-8.89%.

|
Fig.11 Relationship between compressive load and bolt clamping force |
3.3 Relationship Between Compressive Load And Relative Slippage
Fig. 12 presents the compressive load - relative slippage (CLRS) curves of 24 specimens with relatively large relative slippage during the compressive strength tests. Before the initial slippage, the CLRS curve of every specimen was in the elastic stage, and the relative slippage was small between the connecting plates. Once the maximum static friction of the specimen was overcome, the relative displacement between the two plates increased abruptly, causing the connection to slip. As the PTM repeatedly performed the cycle of slippage-unloading-loading-slippage, the CLRS curve of each specimen zigzagged. Finally, the bolts were cut off, as the load surpassed the ultimate strength of the specimen. The following can be learned from these results:

|
Fig.12 Relationship between compressive load and relative slippage of specimens |
1) The CLRS curves of XS-60 specimens with different degrees of nut damages can be divided into four parts: elastic segment, yield segment, hardening segment, and failure segment.
2) The IFL of XS-35 specimens with different degrees of nut damages fell in the range of 2256-2561 kN. During the sliding process, there was a large relative displacement. The friction coefficient of the specimen interface changed significantly, and the wall of the bolt hole quickly converged with the connecting plate. Then, the specimen directly entered the hardening stage. Since the US did not exceed the IFL, the IFL of the connection with a large friction coefficient and a small shear pressure can be regarded as the ultimate load.
3) The smaller the shear-compression ratio, the larger the IFL, and the greater the CLRS fluctuations. In general, the bolt RCF has a positive correlation with the IFL, but no clear effect on the US.
The IFL is related to the friction produced by the bolt clamping force and the compressive component of the load. Any change to the bolt clamping force would alter the friction between connecting plates. The shear capacity of an FHSB T-stub connection with n corroded nuts can be calculated by
| $ N_{\mathrm{R}}=0.9 n \mu n_{\mathrm{f}} P_{\mathrm{R}} $ | (5) |
where n is the number of HSBs, nf is the number of friction surfaces, PR is the RCF of an HSB, μ is the anti-slipping coefficient of the interface. Under the designed value of clamping force P=155 kN, the n HSBs can provide a designed shear capacity Nvb to the connection.
The mechanical properties of 24 specimens with corroded nuts are compared by the IFL and US in Table 5, where the IFL FI refers to the first relative slip load that occurs after the static friction of connecting plates is overcome. The US FU refers to the maximum compressive load applied to the specimens. According to the CLRS curves, the US of XS-35 specimens was regarded as the IFL.
| Table 5 Residual bearing capacities of FHSBs with corroded nuts |
The relationship between the IFL, the US, and the CFLR of the bolts is illustrated in Fig. 13, where the solid line and dotted line stand for linear regression curve and US curve, respectively. Each HSB is designed to provide a shear capacity of 164.05 kN to the connection: Nvb=164.05 kN.

|
Fig.13 Relationship between the IFL, the US, and the CFLR of bolts |
The linear regression of the CFLR of specimens with θ=35° and 60° was implemented by formulas (6) and (7), respectively, whose R-squared values were calculated as 0.7197 and 0.7420, respectively:
| $ \begin{aligned} \frac{F_{\mathrm{I}}}{N_{\mathrm{v}}^{\mathrm{b}}}=7.57 \kappa+13.139 \end{aligned} $ | (6) |
| $ \frac{F_{\mathrm{I}}}{N_{\mathrm{v}}^{\mathrm{b}}}=1.39 \kappa+2.605 $ | (7) |
It can be easily observed that the IFL is correlated with bolt clamping force. For XS-35 and XS-60 specimens, the loss of bolt clamping force was 10%, and the reduction of the IFL was 5.34% and 5.68%, respectively. The US of the XS-60 specimen is not closely related bolt clamping force, but was significantly higher than the IFL. Because the IFL of XS-35 specimens was regarded as the US, the US of these specimens has the same correlation with bolt clamping force as the IFL.
4 FE Simulations 4.1 FE ModelingAbaqus 6.11 was selected as the FE simulation software[29]. Our FE model was established with specimens XS-35 and XS-60 as examples. The pressure plates, connecting plates, and HSBs were meshed into C3D8R elements. The specimens were thus divided into high-quality hexahedron grids. The simulation parameters were configured as follows: for pressure plates, the steel grade is Q345, and the yield stress is 345 MPa; for connecting plates, the steel grade is Q235, and the yield stress is 235 MPa; for HSBs, the yield strength is 940 MPa, and the tensile strength is 1040 MPa; for all these three components, the density, elastic modulus, and Poisson's ratio are 7850 kg/m3, 2.06×10⁶ MPa, and 0.3, respectively.
The shearing of HSB connections involves the following interfaces: the interface between connecting plates, the interface between bolt and hole wall of connecting plate, the interface between bolt and upper and lower surfaces of connecting plate[30]. Among them, the hard contact was applied to the interface between bolt and the normal direction of hole wall; the Coulomb friction was applied to the friction between the bolt and the tangential direction of the outer surface of the connecting plate, and the hard contact was applied to the normal direction with the anti-slippage coefficient of 0.2[31]. Further, fully-constrained boundary conditions were adopted for the compressed surface of pressure plate. The bolt clamping force was loaded by calling the Bolt Load command. Fig. 14 shows interfaces and boundary conditions of the FE model. The constitutive relation of steel was described with the elastoplastic stress-strain curve of the two-fold line, and that of HSB material with the multi-linear elastoplastic stress-strain curve. By displacement loading, a side of pressure plate paralleled to the ground was loaded in two steps:

|
Fig.14 Interfaces and boundary conditions of the FE model |
1) Apply uniform pressure to the specified section of the HSB, and simulate the ICF of the bolt;
2) Apply displacement load (maximum displacement: 15 mm).
4.2 Validation of Test ResultsFig. 15 shows the stress nephogram of the finite element model. When the compressive load reached a certain level, every FHSB T-stub connection suffered from the shear failure of bolts along the connecting plate interface, which is consistent with the test results.

|
Fig.15 Stress nephogram of the finite element model |
Fig. 16 compares the test results with simulation results. It can be observed that: 1) the IFL calculated by the FE model is linearly correlated with the clamping force loss, which agrees with the change law reflected by the test results; 2) the US of the XS-35 specimen calculated by the FE model has no clear relationship with clamping force loss, but its value is much higher than the test value. The main reason is that when the XS-35 test specimen slips, the friction coefficient changes on the connecting plate interface. But the FE model does not consider this variation, and treats the coefficient as a constant.

|
Fig.16 Comparison between simulation and test results |
For the XS-35 specimen, the mean absolute error (MAE) of the IFL was 4.34%, and the MAE of the US was 42.28%; for the XS-60 specimen, the MAE of the IFL was 4.78%, and that of the US was 2.29%. Thus, the US of the XS-35 specimen, with a friction coefficient greater than 0.588, was regarded as the IFL. Overall, our FE model can simulate the failure mode, IFL, and US of the FHSB T-stub connections well, laying a good basis for parameter analysis. Table 6 compares the IFLs and USs obtained by simulation and test.
| Table 6 Comparison between simulated and test IFLs and USs |
4.3 Parameter Analysis
The proposed FE model was adopted for parameter analysis to provide more insights into the load-bearing capacity of FHSB T-stub connections. The parameter analysis involves a total of 96 FE models, which consider shear-compression ratio, friction coefficient, and bolt clamping force. The shear-compression ratio was set to four levels: 0.70, 1.00, 1.43 and 1.73. The θ angle was set to 35° and 45° for pressure plates of 153×92×30×170×40 mm, and 55° and 60° for pressure plates of 172×65×30×170×40 mm (the parameters of connecting plates and bolt were the same). The friction coefficient was set to four levels in [0.3, 0.6]. The bolt clamping force was set to five levels: 85, 102, 120, 155, and 170 kN. Drawing on the test results, the IFL of the model whose shear-compression ratio is 0.70, and friction coefficient of 0.6 was adopted as the US. Fig. 17 shows the relationship between the IFL and the RCF under the different design parameters. In general, the IFL increased linearly with the growing bolt clamping force.

|
Fig.17 Relationship between the IFL and RCF under different design parameters |
5 Residual Capacity Analysis
Considering the effects of μ, λ and PR on the IFL, the authors derived the regression equation of the IFL of FHSB T-stub connections under both shear and compression. The component forces of the IFL in the tangential and normal directions of the interface can be respectively expressed as
| $F_{\mathrm{v}}=F_{\mathrm{I}} \sin \theta $ | (8) |
| $ F_{\mathrm{N}}=F_{\mathrm{I}} \cos \theta $ | (9) |
To establish the relationship between the degree of nut damage and the IFL under different design parameters, the linear relationship between Fv/NR and μFN/NR can be defined as
| $\frac{F_{\mathrm{v}}}{N_{\mathrm{R}}}=a \frac{\mu F_{\mathrm{N}}}{N_{\mathrm{R}}}+b $ | (10) |
where a and b are linear correlation coefficients.
Fig. 18 displays the IFL linear regression curves of the 96 FE models. The R-squared of the regression equation was calculated as 0.9938. The linear correlation coefficients a =0.963 and b =1.679. Fig. 19 shows the US linear regression curves of the 96 FE models. The R-squared of the regression equation was calculated as 0.7314. The linear correlation coefficients a=1.122 and b=3.617.

|
Fig.18 Relationship between the IFL and different parameters |

|
Fig.19 Relationship between the US and different parameters |
Substituting formulas (8) and (9) to formula (10), the IFL can be derived as
| $F_{\mathrm{I}}=\frac{1.679}{\sin \theta-0.963 \mu \cos \theta} N_{\mathrm{R}} $ | (11) |
Substituting formulas (2) - (5) into formula (11), the IFL of n bolts on the FHSB T-stub connection can be calculated by
| $ F_{\mathrm{I}}=\sum\limits_{i=1}^n \frac{1.511 \mu}{\sin \theta-0.963 \mu \cos \theta}\left[1+0.403\left(\frac{D^{\prime}-D}{D}\right)-\right.\\ \left.0.013\left(\frac{D^{\prime}-D}{D}\right)^2\right] P_{i, \mathrm{I}} $ | (12) |
Similarly, combined with the test results, the US of n bolts on the FHSB T-stub connection can be calculated by
| $ F_{\mathrm{U}}=\left\{\begin{array}{l} \sum\limits_{i=1}^n \frac{3.255 \mu}{\sin \theta-1.122 \mu \cos \theta}\left[1+0.403\left(\frac{D^{\prime}-D}{D}\right)-\right. \\ \left.0.013\left(\frac{D^{\prime}-D^2}{D}\right)^2\right] P_{i, 1}, \mu <0.588 \text { and } \lambda>0.70 \\ F_l, \quad \mu \geqslant 0.588 \text { and } \lambda \leqslant 0.70 \end{array}\right. $ | (13) |
Formulas (12) and (13) can quantify the residual IFL and US of FHSB T-stub connections based on the degree of nut damage.
6 ConclusionsThis paper tries to quantify the residual anti-slip capacity of the FHSB T-stub connections with corroded nuts. To simulate nut corrosion, an electric reciprocating saw was used to artificially cut the nuts in 48 FHSB T-stub connections. Then, static tests were carried out on 24 FHSB T-stub connections with different degrees of nut damage. Next, the test results were compared and verified by FE simulation. Finally, the authors carried out a parameter analysis on 96 FE models of FHSB T-stub connections. The main conclusions are as follows:
1) Despite the inconsistency in cutting degree and depth, different bolts experienced similar trends of clamping force loss. For the bolts with one-, two-, and three-cut nut sections, the volume loss ratio was 14.19%, 25.44%, and 36.69%, and the mean value of CFLR was 7.68%, 14.45%, and 28.11%, respectively.
2) After regression analysis on equivalent radius loss ratio of nut and the CFLR of the bolt, the obtained RCF formulas are helpful for the RCF evaluation of bolts with corroded nuts.
3) All FHSB T-stub connections suffer from bolt shear failure. The clamping force loss within 30% does not affect the failure mode of these connections. The IFL of the connections, with a large friction coefficient and a small shear pressure, is the ultimate load.
4) The IFL of the FHSB T-stub connections with corroded nuts mainly depends on the external load and the static friction induced by the RCF of the bolt on the interface of connecting plates. The IFL is obviously linearly correlated with bolt clamping force, which has no obvious influence on the US of the connection.
5) The failure mode observed by the FE model is consistent with the test results. The US of the connection, with a large friction coefficient and a small shear pressure, is regarded as the IFL. The MAEs of the IFL and US are controlled within 5%. The proposed FE model can be used for parameter analysis of anti-sliding bearing capacity.
6) The IFL and US formulas of FHSB T-stub connections can quantify the residual anti-slip capacity of the connections according to the degree of nut damage, laying a scientific basis for replacing and maintaining the bolts after nut corrosion.
| [1] |
Guo S C, Si R Z, Dai Q L, et al. A critical review of corrosion development and rust removal techniques on the structural/environmental performance of corroded steel bridges. Journal of Cleaner Production, 2019, 233: 126-146. DOI:10.1016/j.jclepro.2019.06.023 (  0) 0) |
| [2] |
Krivy V, Urban V, Kreislova K. Development and failures of corrosion layers on typical surfaces of weathering steel bridges. Engineering Failure Analysis, 2019, 69: 147-160. DOI:10.1016/j.engfailanal.2015.12.007 ( 0) |
| [3] |
Tewary N K, Kundu A, Nandi R, et al. Microstructural characterisation and corrosion performance of old railway girder bridge steel and modern weathering structural steel. Corrosion Science, 2016, 113: 57-63. DOI:10.1016/j.corsci.2016.10.004 ( 0) |
| [4] |
Sharifi Y, Paik J K. Ultimate strength reliability analysis of corroded steel-box girder bridges. Thin-Walled Structures, 2011, 49(1): 157-166. DOI:10.1016/j.tws.2010.09.001 ( 0) |
| [5] |
Darmawan M S, Refani A N, Irmawan M, et al. Time dependent reliability analysis of steel I bridge girder designed based on SNI T-02-2005 and SNI T-3-2005 subjected to corrosion. Procedia Engineering, 2013, 54: 270-285. DOI:10.1016/j.proeng.2013.03.025 ( 0) |
| [6] |
Krivy V, Kubzova K, Urban V. Experimental corrosion tests on weathering steel bridges. Solid State Phenomena, 2015, 227: 537-540. DOI:10.4028/www.scientific.net/SSP.227.537 ( 0) |
| [7] |
Kere K J, Huang Q D. Life-cycle cost comparison of corrosion management strategies for steel bridges. Journal of Bridge Engineering, 2019, 24(4): 04019007. DOI:10.1061/(ASCE)BE.1943-5592.0001361 ( 0) |
| [8] |
Bueno A H S, Moreira E D, Gomes J A C P. Evaluation of stress corrosion cracking and hydrogen embrittlement in an API grade steel. Engineering Failure Analysis, 2014, 36: 423-431. DOI:10.1016/j.engfailanal.2013.11.012 ( 0) |
| [9] |
Fu Z Q, Ji B H, Zhao D D, et al. Corrosion evaluation of steel material on steel box girder bridge by comprehensive scoring method. Materials Research Innovations, 2014, 18(S2): 840-844. DOI:10.1179/1432891714Z.000000000465 ( 0) |
| [10] |
Ahn J H, You J M, Huh J W, et al. Residual clamping force of bolt connections by sectional damage of nuts. Journal of Constructional Steel Research, 2017, 136: 204-214. DOI:10.1016/j.jcsr.2017.05.019 ( 0) |
| [11] |
Ahn J H, Lee J M, Cheung J H, et al. Clamping force loss of high-strength bolts as a result of bolt head corrosion damage: Experimental research A. Engineering Failure Analysis, 2016, 59: 509-525. DOI:10.1016/j.engfailanal.2015.08.037 ( 0) |
| [12] |
Kim I T, Lee J M, Huh J W, et al. Tensile behaviors of friction bolt connection with bolt head corrosion damage: experimental research B. Engineering Failure Analysis, 2016, 59: 526-543. DOI:10.1016/j.engfailanal.2015.08.038 ( 0) |
| [13] |
Xu G N, Wang Y Z, Du Y F, et al. Static strength of friction-type high-strength bolted T-stub connections under shear and compression. Applied Sciences, 2020, 10(10): 3600. DOI:10.3390/app10103600 ( 0) |
| [14] |
Mikami I, Tanaka S, Hiwatashi T. Neural network system for reasoning residual axial forces of high-strength bolts in steel bridges. Computer-Aided Civil Infrastructure Engineering, 1998, 13(4): 237-246. DOI:10.1111/0885-9507.00102 ( 0) |
| [15] |
Hirokane M, Nakata H, Konishi H. Diagnosis for axial force of high-strength bolts using pattern recognition. Journal of Japan Society of Civil Engineers Ser F6 (Safety Problem), 2013, 69(2): 69-74. DOI:10.1061/9780784413609.261 ( 0) |
| [16] |
Zhang J, Gu L Y, Qian X L, et al. Ultrasonic measurement of high strength bolt axial tension in steel construction. Chinese Journal of Mechanical Engineering, 2006, 42(2): 216-220. ( 0) |
| [17] |
Yang J, DeWolf J T. Mathematical model for relaxation in high-strength bolted connections. Journal of Structural Engineering, 1999, 125(8): 803-809. DOI:10.1061/(ASCE)0733-9445(1999)125:8(803) ( 0) |
| [18] |
Kulak G L, Fisher J W, Struik J H A. Guide to Design Criteria for Bolted and Riveted Joints. 2nd ed. Chicago: American Institute of Steel Construction, 2001.
( 0) |
| [19] |
Natori T, Nishikawa K, Murakoshi J, et al. Study on characteristics of corrosion damages in steel bridge members. Journal of Japan Society of Civil Engineers, 2001, 668: 299-311. DOI:10.2208/jscej.2001.668_299 ( 0) |
| [20] |
Shimozato T, Tai M, Nagamine Y, et al. Characteristic of residual axial force for high-strength bolts with corrosion shape. Journal of Structural Engineering A, 2016, 62A: 503-513. DOI:10.11532/structcivil.62A.503 ( 0) |
| [21] |
Tai M, Shimozato T, Nagamine Y, et al. Dependence of residual axial force on thickness and shape in corroded high-strength bolts. Journal of Structural Engineering, 2018, 144(7): 04018069. DOI:10.1061/(ASCE)ST.1943-541X.0002078 ( 0) |
| [22] |
Wang H L, Tang F J, Qin S F, et al. Corrosion-induced mechanical degradation of high-strength bolted steel connection. Journal of Materials in Civil Engineering, 2020, 32(8): 04020203. DOI:10.1061/(ASCE)MT.1943-5533.0003275 ( 0) |
| [23] |
Hashimoto K, Tsukiji T, Sugiura K. Experimental study on remaining strength of high strength bolted joint after corrosion. Journal of Japan Society of Civil Engineers Ser A1, 2013, 69(2): 159-173. DOI:10.2208/jscejseee.69.159 ( 0) |
| [24] |
Xu S H, Lin X C, Qiu B, et al. Corrosion of high strength steel bolt friction type connection test of performance degradation. Advanced Materials Research, 2011, 368-373: 428-431. DOI:10.4028/www.scientific.net/AMR.368-373.428 ( 0) |
| [25] |
Zhang M. Experimental Study on Corroded Frictional Connection Performance Degradation of High-Strength Bolts in Steel Structures. Xi'an: Xi'an University of Architecture and Technology, 2011.
( 0) |
| [26] |
Ministry of Housing and Urban-Rural Development (MOHURD). GB 50017-2017. Code for design of steel structure. Beijing: Ministry of Housing and Urban-Rural Development (MOHURD), 2017.
( 0) |
| [27] |
Liu X C, He X N, Wang H X, et al. Compression-bending-shearing performance of column-to-column bolted-flange connections in prefabricated multi-high-rise steel structures. Engineering Structures, 2018, 160: 439-460. DOI:10.1016/j.engstruct.2018.01.026 ( 0) |
| [28] |
Ministry of Housing and Urban-Rural Development (MOHURD). Technical specification for high strength bolt connections of steel structures. JGJ 82-2011. Beijing: Ministry of Housing and Urban-Rural Development (MOHURD), 2011.
( 0) |
| [29] |
Dassault Systemes Simulia Corporation. Abaqus Analysis User's Manual, Version 6.11-2. Johnston, RI, USA: Dassault Systemes Simulia Corporation, 2012.
( 0) |
| [30] |
Grimsmo E L, Aalberg A, Langseth M, et al. Failure modes of bolt and nut assemblies under tensile loading. Journal of Constructional Steel Research, 2016, 126: 15-25. DOI:10.1016/j.jcsr.2016.06.023 ( 0) |
| [31] |
D'Antimo M, Demonceau J F, Jaspart J P, et al. Experimental and theoretical analysis of shear bolted connections for tubular structures. Journal of Constructional Steel Research, 2017, 138: 264-282. DOI:10.1016/j.jcsr.2017.07.015 ( 0) |