2. Guangdong Provincial Key Lab. of Petrochemical Equipment and Fault Diagnosis, School of Automation, Guangdong University of Petrochemical Technology, Maoming 525000, Guangdong, China
The ethylene cracking furnace is one of the key devices in the ethylene production process, and its temperature variation directly indicates whether the cracking furnace is operating well or not [1]. In the actual production process, there exists a small number of outliers in the cracking furnace temperature data, and the appearance of the outliers directly affects the safety monitoring and hidden danger warning of the cracking furnace production process[2-4]. Therefore, it is of practical engineering and researching significance to detect outliers from the collected temperature data, and then detect unstable events such as furnace tube coking to ensure normal and stable operation of the cracker.
The outlier detection of sampling time series is a hot topic in the field of data diagnosis. Commonly used methods for outlier detection include statistical analysis, 3 σ principle[5], box plot analysis[6], LOF algorithm[7], Isolation Forest algorithm[8], etc. For example, Ref.[9] detects outliers in the ATM transaction statistics of a commercial bank using the method of calculating the martingale distance between sample observations and sample centers, the Isolation Forest algorithm and the self-encoder method respectively. The results showed that the Isolation Forest-based detection algorithm can accurately detect outliers on small and medium-sized data sets. In Ref.[10], an efficient algorithm based on the K-neighborhood algorithm, combined with the segmentation method for time series anomaly pattern detection is proposed, which can efficiently discover anomaly patterns in time series. Ref. [11] proposed an outlier detection algorithm which fuses local density and global distance and verified that the detection accuracy of this method is better than other outlier detection algorithms such as the classical LOF algorithm, RDOS algorithm and INFLO algorithm. Ref.[12] proposed the DOKM algorithm for outlier detection based on distance criterion, which judges outliers based on K-means method. The experimental results showed that the algorithm can effectively detect outliers in both artificial and real datasets. Ref.[13] proposed a spatial outlier mining method by applying the spatially localized sharp outlier coefficient SLOF, which can quickly and effectively detect spatially localized outliers using multidimensional monitoring data. Ref.[14] proposed a density-based local outlier detection algorithm DLOF, which determines the outlier attributes of each object by introducing information entropy, and the theoretical analysis and experimental results showed that the method can effectively detect the local outliers in the data.
The method proposed above have good outlier detection performance on small or medium-sized dataset, when facing a larger scale of data, the computational complexity and detection time increase significantly. Thus, this paper proposed an algorithm for outliers detection in temperature data based on CLOF (Clipping Local Outlier Factor, CLOF), which reduces the computational complexity and rises the detection accuracy of conventional LOF algorithm by data clipping. While ensuring detection accuracy, the proposed algorithm is also more efficient.
The structure of the paper is as follows. In Section 1 the outlier detection algorithm based on CLOF and the detection evaluation index are established. In Section 2 the proposed algorithm is simulated on the measured data to determine the optimal parameters of CLOF algorithm. Then the detection results of CLOF algorithm, Isolation Forest algorithm and conventional LOF algorithm are compared respectively. In Section 3, the research work done in this paper is summarized and the main conclusions are given.
1 Outlier Detection Algorithm Based on CLOFThe outlier detection of cracking furnace temperature data is of great significance for monitoring whether the combustion furnace is operating well. In this section, an outlier detection method for furnace temperature data based on data clipping is proposed, clustering and pruning pre-processing are performed on the one-dimensional time series {(t1, x(t1)), (t2, x(t2)), …, (tn, x(tn))}. Specifically, x(ti) is the temperature data of time ti. After pre-processing, an outlier candidate set is obtained, using the LOF algorithm[15] to calculate the local outlier factor value of the data point in the outlier candidate set, and whether the data point is an outlier in the data is determined.
1.1 Local Outlier Factor AlgorithmLOF algorithm is a density-based outlier detection algorithm which is capable to determine whether the data is an outlier or not with high accuracy by calculating its local outlier factor. The outlier detection process of LOF algorithm is as follows.
Step 1: For each (ti, x(ti)) and (tj, x(tj)) in the time series, calculate the Euclidean distance dis.
Step 2: Determine the K-neighborhood and K-neighborhood distance of each (ti, x(ti)).
Step 3: For each (ti, x(ti)), (to, x(to)) is the point within its K-neighborhood, find their local reachable density ρ(x(ti)) and ρ(x(to)).
| $ \rho\left(x\left(t_i\right)\right)=\frac{N\left(x\left(t_o\right)\right)}{\sum\limits_{j=1}^{N\left(x\left(t_o\right)\right)} d\left(x\left(t_i\right), x_j\left(t_o\right)\right)} $ | (1) |
| $ \rho\left(x\left(t_o\right)\right)=\frac{N\left(x\left(t_k\right)\right)}{\sum\limits_{j=1}^{N\left(x\left(t_k\right)\right)} d\left(x\left(t_o\right), x_j\left(t_k\right)\right)} $ | (2) |
where N(x(to)) refers to the amount of (to, x(to)), dn(x(ti), x(to)) is the reachable distance between (ti, x(ti)) and (to, x(to)).(tk, x(tk)) is the point within the K-neighborhood of(to, x(to)).
Step 4: The Local Outlier Factor(LOF) value for each data point (ti, x(ti)) is calculated as follows[15].
| $\mathrm{LOF}=\frac{\sum\limits_{j=1}^{N\left(x\left(t_o\right)\right)} \rho_j\left(x\left(t_o\right)\right)}{N\left(x\left(t_o\right)\right) \cdot \rho\left(x\left(t_i\right)\right)} $ | (3) |
Step 5: Discriminate the outliers according to the LOF. When LOF>1, the point is an outlier.
When using the LOF algorithm for outlier detection, the LOF value is calculated point by point to determine whether the corresponding data point is an outlier. The increase in the size of the input data leads to an increase in the number of basic operations performed in the program and a longer running time of the corresponding program, which is not conducive to the timely and accurate detection of outliers in the data in practice.
1.2 Data Clipping Algorithm DesignIt is computationally intensive and time-consuming to use the LOF algorithm to detect the outliers in the original data. In this paper, a data clipping preprocessing algorithm is proposed to eliminate the normal data. The algorithm is based on the thought of segmental clustering which divides the data into uniform sequences of segments for data clipping. K-means clustering method[16] has good clustering effect and fast convergence, so the K-means clustering method is used to cluster the original data in the paper. The clustering process uses Euclidean distance as the distance measure, and set the sum of distance squares to be the clustering objective function.
| $ S=\sum\limits_{m=1}^K \operatorname{dis}^2\left[C_m, \left(t_i, x\left(t_i\right)\right)_m\right] $ | (4) |
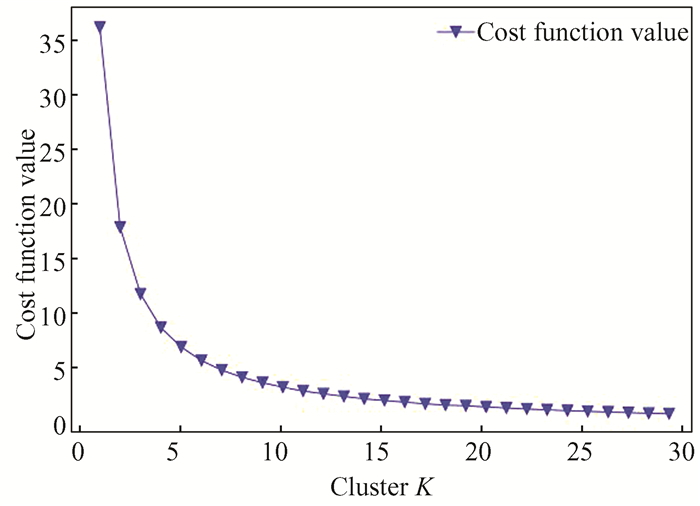
where (ti, x(ti))m is all the data points within cluster m and Cm denotes the center point of each cluster.dis represents the Euclidean distance between the data points and the cluster center. The clustering is completed when the clustering objective function S < 10-4.The number of clusters K is determined by the elbow rule[17], which states that the value of K can choose the one when the decrease of the cost function is maximum and the cost function is as follows.
| $J_k=\sum\limits_{m=1}^K \frac{\left(\left(t_i, x\left(t_i\right)\right)_m-C_m\right)^2}{N\left[\left(t_i, x\left(t_i\right)\right)_m\right]} $ | (5) |
where N[(ti, x(ti))m] is the amount of data points within the cluster m. According to the data features used in this paper, set K=3, which means the original data is divided into 3 clusters. The flow chart of the clustering algorithm is shown in Fig. 1.
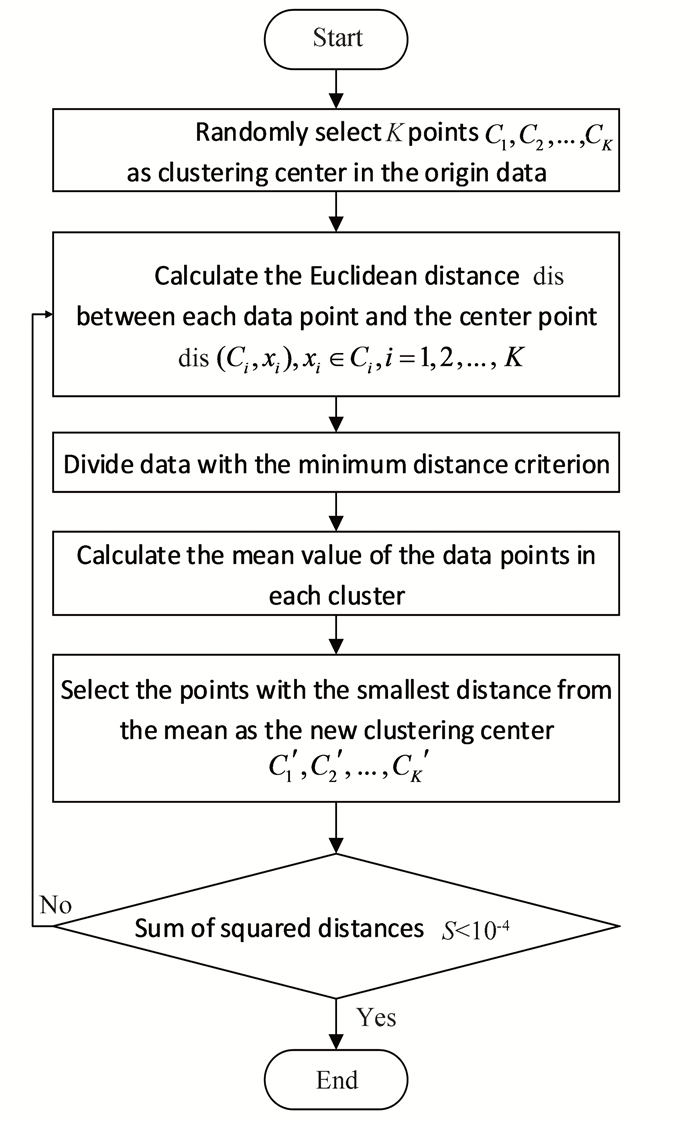
|
Fig.1 K-means clustering flow chart |
The data in each clustering cluster are clipped respectively to obtain the outlier candidate set. The flowchart of the data clipping algorithm proposed in this paper is shown in Fig. 2. The specific calculation steps of the clipping algorithm are as follows.
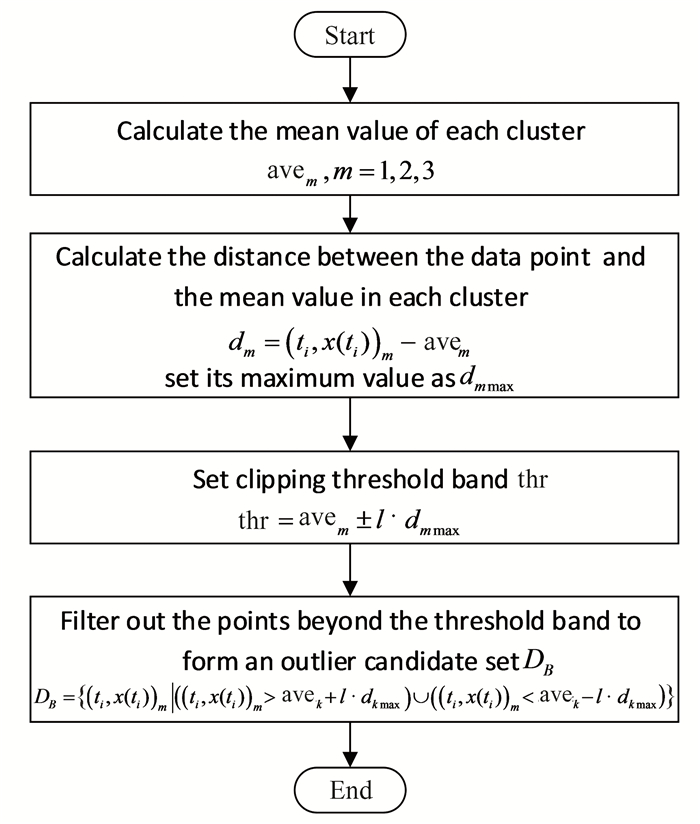
|
Fig.2 Data pruning flow chart |
Step 1: Divide the data into 3 clusters based on the K-means method, namely C1, C2, C3. The amount of the data points contained in each cluster is N(1), N(2), N(3), and the data point in each cluster is (ti, x(ti))1, (ti, x(ti))2, (ti, x(ti))3. For each cluster, the mean value of the data in the cluster is avem.
| $ \mathrm{ave}_m=\frac{\sum\limits_{m=1}^{N(m)}\left(t_i, x\left(t_i\right)\right)_m}{N\left[\left(t_i, x\left(t_i\right)\right)_m\right]}, m=1, 2, 3 $ | (6) |
Step 2: Calculate the distance dm between all data points (ti, x(ti))m and the mean value avem in each cluster.
| $d_m=\left(t_i, x\left(t_i\right)\right)_m-\text { ave }_m, m=1, 2, 3 $ | (7) |
And set the max value as dmmax.
Step 3: Set the clipping threshold as thr, which is described as following.
| $ \text { thr }=\operatorname{ave}_m \pm l \cdot d_{m \max } $ | (8) |
where l reference to the cropping factor to determine the width of the threshold band and can be set artificially. All the data points in each cluster are selected according to thr, the data points which are outside the range of the threshold band are sorted to the outlier candidate set DB.
| $ \begin{aligned} D_B= & \left\{\left(t_i, x\left(t_i\right)\right) \mid\left(\left(t_i, x\left(t_i\right)\right)>\text { ave }_m+\right.\right. \\ & \left.\left.l \cdot d_{\text {max }}\right) \cup\left(\left(t_i, x\left(t_i\right)\right)<\text { ave }_m-l \cdot d_{\text {max }}\right)\right\} \end{aligned} $ | (9) |
The outlier candidate set DB contains data points that are distant from most of the data in the original time series {(t1, x(t1)), (t2, x(t2)), …, (tn, x(tn))}. When using the LOF algorithm to detect the outliers, only the data points in DB need to be judged, which clearly improves the detection efficiency greatly.
1.3 Outliers Detection of Time Series Data Based on CLOFThe one-dimensional time series {(t1, x(t1)), (t2, x(t2)), …, (tn, x(tn))} used in this paper is the measured data of the temperature sensor of an ethylene cracking furnace with a sampling interval of 1 min and a duration of 24 h, with a total data amount of 1441.
Temperature sensors are usually set at different locations in the pipe in an ethylene cracker to detect temperature changes in the cracking furnace chamber. This paper illustrates the effectiveness of this method by detecting outliers from the sampled data of one of the sensors, and similarly, this method is applicable to the detection of outliers from the sampled data of temperature sensors at other locations in the heating furnace chamber.
The overall flow diagram of the CLOF algorithm is shown in Fig. 3.

|
Fig.3 Schematic diagram of Clipping-LOF algorithm flow chart |
Specifically, the outliers detection process of the CLOF algorithm is as follows.
Step 1: The data {(t1, x(t1)), (t2, x(t2)), …, (tn, x(tn))} is divided into 3 clusters C1, C2, C3, and the mean value of each cluster is avem.
Step 2: In each cluster, calculate the distance between the data point (ti, x(ti))m and avem, and the max value is dmmax, set the clipping threshold thr=avem±l·dmmax.
Step 3: Each data point is compared with the threshold thr to sort out DB.
Step 4: For each data point (ti, x(ti)) in DB, calculate the Euclidean distance dis between (ti, x(ti)) and (tj, x(tj))
Step 5: The K-neighborhood and K-neighborhood distance of each point (ti, x(ti)) in DB is determined.
Step 6: Calculate the local reachable density ρ(x(ti)) of each data point in DB and the local reachable density ρ(x(to)) of each data point within the K-neighborhood of (ti, x(ti)).
Step 7: Calculate the LOF value of each data point in DB, the point is an outlier when LOF>1.
In summary, the CLOF algorithm clips the original data and detects the outliers in the outlier candidate set DB to obtain accurate outliers, i.e., detect the outliers in the original data.
1.4 Evaluation Index of Outlier Detection EffectThe total number of data points is N, the number of the cropped data is NX(C), the number of the outliers contained in the raw data is NX(D), the number of the outliers detected by the algorithm is NX(D)', the number of the normal data points that are detected as outliers is NX(E).Using the detection accuracy ACC, clipping CR, program running time T, commutation amount NC as the detection effect evaluation index to describe the detection result.
(1) Detection accuracy ACC:
| $ \mathrm{ACC}=\frac{N_{X(D)}^{\prime}}{N_{X(D)}} \times 100 \% $ | (10) |
Detection accuracy includes misdetection rate ACCO and missing detection rate ACCL, when NX(D)' < NX(D), missing detection rate ACCL appears:
| $\mathrm{ACC}_L=\frac{\left(N_{X(D)}-N_{X(D)}^{\prime}\right)}{N_{X(D)}} \times 100 \% $ | (11) |
When the algorithm detects normal points as outliers, misdetection rate ACCO appears:
| $\mathrm{ACC}_0=\frac{N_{X(E)}}{N_{X(N)}-N_{X(D)}} \times 100 \% $ | (12) |
(2) Cropping rate CR:
| $ C_R=\frac{n_{X(N)}-n_{X(C)}}{n_{X(N)}} \times 100 \% $ | (13) |
(3) Program running time T.
(4) Commutation amount NC.
2 Simulation Calculation and Result Analysis 2.1 Computer ConfigurationThe computer is installed with 64-bit Windows 11 operating system, Intel(R) Core(TM) i5-9400F CPU, NVIDIA Geforce Titan GTX 1650 graphics card, 8G DDR4 RAM, and Kingston 480GB SSD SATA3.0 hard drive. The simulation results shown in the paper are obtained with the above configuration.
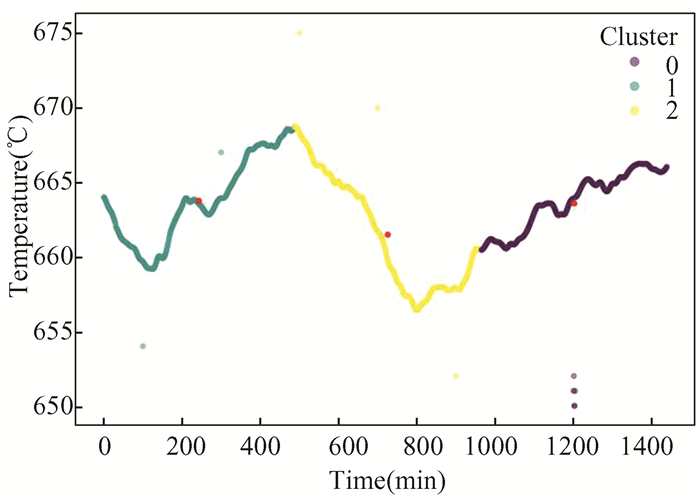
2.2 Analysis of Experimental Results 2.2.1 Parameters selection of CLOF algorithmThe data used for the experiments are actual ethylene cracker flue temperature data provided by a petrochemical site with a sampling interval of 1 min and a duration of 24 h, and all simulation results are obtained under the same computer. The main parameters of CLOF algorithm are the number of cluster K and the clipping factor l, the actual values above are both selected based on the abnormal detection effect. Before clipping the data based on the clipping algorithm, the K-means clustering method is used to cluster the data, and the number of clusters K is determined by the elbow rule. Using the elbow rule for the original data, the corresponding cost function values under different K values are calculated as shown in Fig. 4. By analyzing Fig. 4, the optimal number of classification clusters can be obtained as K=3, so in this paper, the original data are clustered into 3 clusters, and the clustering results are shown in Fig. 5. The curves of the same color in the figure correspond to the same cluster of data.
|
Fig.4 Cost function values for different K values |
|
Fig.5 Clustering results |
The data clipping algorithm proposed in this paper is used to clip the clustered data. By setting the clipping coefficient l to filter out the data points within the threshold band thr. In order to obtain the corresponding clipping coefficient l when the outlier detection effect is optimal, set the clipping coefficient l to 0.05, 0.1, 0.2, 0.25, 0.3 and 0.39 respectively, and use the LOF algorithm to detect each point in the outlier candidate set. The corresponding outlier detection performance indicators under different clipping coefficients are shown in Table 1.
| Table 1 Outlier detection performance indicators under different clipping coefficients |
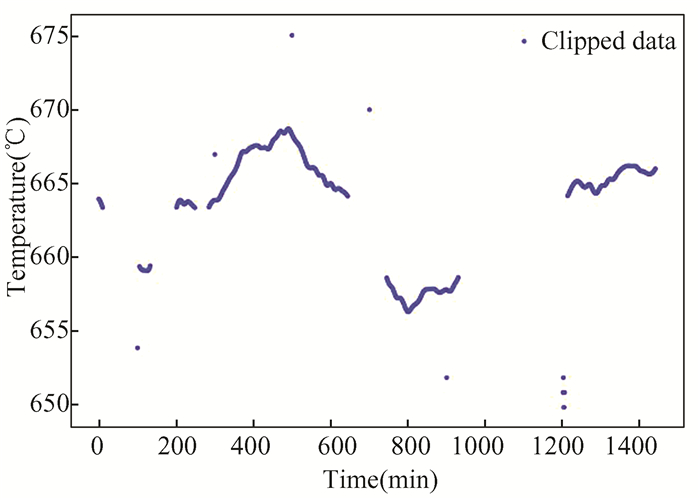
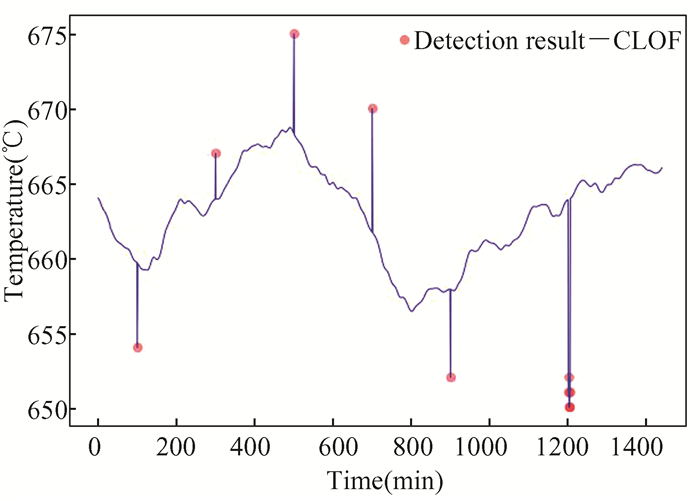
It can be seen from Table 1 that the increase of the clipping coefficient l reduces the number of data points contained in the outlier candidate set and the number of basic operations executed in the program, and the program running time decreases. When l=0.3, due to the increase in the number of clipping operations, the running time of the program rebounds. When l=0.39, the clipping effect is too strong resulting in some of the outliers being pruned as well, which leads to the miss-detection. When l=0.2, the outlier candidate set obtained after clipping is shown in Fig. 6, it can be seen that the data clipping algorithm sorts out most of the normal data points. The points in the outlier candidate set are detected, and the results are shown in Fig. 7, and the circle marked points in the figure are the identified outliers.
|
Fig.6 Data cropping results at l=0.2 |
|
Fig.7 Detection result of CLOF |
From Table 1, Fig. 6 and Fig. 7, it can be seen that when the clipping coefficient l=0.2, the data clipping algorithm reduces the scale of the input data to 43.9%. On the premise of ensuring the detection accuracy, the reduction of the data volume makes the number of basic operations in the program reduced, the program running time is also the shortest, and the experimental effect is the best. Therefore, in the comparative experiment, set the clipping factor l=0.2.
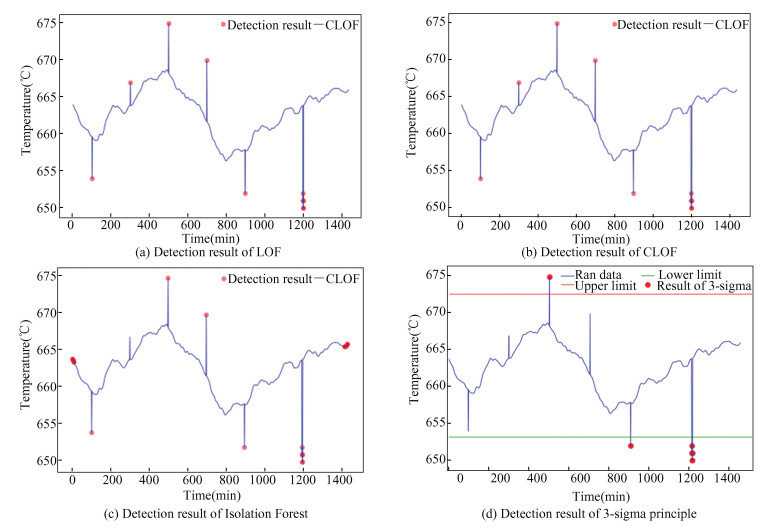
2.2.2 Comparison of detection effects of different outlier detection methodsIn order to compare the outlier detection effect based on CLOF with other classical outlier detection algorithms, the outlier detection algorithm based on the Isolation Forest algorithm, 3-sigma principle, the LOF algorithm and the CLOF outlier detection algorithm when the clipping coefficient is l=0.2 are used to detect the outliers in the original data respectively. Among them, the isolation forest algorithm[18] is an unsupervised outlier detection algorithm for continuous data. The detection effects are shown in Fig. 8, and the outlier detection performance index is shown in Table 2. The circled points in the figure are the identified outliers.
|
Fig.8 Detection result of different abnormal detection algorithm |
| Table 2 Outlier detection performance indicators |
It can be seen from Fig. 8 and Table 2 that the outlier detection algorithm based on the isolated forest algorithm cannot completely identify the outliers in the original data, and misjudges 4.2% of the normal data as outliers, the detection accuracy is low. The 3-sigma principle cannot detect all the outliers contained in the raw data, besides, it costs almost 1 s to do all the calculations, which is severely time consuming. The LOF algorithm can accurately detect all the outliers contained in the original data with 100% detection accuracy, but the amount of data to be processed is 1441, and the number of basic operations performed in the program is up to thousands of times, resulting in a longer running time for the LOF algorithm-based program under the same operating environment. The CLOF algorithm with clipping factor l=0.2 can not only accurately detect all the outliers in the original data, but also filter out 56.1% of the data points in the original data, which reduces the number of basic operations in the program on the premise of ensuring the detection accuracy, and the running time of the program is also the shortest, and the detection effect is the best. The rationality and effectiveness of the proposed algorithm are verified.
3 ConclusionsThe outlier detection of cracking furnace flue temperature measurement data based on CLOF algorithm can detect data anomalies caused by abnormal working conditions or abnormal behavior of the equipment, so that the causes of the equipment anomalies can be identified and corresponding measures can be taken to ensure the normal production process, which is of practical significance to the current production process of petrochemical industry. In the paper, an outlier detection algorithm that incorporates K-means clustering algorithm, clipping algorithm and LOF algorithm is proposed for the detection of outliers in ethylene cracker flue temperature data with high detection accuracy. The method uses K-means clustering algorithm, clipping algorithm and LOF algorithm to form a CLOF algorithm for flue measurement data outliers detection, and achieves clustering clipping and outlier detection for ethylene cracker flue temperature data. The paper not only gives the specific flow of the algorithm, but also uses the actual measurement data for experimental analysis, and compares the CLOF-based anomaly detection algorithm with the classical LOF algorithm and the isolated forest algorithm-based anomaly detection algorithm for analysis.
The results show that the proposed CLOF-based outlier detection algorithm for ethylene cracker flue temperature data can accurately detect the outliers in the original data, and the detection accuracy of the proposed method is significantly improved compared with the isolated forest algorithm-based outlier detection algorithm, 3-sigma principle and the classical LOF algorithm, the CLOF-based anomaly detection algorithm can guarantee the detection accuracy of 100%, while the detection efficiency increases with the increase of the clipping coefficient l, and the detection effect reaches the best when l=0.2, which demonstrates the feasibility and effectiveness of the method.
| [1] |
Gu Y Y, Wang J. Effective strategies for risk control of petrochemical safety production. SME Management and Technology, 2021(4): 37-38. (  0) 0) |
| [2] |
Zhao Y B. Analysis of petrochemical safety technology and safety control method. Chemical Management, 2021(35): 112-113. (  0) 0) |
| [3] |
Yi H. Safety management measures for petrochemical projects. Chemical Design Newsletter, 2021, 47(4): 22-23. (  0) 0) |
| [4] |
Ding Zhiguo, Xing Liudong. Improved software defect prediction using Pruned Histogram-based isolation forest. Reliability Engineering & System Safety, 2020, 204: 107170. DOI:10.1016/j.ress.2020.107170 (  0) 0) |
| [5] |
Park W, Nam K, Choi S. Determination of the minimum detectability of surface plasmon resonance devices by using the 3σ rule. Journal of the Korean Physical Society, 2020, 76(11): 1010-1013. DOI:10.3938/jkps.76.1010 (  0) 0) |
| [6] |
Wang H T, Li X R, Zhao L Y. A cable segmentation method based on box plot and vertex threshold boundary. Computer Applications and Software, 2021, 38(9): 244-249. DOI:10.3969/j.issn.1000-386x.2021.09.038 (  0) 0) |
| [7] |
He J H, Liu F. An improved local outlier factor method for anomaly detection in industrial process data. Computer and Applied Chemistry, 2013, 30(1): 53-56. (  0) 0) |
| [8] |
Yu Z Z, Hong H W, Xu B, et al. A real-time anomaly monitoring method for robots based on multi-granularity joint isolated forest. Application Research of Computers, 2021, 38(6): 1785-1789. (  0) 0) |
| [9] |
Jiang X L. Comparison of three typical detection methods for multivariate abnormal data. Digital Technology and Applications, 2021, 39(11): 26-29. (  0) 0) |
| [10] |
Zhou D Z, Liu L. Time series incremental anomaly pattern detection algorithm. Computer Engineering, 2009, 35(16): 45-47. (  0) 0) |
| [11] |
Zhou Hongfang, Liu Hongjiang, Zhang Yingjie, et al. An outlier detection algorithm based on an integrated outlier factor. Intelligent Data Analysis, 2019, 23(5): 975-990. (  0) 0) |
| [12] |
Han C, Yuan Y S, Mei D, et al. Data stream outlier detection algorithm based on K-means. Computer Engineering and Applications, 2017, 53(3): 58-63. (  0) 0) |
| [13] |
Xiang X Q, Fu R Q, Lu W H, et al. Research on local outliers mining in marine environment monitoring data space based on SLOF. Marine Bulletin, 2015, 34(1): 102-106. (  0) 0) |
| [14] |
Hu C P, Qin X L. A density-based local outlier detection algorithm DLOF. Computer Research and Development, 2010, 47(12): 2110-2116. (  0) 0) |
| [15] |
Breunig M M, Kriegel H-P, Ng R T, et al. LOF: identifying density-based local outliers. Proceedings of the ACM SIGMOD International Conference on Management of Data, 2000, 29(2): 93-104. (  0) 0) |
| [16] |
Zhao X W, Nie F P, Wang R, et al. Improving projected fuzzy K-means clustering via robust learning. Neurocomputing, 2022, 491: 34-43. DOI:10.1016/j.neucom.2022.03.043 (  0) 0) |
| [17] |
Long W J, Zhang X F, Zhang L. Business process clustering method based on K-means and elbow rule. Journal of Jianghan University (Natural Science Edition), 2020, 48(1): 81-90. (  0) 0) |
| [18] |
Huang F X, Zhou G S, Ding H, et al. Detection of abnormal electrical energy data based on isolated forest algorithm. Journal of East China Normal University (Natural Science Edition), 2019(5): 123-132. (  0) 0) |
 2023, Vol. 30


