2. Guangxi Key Laboratory of Disaster Prevention and Reduction and Engineering Safety, Nanning 530004, China
As one of the important bridge types in China, arch bridges have made many construction achievements from ancient times to the present, among which steel pipe concrete arch bridges have higher rigidity, spanning capacity and beautiful shape, and have been widely used both in China and abroad over the past 20 years[1-3]. Welding is a crucial aspect of steel pipe concrete arch bridge construction, particularly for very large span models[4], which come with a growing level of technical difficulty throughout construction. The steel pipe and concrete arch bridge's two arch rib segments are joined at each intersection by a flange and welding form, the uneven heat input causes residual stresses and deformations in the welds, changing the arch rib line and the arch-rib nodes' original dimensions, this affects the structural stress on the entire bridge and may even destroy the arch rib bearing capacity.
Welding process is accompanied by thermodynamics, metal phase transition, welding stress and deformation, and many other phenomena. Its boundary conditions are complex and highly non-linear, numerical simulation analysis method is a reliable way to analyze the temperature, residual stress and deformation in welding to achieve the purpose of controlling residual deformation and residual stress. Syahroni[5] and Keivani[6] proposed to regulate the welding residual deformation and stress welding process by simulating the T-joint welding process using numerical simulation. In their computational simulation of the pipeline welding sequence, Sattari et al.[7] proposed to reduce the distortion of the reliable fusion sequence. Deng et al.[8] combined numerical analysis and testing to study circumferential weld distribution in pipelines and elucidate residual stress distribution characteristics in steel pipes. Nozar et al.[9] studied four different thin plate models based on structural theory and used numerical simulation and experimental comparison to achieve weld path improvements to reduce weld residual stresses in thin-walled weldments. Zhao et al.[10] carried out numerical analysis and optimisation studies on the welding of X80 steel pipe butt welds and proposed that fully automated welding can be used to control weld residual stresses by increasing weld passes.
The numeric model of thin plate welding, T-joints, steel tubes, and thin small steel tubes was the primary focus of recent domestic and international research[11-15], or the numeric simulation of welding research for some new materials[16-18], and large span steel tube arched rib numeric simulation study is fewer. In order to predict the residual stress changes about steel pipe welded head and provide guidance for future welding process design, it is required to study temperature field and stress field of the welded joint of the arch-ribbed steel pipe through numerical simulation of various welding processes. We respectively adopt ABAQUS finite element software on the 7-layer, 8-layer and 9-layer steel pipe welded joint model for numerical simulation analysis of temperature change, FZ, HAZ residual stress prediction analysis, and analysis of the distribution of stress on surfaces of the post-weld residual stress law; The analysis of the arch rib circumferential weld temperature field and stress field, along with a comparison of the different processes of the weld residual force changes, provides some theoretical guidance for practical engineering in arch-rib steel pipe welding.
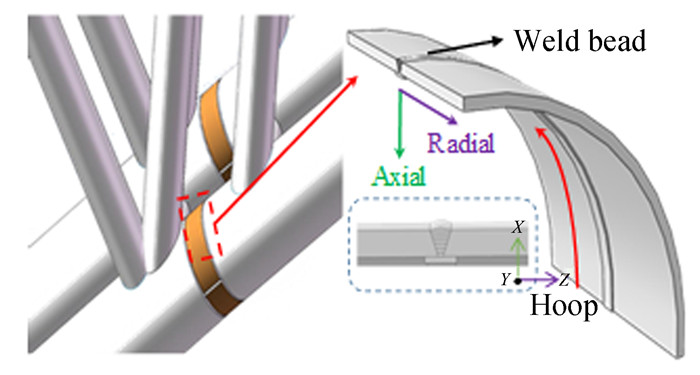
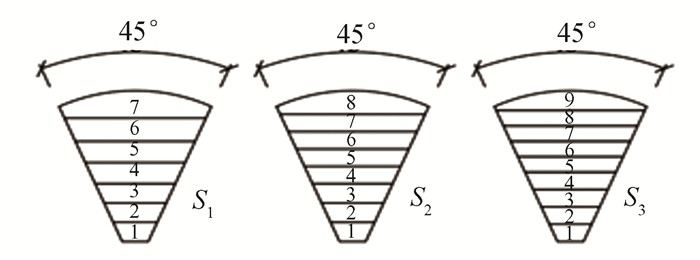
1 Finite Element Model of Welded Joints of Steel Pipes in Arch Ribs 1.1 Finite Element Model EstablishmentFig. 1 shows the local structure of the welded joint in the arch rib steel pipe, a V-shaped beveled ring weld with a pipe diameter of 1400 mm and a thickness of 26 mm.Fig. 2 shows the welding bevel size, three welding channel shapes are: 7-layer welding, 8-layer welding, 9-layer welding models, respectively, called S1, S2, S3, welding order from the inside of the seam to the outside of the seam in turn, and the welding operation is performed by applying the life and the death unit technique to gradually fill the welding seam in the welding operation. Considering the number of arch bridge arch rib welds and large diameter steel pipe, in the process of welding, finite element calculations will take a lot of time. This paper focuses on the local finite element numerical simulation of the large diameter steel pipe arch concrete bridge arch rib ring weld. The study utilizes ABAQUS finite element simulation software to build a 1/4 model of the arch rib ring weld. The model size: outer diameter is 400 mm, wall thickness is 26 mm, and length is 606 mm.
|
Fig.1 Local structure of the arch rib joint |
|
Fig.2 Bevel size and welding sequence |
1.2 Boundary Conditions and Meshing
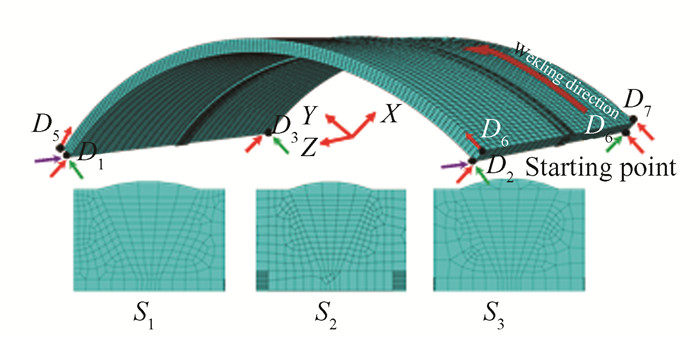
Fig. 3 shows the finite element model of the welded circumferential weld of the steel pipe of the arch rib, including the mesh division of the model and the boundary conditions for the stress analysis. The mesh partitioning of the weld and area close to weld in the model is good, but some areas further from the weld have sparse mesh partiti oning, which reduces the calculation time for finite element-based methods and further ensures the accuracy of the weld calculation. In order to calculate stress fields, an indirect thermal-structural coupling method is used in this paper. Specifically, welding temperature field calculations are performed first, and then the results are then imported into the stress field model. This is done in conjunction with the splicing construction conditions of the stainless steel concrete arch bridge in the stretch cartilage section, by converting the DC3D8 thermal analysis unit to the C3D8R structural analysis unit. Combined with the steel pipe concrete arch bridge in the arch rib segments spliced in the actual, one end of the steel plate belongs to a part of the arch rib segments that have been spliced, and therefore subject to Z constraints, and the other end of the steel plate for the lap is not subject to Z direction constraints. At the same time, the 1/4 model of the intercepted steel pipe is constrained in the X and Y directions. Therefore, two endpoints (points D1 and D2) on the inner side of the steel pipe exert constraints in the X, Y, and Z directions, the other two endpoints on the inner side (points D3 and D4) exert constraints in the X and Y directions, and the four endpoints on the outer side of the steel pipe (points D5 to D8) exert constraints in the Y direction.
|
Fig.3 Mesh division and boundary conditions |
2 Selection of Welding Parameters 2.1 Material Properties
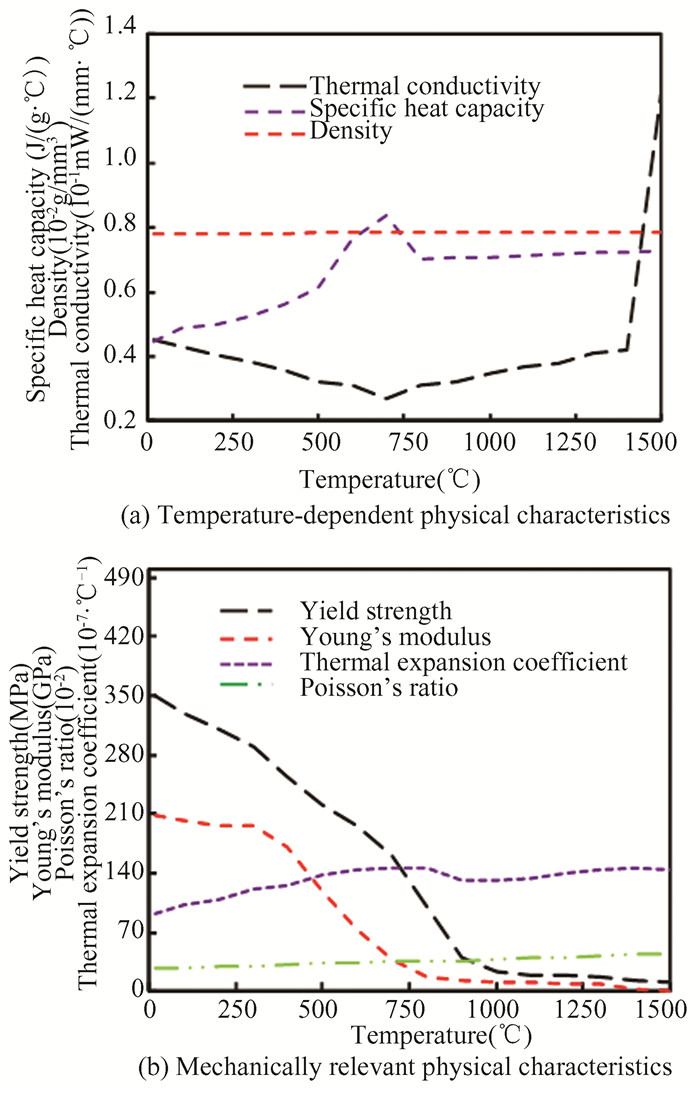
The temperature is one of the first things to change in the welding procedure, the interchange of bodily properties of the fabric and the temperature results in a non-linear relationship. By checking the related information [19-20], the relationship between the physical property characteristics of Q345qd steel and the temperature change is shown in Fig. 4. The physical parameters of the weld material employed in this work are the same as the physical characteristics of the parent material.
|
Fig.4 Physical properties of the material |
In this paper, CO2 gas shielded welding is using, according to the dimensional characteristics of the weld, the three welding models used in welding parameters are shown in Table 1.
| Table 1 Welding parameters used in welding process |
2.2 Thermal Analysis
For multi-layer multi-pass welding, heat changes are complex, this paper adopts a uniform volume heat source model which is conducive to improving the efficiency of calculation, according to different seam sizes and welding process parameters, a model is created. The uniform volume heat source model equations are shown below [21]:
| $ q=\frac{\eta U I}{V_P} $ | (1) |
where q is the heat flow density,J/(m-3·s); Vp is the volume of the heat source action, m3; η is the welding efficiency, taken as 0.85; U is the welding voltage value, V; I is the current value, A.
Changes in the welding temperature field are mainly studied using the transient three-dimensional thermal conductivity method, which assumes that the thermal diffusion of the welded material is isotropic.The non-linear transient heat transfer principle of the Calculus equation as follows [22]:
| $ \rho c \frac{\partial T}{\partial t}=Q+\frac{\partial}{\partial x}\left(k_x \frac{\partial T}{\partial x}\right)+\frac{\partial}{\partial y}\left(k_y \frac{\partial T}{\partial y}\right)+\frac{\partial}{\partial z}\left(k_z \frac{\partial T}{\partial z}\right) $ | (2) |
where ρ is the density;c is the specific heat;kx, ky, kz are the thermal conductivities;Q(x, y, z, t) is the major latent heat of phase change.
The welded parts in the welding temperature field exchange heat with the outside world in the form of heat convection and heat radiation. Heat is dissipated mainly by thermal radiation at the FZ and HAZ, and mainly by thermal convection at lower temperatures. Heat radiation equation is different from the heat convection equation and is highly nonlinear, and the boundary can be expressed as [23]:
| $ \beta=\left\{\begin{array}{l} 0.0668 T, 0 \leqslant T \leqslant 500^{\circ} \mathrm{C} \\ 0.231 T-82.1, T>500^{\circ} \mathrm{C} \end{array}\right. $ | (3) |
where T is the weld temperature;β is the total heat transfer coefficient, W/(m2·℃).General simulation of the welding temperature field can take the total heat transfer coefficient.
3 Calculation Results 3.1 Numerical Modelling ArgumentWelding is a process of transient heat input and then transient cooling, which the welded parts rapidly heat up and then cool down, causing a certain amount of material change in the joined area during the operation, particularly a reduction in the material characteristics of FZ and HAZ. At the same time, the welding temperature rises until cooling occurs, resulting in residual deformation and stress. Few node-determined welding temperature field tests are available at the moment for the circumferential weld of arch rib steel pipe. To confirm the validity and dependability of the numerical simulation of the heat field, we refers to the temperature field determination test of Ref.[24].
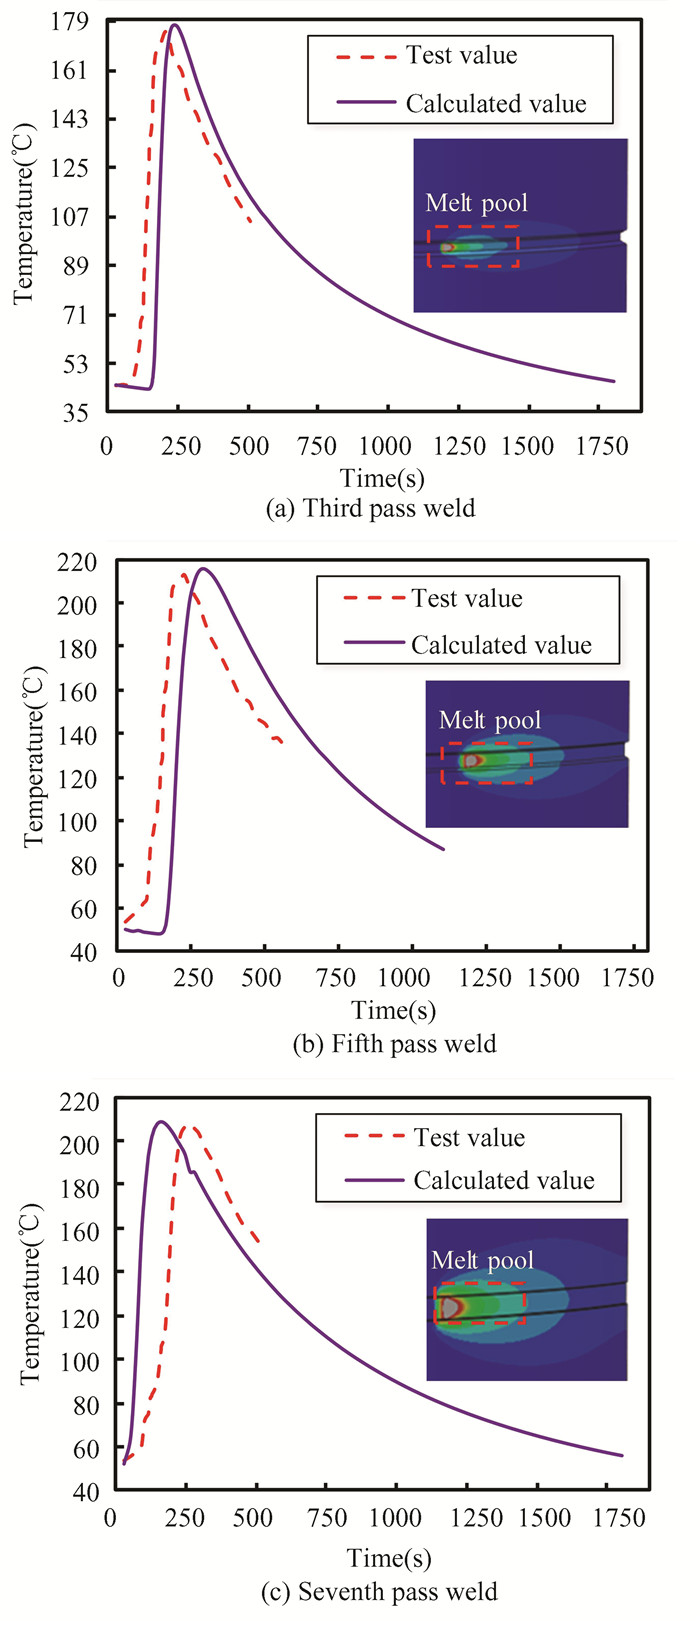
According to the welding parameters and steel plate welded joint model provided in the article, a model identical to the one in Chapter 4 of Ref.[24] was set up, and the same welding parameters were used as well. As shown in Fig. 5(a), (b) and (c), the comparison of thermal cycling profiles during welding to the third, fifth and seventh weld passes is shown for the point on the outer surface of the model that is 100 mm from the center of the weld (node number 1533) and the corresponding temperature test point during the welding test, respectively. Both are similar in linear shape, where the highest temperature of the third layer weld was calculated as 177.34 ℃ and tested as 171.34 ℃, the peak temperature error is 3.50%. Similarly, for the fifth layer of the weld, the calculated value and test value of the peak temperature error is 1.76%. The seventh layer of the weld is 1.15%, the error is less than 4.00%. This proves the accuracy and reasonableness of the model temperature field calculation method, which can be used to calculate the temperature field of subsequent models and complete the stress field calculation.
|
Fig.5 Comparison between calculated and test values |
3.2 Temperature Field Calculation Results
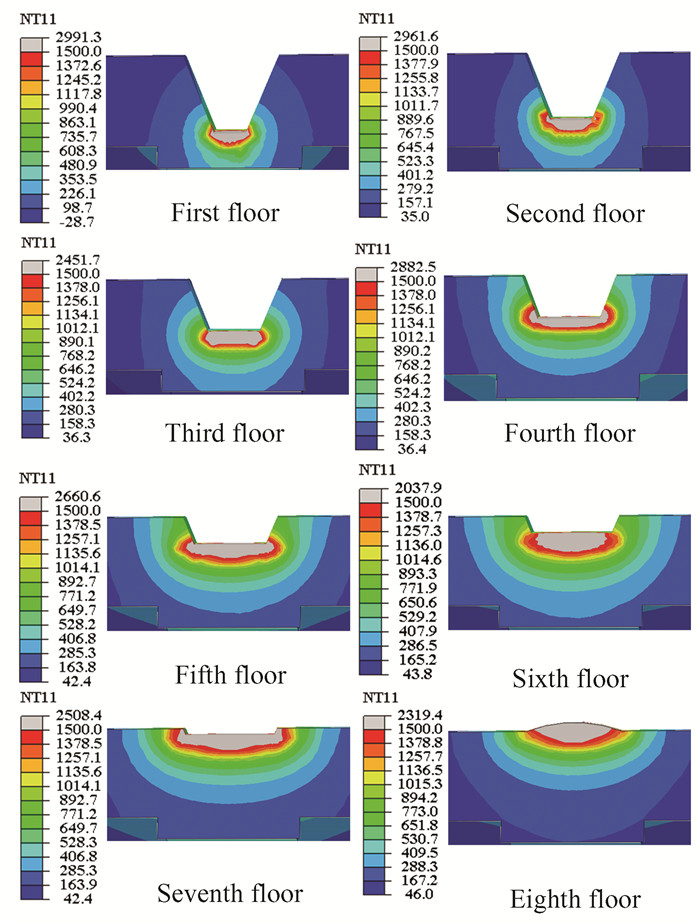
The simulation sets the welding and cooling time for each layer of the weld to a total of 1800 s and sets the cooling analysis step with a cooling time of 1800 s. After the welding is completed for 1800 s, the temperature of the entire weld model will be below 50 ℃. Fig. 6 shows the temperature distribution on the 30° cross section of the S2 model when welding up to the eighth layer, with the maximum temperature at the weld position, between about 2000 ℃ and 2900 ℃. The temperature of each layer shows a symmetric distribution, the temperature distribution changes significantly in the FZ and HAZ, and the temperature changes little in the region away from the HAZ, and the heat is transferred from weld to the axial direction of the steel pipe. The grey region in Fig. 6 represents the metal melting area during the welding process. Each weld channel's melting area has a semi-ellipsoidal shape that is comparable to the pre-designed heat source model's shape. The complete HAZ boundary of the filler material and the complete whole formed by the melting, cooling and solidification of the next layer of weld during the welding process are contained within the melting area of each weld pass. This indicates that size of the melt pool corresponds to the actual thickness and width of the weld pass.
|
Fig.6 Temperature distribution at 30° cross section |
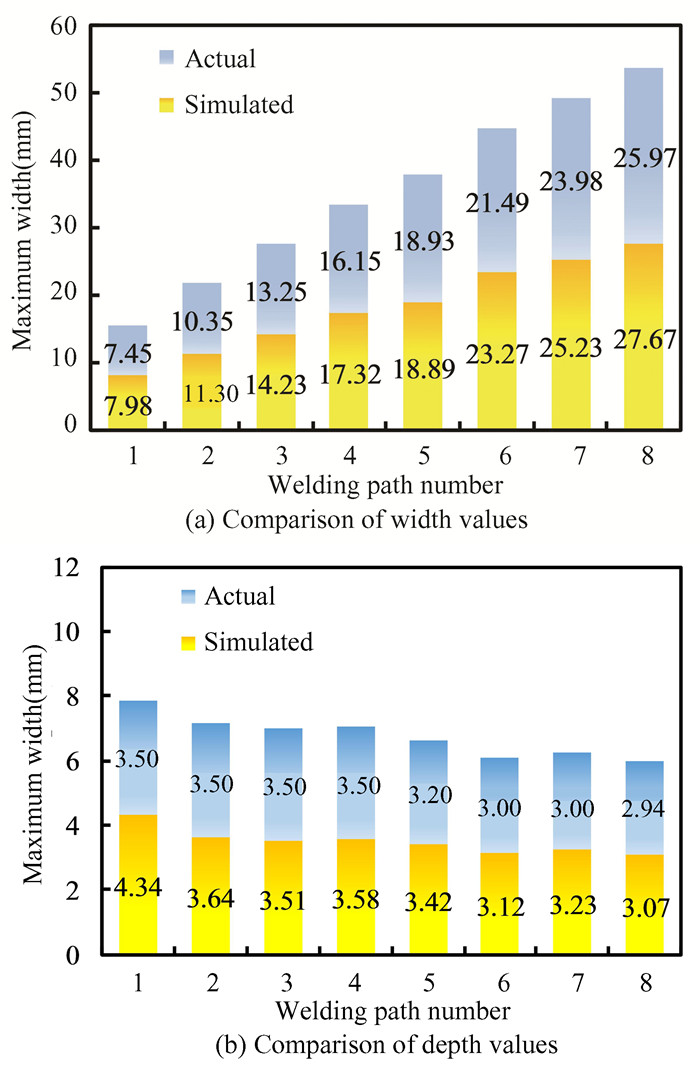
Fig. 7 compares the simulated values for the maximum depth and width of melting with the actual depth and thickness of each weld pass. Additionally, it shows how the heat source travels through each weld channel cross-section during the welding process, creating an ellipse with the greatest possible width and depth. As can be seen in the yellow portion of Fig. 7, the melt pool's width and depth are greater than the model's pre-designed weld channel dimensions, indicating that the heat source movement process melts the weld channel. This indicates that the base material is melted close to the weld channel by the heat source. Size of the melt pool is larger than the pre-designed weld channel dimensions of the model, which shows that the weld process melts weld channel, forms a whole after the weld channel melt pool cools down, which makes the bond between the base materials strong. The depth of melting of the first weld channel in Fig. 7 is larger compared with the actual one, 24%, which is due to the excessive heat input welding, resulting in an increase in the depth of the weld molten pool, and the maximum depth of the molten pool is not more than the thickness of the bottom pad. The remaining melt pool cross-section's depth, width, and weld channel cross-section size error are all within 10% of the measured values. This suggests that the welding heat input process only considers the base material's heat-affected zone portion, to ensure that the welding heat input corresponds to the reality of welding. As a result, both the model and the actual results are similarities.
|
Fig.7 Simulated versus actual values for depth and width of weld channel melting |
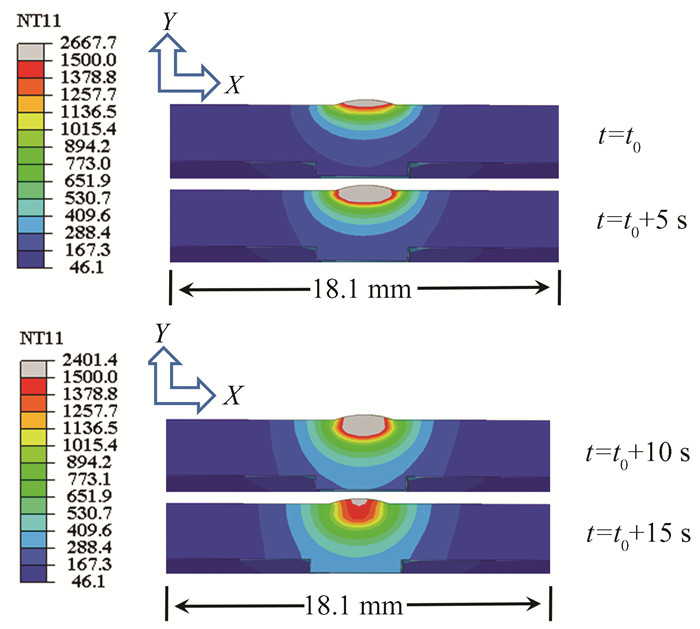
Fig. 8 shows the temperature variation of eighth layer weld at time t0, which is 15 s following moving heat source. The gray area in the picture represents the point at which the molten material in the weld pool melts metal, which is above 1500 ℃ during the welding process. The HAZ and weld positions have strong heat transfer rates, and eventually the FZ and HAZ boundary positions melt through. Heat input process involves the transfer of the heat to the molten pool along the width direction(x) and thickness direction(y). But the transfer rate along the thickness direction is faster; the heat achieves uniform distribution. With about 5-10 s of heat input heat transfer to the thickness direction, the melting pool's melting depth increases, while its width decreases. After 10 s, due to heat dissipation, the temperature at the bottom and both sides of the fusion zone decreases to metal melting temperature, and the melting pool's melting depth and width decrease.It is also shown that heat transfer is mainly by conduction and that surface convective and radiative heat transfer have little effect on the FZ and HAZ boundaries.
|
Fig.8 Temperature variation of the cross section of the 8th weld in the 8th layer |
3.3 Residual Stress Calculation Results
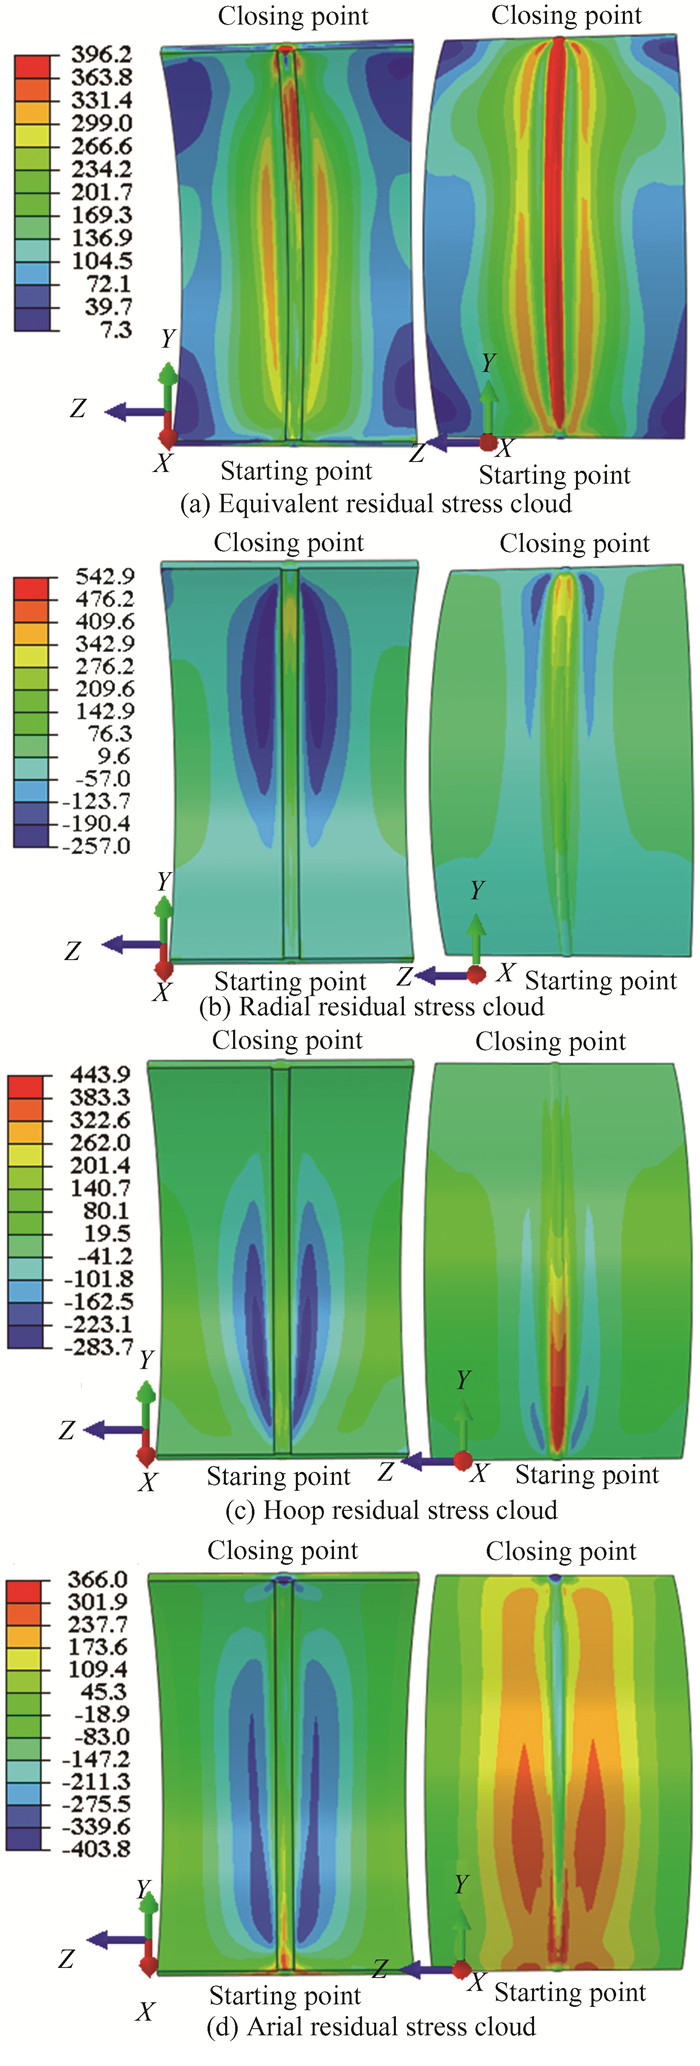
In a steel pipe concrete arch bridge, stress corrosion is likely to occur on both the steel pipe surface, and the stress and strain condition is likely to cause the steel pipe surface to fail earlier than it should. It is therefore essential to examine the residual cracking strain distribution on the surfaces steel pipe surface. Fig. 9(a) shows the residual stress distribution cloud chart for the S2 welding model of steel pipe surface. The equivalent residual stress in the FZ and HAZ appears high stress, with a high stress regional stress range of 332.0 - 373.7 MPa. This high stress is caused by the heat input from the welding process, primarily in the FZ, which causes uneven heating in welded steel plate. The base material of FZ and HAZ absorbs a lot of thermal expansion; After cooling, the shrinkage is greater than the rest of the base material cooling shrinkage, and the shrinkage deformation of the steel plate is inhibited, leading to high stress. The phenomenon of stress concentration also happens at a distance of roughly 65 mm from weld. The range of the stress value is 267.8 to 332.0 MPa.
|
Fig.9 Internal and external residual stress clouds |
Fig. 9(b) shows the 8-layer S2 model of the internal and external surface radial residual stress distribution clouds, the whole FZ and HAZ seem to have the highest tensile stress, cooling of the weld channel in welding caused overall radial contraction of weld, which together with the restraining effect on two sides of steel plate, led to tensile stresses in region. Among them, the highest stress appeared at the outside of 80°-88° cross-section weld section, which was 376.25 MPa, it is tensile stress, the total internal and external surface stress between -257 - 34 MPa. Due to the high temperature of FZ and HAZ, the radial contraction amplitude is larger than the base material contraction amplitude during cooling, resulting in the peak of compressive stress on the inner surface at 65 mm from the center of the weld, with a maximum compressive stress of -257 MPa, and a concentration of compressive stress in the 60° to 90° cross-section. The remaining total compressive stress, which is between -57 MPa and 9.6 MPa and is away from weld, indicates that the steel pipe material will expand thermally during the welding process in a radial direction. The annular and circumferential stress distribution patterns are similar, as shown in Fig. 9(c). The circumferential stresses are mainly concentrated in the 45°- 90° section welds.
As shown in Fig. 9(d), the outer face of the FZ mainly exhibits crushing stresses with the highest value of -211.3 MPa, while the HAZ from 0° to 20° of the weld section concentrates the tensile stresses with the highest value of 366 MPa, which is the location prone to cracking. The overall tensile stress away from the outside of the FZ is higher due to the significant shrinkage of outside in cooling and contraction of weld along the axial weld center after welding.
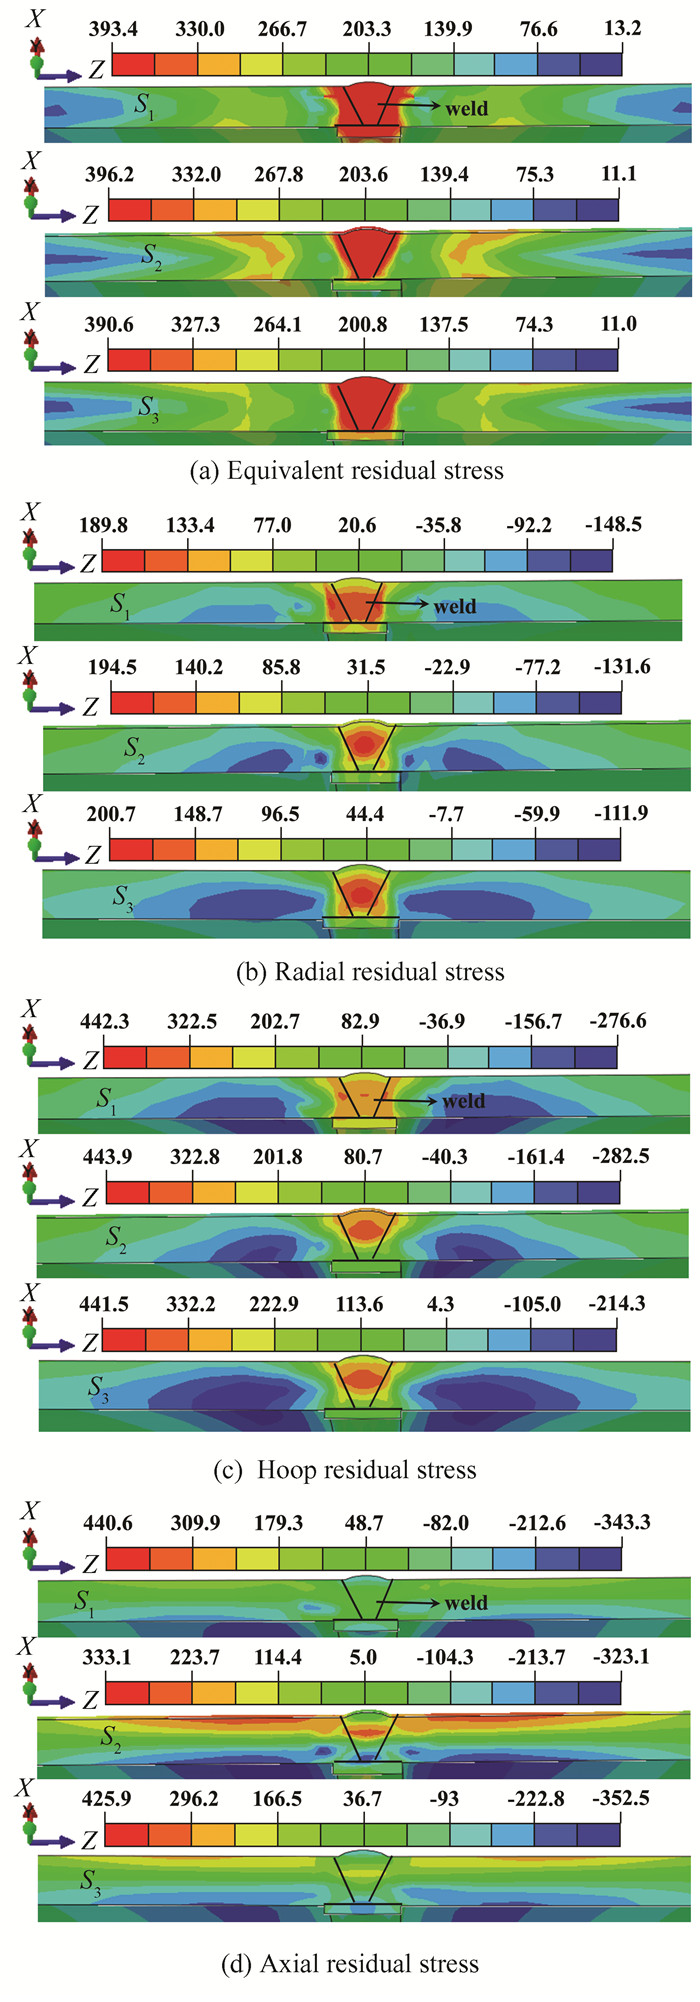
Fig. 10(a) depicts the equivalent residual stress cloud for the three welding models at a 45 ° cross section. This is because the heat input of the FZ is transferred from the weld seam to the sides by diffusion during the heat input process, the amount of heat transfer exhibits two sides with a high, middle, and low trend, causing FZ and HAZ to accumulate heat and, later, experience high stress. The stress distribution trends of the three welding models are similar, and the stress from FZ to both sides shows a high middle low trend. The high stress distribution area of S1 model is large, and the high stress area of S3 model is small. With the same welding parameters, the equivalent residual stress peaks of the four models have little difference, and the maximum stress peak is 5.6 MPa larger than the minimum stress peak.
|
Fig.10 Cloud of residual stress distribution in 45° cross section |
Fig. 10(b) shows the radial residual stress cloud for the 45° section of the three welding models. Three welding models near the FZ and HAZ appear radial tensile stress, crushing stress appears on inside and outside of the pipe at the distance of 65 mm from the weld, and the crushing stress on the inner side is higher than that on the outer surface, and the maximal compressive stress in S1-S3 models is -181.9, -256.8 and -216.7 MPa, respectively. High stresses are primarily concentrated in the weld seam, specifically in the 4th to 6th layer of the weld seam. This is due to the welding filler, the heat generated by the welding of the previous layer of the weld seam is piled up in the next layer of weld, which again leads to uneven temperature input, and produces high tensile stresses under the effect of inhibited shrinkage of the base material boundary. The inner weld of the steel pipe shrinks more than the outer weld after the welding is completed, which makes the inner surface base metal at the 65 mm position need a large enough pressure to hinder the shrinkage and deformation of the weld zone, resulting in high stresses on the inside of steel pipe, and therefore high pressure stresses appear in the three models at a distance of 65 mm from weld.
The circumferential stress is similar to the radial stress case, but the stress is less than the radial stress, as shown in Fig. 10(c). A region of tensile stress concentration occurs in the 4th to 6th layer of the weld, and the stress extends to the HAZ, as shown in S1, S2, and S3 of Fig. 10(c). About the 4th weld layer and HAZ boundary, the stress value reaches the maximum, respectively 386.8 MPa, 404.4 MPa, 418.9 MPa. The position of stress concentration is likely to lead to the growth of cracks in the FZ and HAZ boundary, and finally lead to the failure of welded joints of steel pipe. The highest values of inner surface compressive stress at the 65 mm position are -138.9 MPa, -241.1 MPa, -125.9 MPa, respectively, and the overall circumferential stress is small.
Fig. 10(d) shows the axial residual stress distribution of 45° cross section of three welding models, compressive stress appears in the covered layers FZ and HAZ, the compressive stress is between -8.3 MPa- -217.3 MPa. Tensile stress concentration area appears in weld of 4th to 6th layer of FZ, and the overall stresses are all less than 214.9 MPa. On the outside of the steel pipe, the position far away from weld seam mainly shows compressive stress distribution, and the outside mainly shows tensile stress distribution. On the outside of pipe, the position away from the weld mainly shows tensile stress distribution, and the overall axial stress of welded joint of the pipe is the smallest due to less axial constraint.
The axial paths of the inner and outer surfaces of the 45° section in the three models are selected to analysis the distribution law of each residual stress curve on the surface of the arch rib model under different weld processes, the residual stress distribution curves on the inner surface in each direction are shown in Fig. 11. The residual stress distribution of three models is similar in Fig. 11(a), stress is largest in the FZ and the edge of the weld, and the highest stress of the three does not have a big difference, with a maximum difference of 2.6%. The whole curve shows M-shaped distribution.From 15 mm- 39 mm, the stress in the three models shows a downward trend. Between 40 mm-65 mm, the stress shows a rise and reaches extremal point. But the stress value is smaller than the FZ. The maximum stress of 323.5 Mpa occurs at the position of the 65 mm, which is lower 22.35% than the maximum stress in the FZ. After 65 mm position, the residual stress decreases in turn.The stress tends to zero after the edge. Among the three welding models, S1 has a wide range of high stress in FZ and HAZ, S3 model has the smallest overall residual stress, the smallest distribution range of high stress zone, and S1 model has the largest overall stress.

|
Fig.11 Three welding model internal surface radial residual stress |
The inner surface's radial residual stresses are depicted in Fig. 11(b). The three models' stress distribution curves are similar, with the highest tensile stress occurring at 3 mm (junction of FZ and HAZ). The S1 model stress is highest, reaching 200.2 MPa. The stress distribution curve displays a W-shaped distribution, and the maximum compressive stress happens at 65 mm. There is more overall stress in the S1 model than in the other two models, the stresses range from -143.7 MPa to 200.2 MPa. With stress sizes ranging from -171.2 MPa to 159.5 MPa, the stress size distributions of Models S2 and S3 are comparable.
The three models stress distribution curves of inner surface have similar trends in Fig. 11(c), the curve line shape is similar to the radial stress curve, and the stress is the largest in the HAZ zone, where the maximum tensile stress of S1 model is 236.87 MPa, which is 109.26 MPa higher than the maximum tensile stress of S3 model (127.61 MPa). And radial residual stress distribution form is the same, S2 and S3 model stress value difference is small, S1 model total stress trend is higher than the remaining two welding models. The three axial residual stress distribution models shown in Fig. 11(d) are all represented in the HAZ maximum stress, S2 and S3 model compressive stress. The two models' axial compressive stress ranges from -67.92 MPa to -229.03 MPa, with the 75 mm location having the maximum value. Axial tensile stresses were observed between 8 mm and 40 mm in the center of the weld channel in S1 model, with stress values ranging from 0.77 MPa to 145.02 MPa, while axial compressive stresses were observed in the remaining locations, with stress values ranging from -5.33 MPa to -175.31 MPa.
Fig. 12 shows the stress distribution of the outer surface of the steel pipe in all directions. Fig. 12(a) displays the equivalent residual stress distribution curve for the three welding models, and the stress distribution curves are linearly similar for the three models. The curve displays an M-shaped distribution, with the highest stress for all three welding models appearing in the FZ and a portion of the HAZ. There were no notable regional variances across the high stress field regions, and the largest difference between the three welding techniques was just 1.41%. The three welding models have an exceptional stress value gap at the weld center distance of 60 to 75 mm. The welding model S2 has an overall maximum stress of 180.31 MPa-305.67 MPa, while the welding model S1 has an overall lowest stress range of 179.83 MPa-259.77 MPa.

|
Fig.12 Three welding models outside the surface of the radial residual stress |
As shown in Fig. 12(b), the radial stress distribution curve of the three are similar in shape, showing a W-shaped distribution. All three models showed the maximum stress in tension at the connection between FZ and HAZ, and the peak tensile stresses of the three models differed greatly, with the maximum stress in model S3 and the minimum stress in S1, which were 197.92 MPa and 162.77 MPa, respectively.The increase in the number of welded layers shows a tendency for the peak tensile stresses to increase one at a time, because the increase welded layers results in an increase the sustained heat inputs in outer surface near welded region, and an increase in the amount of plastic deformation that occurs at elevated temperatures, which results in greater residual stresses. Similarly, the number of weld layer increases, the range of high stress distribution increases. The maximum compressive stress occurs from 80 mm to 90 mm position, and the compressive stress shows a decreasing trend in the case of increasing the number of weld layers, and the peak maximum and minimum stress peaks are -59.91 MPa and -23.45 MPa, respectively.The radial stress distribution curves of the three models at the position of 17 mm-44 mm have a small difference in value, and the radial stresses of the three models after the position of 44 mm have a large difference, and the overall stress of model S1 is the largest.
As shown in Fig. 12(c), the outer circumferential stress distribution curves of the three models present a W-shaped distribution, with the same shape as the radial stress arrangement, and all of them are the highest stresses in the HAZ, and the difference in stress magnitude is not obvious. In FZ, S2 model has the largest peak stress, S1 model has the largest peak stress distribution range, and S3 has the smallest peak stress distribution range. It is shown that, for the outer surface, the increase welded layers decreases the range of maximum stress distribution, and the increase welded layers reduces the value of highest stress, and has an overall effect of reducing the radial and circumferential stresses on the outside surface.
As shown in Fig. 12(d), the distribution curve of axial residual stresses is in inverted W-shape compared with radial and circumferential residual stresses.General compressive stresses exist near the fusion and welding zones, the highest compressive stress is in the fusion zone, and the high pressure stress distribution area is smaller than the high stress distribution area in other directions. S2 has the lowest compressive stress peak (-139.38 MPa) and S3 has the greatest (-213.61 MPa) among the three models. The overall axial stress value of S1 is lower than that of the remaining two models, and the maximum error occurs at the HAZ position on outside surface, which is mainly sensitive to the uneven heating in welding of the outermost weld, coupled with the higher heat input in the welding of the outermost weld of S1, which produces a greater axial stress at the HAZ position on the outer surface of S1 after cooling, resulting in the maximum error of the S1 model with the rest of the two models amounting to 54.01%.
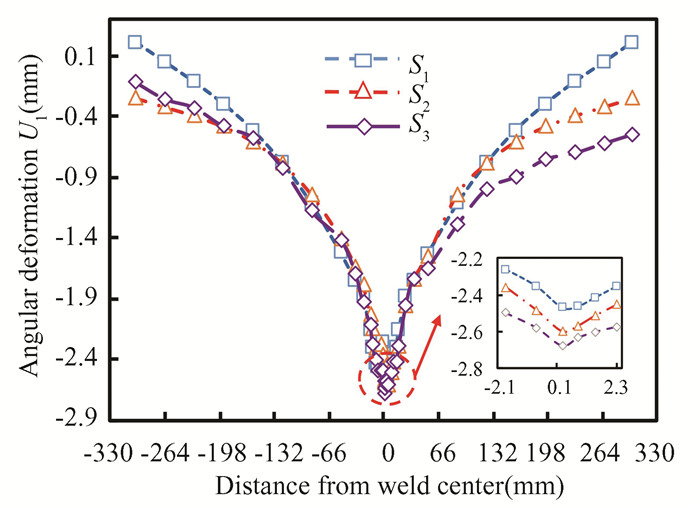
3.4 Residual Deformation AnalysisFig. 13 shows a comparison of the radial displacement distribution of three weld models. Welding, the temperature changes rapidly and the temperature distribution is not uniform, resulting in uneven deformation of the pipe end. Combined with the residual stress distribution, it indicates that the weld material deformed plastically at high temperatures, resulting in higher compressive stresses in the axial direction. Low residual stresses in other parts of the weldment, below the yield strength of the base material, indicating that the transverse shrinkage is mainly caused by thermal expansion and cold shrinkage in welding. In the radial direction, the end of the tube closest to the weld will become smaller. The center of the weld is the site of maximum deformation for all three models. The overall deformation of S3 is the largest, with maximum deformations of 2.46 mm, 2.61 mm, and 2.67 mm for S1, S2, and S3, respectively.The difference in deformation away from the FZ increases with the number of welding passes for all three models. As the number of weld passes increases, the amount of welding heat input unevenness increases, resulting in frequent plastic deformation in the direction of the thick plate and a large temperature difference, which leads to an increase in the cumulative deformation of the corners after each weld pass, resulting in an accumulation of corner deformation and the presence of substantial tensile strain along the direction of the annular weld. When weld passes increases, heat input of each layer (pass) welding is reduced accordingly, which can reduce the deformation and effectively reduce the residual stress.
|
Fig.13 Radial displacement distribution after welding |
4 Summary and Conclusions
1) The experimental values are similar to the temperature changes of the calculated values, indicating that the numerical simulation method has a certain degree of accuracy; The heat is mainly input into the FZ and HAZ, and is transferred from weld to two sides of the steel plate. During the welding process, the metal in the cross-section melts fastest along the depth direction, and the heat is easily gathered to the lower layer weld. Heat is mainly in the form of heat conduction, and surface convection heat transfer and radiation heat transfer have little effect on the FZ and HAZ boundaries.
2) Welding heating inhomogeneity leads to FZ and HAZ cooling contraction increases, the three models show high stresses at FZ and the stresses tend to decrease gradually from FZ to both sides;Sustained inhomogeneous heating leads to the high tensile stresses in all directions of the FZ and HAZ, in which the maximum stresses mainly occur in the junction of the FZ and HAZ, the compressive stresses in radial and circumferential directions on the inner and outer sides of steel pipes; The inner surface of the steel pipe is axially tensioned as a whole and the outer surface is compressed.
3) Changes in the weld layers have a significant impact on the residual stress in the inner wall of the steel pipe, while the effect on the outer wall is relatively smaller. As the number of weld layers increases, the residual stress distribution law remains unchanged, but the size of the stress values changes. Welding layers changes affect the distribution range of the high stress zone in the FZ and HAZ. The increase in the number of weld layers, the FZ appeared to have a narrowing of the distribution range of high stress tendency, the high stress area of S1 model is larger than S2 and S3.
4) With more welding layers, there are more unevenly heated weldments, which results in a buildup of corner distortion and a subsequent rise in the proportion of welded layers with significant corner deformation.
| [1] |
Chen B C, Liu J P. A review of the world arch bridge construction and technology development. Journal of Transportation Engineering, 2020, 20(1): 15. (  0) 0) |
| [2] |
Chen B C, Wei J G, Zhou J, et al. Current status and prospect of application of steel pipe concrete arch bridge in China. Journal of Civil Engineering, 2017, 50(6): 50-61. (  0) 0) |
| [3] |
Zhao R D, Zhang Z Y. A review of the development of steel pipe concrete stiff skeleton arch bridges in China. Bridge Construction, 2016, 46(6): 45-50. (  0) 0) |
| [4] |
Zheng J L. New trends in the development of large-span concrete arch bridges in China. Journal of Chongqing Jiao Tong University: Natural Science Edition, 2016, 35(A01): 4. (  0) 0) |
| [5] |
Syahroni N, Hidayat M I P. Numerical simulation of welding sequence effect on temperature distribution, residual stresses and distortions of T-Joint fillet welds. Advanced Materials Research, 2011, 264-265: 254-259. DOI:10.4028/www.scientific.net/AMR.264-265.254 (  0) 0) |
| [6] |
Keivani R, Jahazi M, Pham T, et al. Predicting residual stresses and distortion during multisequence welding of large size structures using FEM. International Journal of Advanced Manufacturing Technology, 2014, 73(1-4): 409-419. DOI:10.1007/s00170-014-5833-4 (  0) 0) |
| [7] |
Sattari F I, Javadi Y. Influence of welding sequence on welding distortions inpipes. International Journal of Pressure Vessels and Piping, 2008, 85(4): 265-274. DOI:10.1016/j.ijpvp.2007.07.003 (  0) 0) |
| [8] |
Deng D, Kiyoshima S. FEM prediction of welding residual stresses in a SUS304 girth-welded pipe with emphasis on stress distribution near weld start/end location. Computational Materials Science, 2011, 50(2): 612-621. DOI:10.1016/j.commatsci.2010.09.025 (  0) 0) |
| [9] |
Nozari M H, Ziaee S, Jafarpur K. Experimental study of produced thermal stresses in thin arc welded plates: application of constructal theory in welding paths. Welding World, 2016, 60(1): 51-59. DOI:10.1007/s40194-015-0277-5 (  0) 0) |
| [10] |
Zhao W, Jiang W, Zhang H, et al. 3D finite element analysis and optimization of welding residual stress in the girth joints of X80 steel pipeline. Journal of Manufacturing Processes, 2021, 66(9): 166-178. DOI:10.1016/j.jmapro.2021.04.009 (  0) 0) |
| [11] |
Tejc J, Troyanova K, Iorio L, et al. Residual stresses prediction on clad pipeline girth welds through numerical simulation. Procedia Manufacturing, 2019, 37: 605-612. DOI:10.1016/j.promfg.2019.12.095 (  0) 0) |
| [12] |
Obeid O, Alfano G, Bahai H, et al. Numerical simulation of thermal and residual stress fields induced by lined pipe welding. Thermal Science and Engineering Progress, 2017, 5: 1-14. DOI:10.1016/j.tsep.2017.10.005 (  0) 0) |
| [13] |
Sun G F, Wang Z D, Lu Y, et al. Numerical and experimental investigation of thermal field and residual stress in laser-MIG hybrid welded NV E690 steel plates. Journal of Manufacturing Processes, 2018, 34(Part A): 106-120. DOI:10.1016/j.jmapro.2018.05.023 (  0) 0) |
| [14] |
Yaghi A H, Hyde T H, Becker A A, et al. Comparison of measured and modelled residual stresses in a welded P91 steel pipe undergoing post weld heat treatment. International Journal of Pressure Vessels and Piping, 2020, 181: 104076. DOI:10.1016/j.ijpvp.2020.104076 (  0) 0) |
| [15] |
Sidorov M M. Investigation of the distribution of residual stresses in dissimilar thickness girth welds. Procedia Structural Integrity, 2019, 20: 180-184. DOI:10.1016/j.prostr.2019.12.136 (  0) 0) |
| [16] |
Wei Lei, Wei Chun. Numerical simulation of single-sided open bevel asymmetric welding of Q460 steel T-joints. Thermal Processing Technology, 2019, 48(7): 244-246. (  0) 0) |
| [17] |
Chen M F, Guo Y L, Zhou G T, et al. Finite element simulation of laser welding deformation of TC4 titanium alloy thin plate. Mechanical Engineering Materials, 2019, 43(7): 74-78. (  0) 0) |
| [18] |
Fang N W, Wang L P, Li L S, et al. Numerical simulation of DE-GMAW welding of magnesium alloy cylindrical pods. Journal of Welding, 2018, 39(7): 29-32. DOI:10.12073/j.cw.20180110001 (  0) 0) |
| [19] |
Cai J P, Sun J M, Xia L Y, et al. Prediction of residual stress and deformation in butt joints of Q345 steel. Journal of Welding, 2015, 36(11): 61-64,68,116. (  0) 0) |
| [20] |
Mao Z T, Pu X W, Wang W D, et al. Comparison of welding deformation and residual stress between laser welding and gas shielded welding of Q345 steel. China Laser, 2016, 43(6): 125-134. (  0) 0) |
| [21] |
Liu C, Zhang J X, Xue C B. Numerical investigation on residual stress distribution and evolution during multi-pass narrow gap welding of thick-walled stainless steel pipes. Fusion Engineering & Design, 2011, 86(4-5): 288-295. DOI:10.1016/j.fusengdes.2011.01.116 (  0) 0) |
| [22] |
Ma F. Numerical Simulation and Research on Welding Deformation and Stress of Aluminum Alloy Based on ABAQUS Platform. Chongqing: Chongqing Jiaotong University, 2016.
(  0) 0) |
| [23] |
Brickstad B, Josefson B L. A parametric study of residual stresses in multi-pass butt-welded stainless steel pipes. International Journal of Pressure Vessels & Piping, 1998, 75(1): 11-25. DOI:10.1016/S0308-0161(97)00117-8 (  0) 0) |
| [24] |
Luo L. Automatic Overhead Welding Technology for Arch Ribs of Steel Pipe Arch Bridges. Nanning: Guangxi University, 2020.
(  0) 0) |
 2024, Vol. 31


