Wind tunnel test, as an important means of modern fluid experiment, could play a significant role in evaluating the operational parameters of aircraft and vehicles. Especially when it comes to the design of aircraft and vehicle structures, it is necessary to conduct wind tunnel experiments under different conditions and obtain corresponding parameters, and the optimal operating results could be obtained by analyzing the corresponding parameters and continuously adjusting the design structure.
The uniformity of the temperature field has a significant impact on the quality of the wind tunnel flow field and the efficiency of the experiment. After the completion of wind tunnel construction, it is necessary to conduct operational debugging, and an important test of wind tunnel debugging is temperature field calibration. The actual distribution of wind tunnel temperature is of importance for the test results of the model.
Many researchers have studied the temperature distribution of the wind tunnel. Liang et al.[1] studied the temperature distribution in the wind tunnel test by using the neural network method. Through the pre measured data, the neural network to simulate the temperature distribution is applied, avoiding the complex mathematical solution process. Zhu et al.[2] used thermal imaging technology to measure the temperature field of high temperature airflow, which could observe the uniformity of airflow temperature distribution in real time, replacing the traditional thermocouple temperature measurement method. Li et al.[3] designed an airflow simulation test bench to adjust the temperature of the wind tunnel experimental section. On the other hand, in order to verify the rationality of the test bench, simulation calculations were conducted on the flow field. Huang et al.[4] used infrared thermal imaging method to test and analyze the temperature field of turbine blades in wind tunnels. Wu et al.[5] designed a probe capable of measuring flow field parameters for combustion type ultra-high speed and high temperature wind tunnels with different nozzle outlet diameters. The temperature field of the wind tunnel was calibrated, and satisfactory results were obtained. Xu et al.[6] analyzed the coupling effect between aerodynamic heat on the surface of aircraft and solid internal temperature, and predicted the heating conditions of two-dimensional wings and wind tunnel nozzles applying flow field structure coupled heat transfer numerical calculations. Zhang[7-8] used machine learning methods to predict the temperature field distribution of icing wind tunnels based on existing data and achieved the good prediction results. In order to improve the efficiency and accuracy of temperature field measurement, Zhao et al.[9] adopted distributed optical fibers instead of traditional thermal resistance temperature sensors, which changed the disadvantage of traditional measurement methods occupying large internal space.
Zhang et al.[10] established a one-dimensional flow and heat transfer simulation model to address the uniformity of the airflow temperature field in large icing wind tunnels. Nyman[11] placed a model hole with different design openings in the wind tunnel, observing the pressure of the wind tunnel by changing the wind direction of the internal openings, and the airflow applying smoke and dust. Jiménez-portaz[12] analyzed the uniformity and mass of airflow in open wind tunnels and compared them with classic closed circuit wind tunnels. The results show that the turbulence intensity of open wind tunnels is generally higher and the average air flow is more uniform, while the Reynolds number of the two wind tunnels is close, which indicates that the mechanical properties of the two wind tunnels are similar. He proposed a method for indirect measurement of reference wind speed and reference static pressure. Compared with the traditional method, the new method has the advantages of high accuracy and easy operation, and the author illustrated the main steps of the method and the typical results in the boundary layer wind tunnel[13]. Feng[14] conducted research on the influence of tunnel sidewalls on wind sand transport. The author measured and analyzed the wind speed and dust flux at different positions in the experimental section, and the results indicated that the wind speed showed a trend of first increasing and then decreasing from the side wall to the center line of the wind tunnel; in the meantime, the difference in wind speed at different positions on the cross-section decreases with the decrease on the width of the wind tunnel. Based on the model, the uniformity distribution of the airflow temperature field in the wind tunnel was adjusted. To sum up, the calibration of wind tunnel temperature field is of vital importance.
For the wind tunnel after construction, analyzing the influencing factors of the temperature field is crucial. Only by obtaining the decisive factors affecting the temperature field, the measurement is adjusted and the system to obtain the best flow field quality is controlled during the flow field experiment of the model, which is the research lacking in other relevant literature.
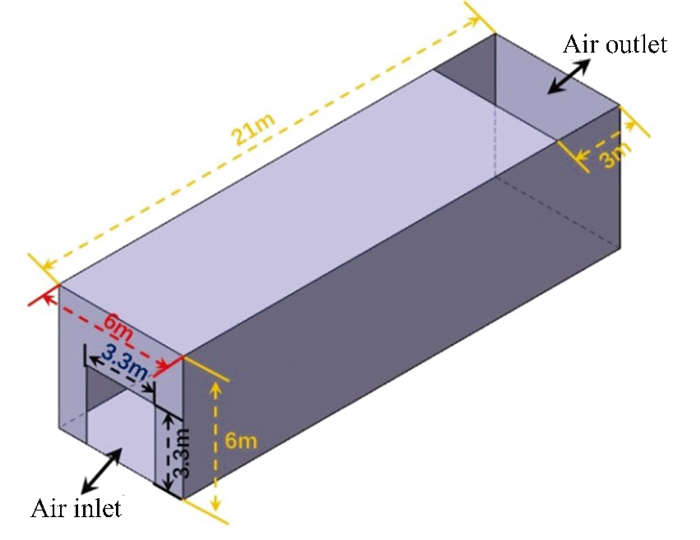
1 Temperature Field Calibration Test and EquipmentThe structural diagram of the temperature field during wind tunnel experiment is shown in Fig. 1. The steel plate with a wall thickness of 6 mm has an absolute pressure of 102 kPa at the nozzle. The air inlet is a square (3.3 m×3.3 m), and the testing section is cuboid (21 m×6 m×6 m). The size of the air outlet is 3 m×6 m.
|
Fig.1 Structure diagram of wind tunnel test section |
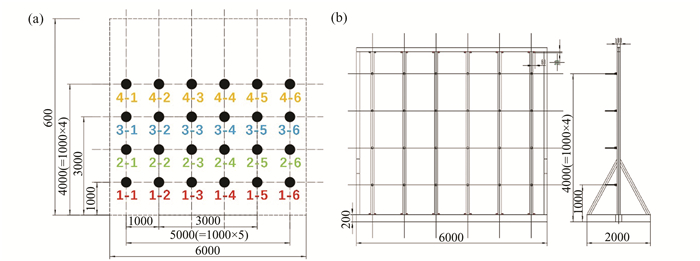
In order to test the temperature field distribution at different cross-sections from the nozzle, a calibration tool has been specially designed in the paper. Multiple temperature sensors which the distribution shown in Fig. 2(a), are installed on the testing steel frame. Due to the requirement of testing the temperature field at different distances from the air nozzle, rollers are installed at the bottom of the testing steel frame for facilitating the movement of the steel frame to the required testing position. In the experiment, the temperature field testing locations from the nozzle were 1.5 m, 3.4 m, 7.5 m, and 12 m, respectively. There are a total of 24 temperature sensors in 4 rows, 6 columns, and evenly distributed, in the meantime, the distance between the sensors, the wind tunnel sidewall and the distance between adjacent sensors are clearly expressed in Fig. 2(a). The structure and dimensions of the temperature field testing truss are shown in Fig. 2(b), which provides a rough understanding of the overall structure of the testing equipment. The truss is made of steel structure, and there are rollers installed at the bottom of both ends of the truss, which could facilitate the movement of the truss position and measurement of the temperature field data distribution for the corresponding position section.
|
Fig.2 (a) distribution diagram of section temperature sensor; (b) structural diagram of temperature field testing truss |
The on-site diagram of the temperature field testing device could be seen in Fig. 3 (a) and (b). A thread mounted PT100 temperature sensors are used, with a calibrated air temperature range of 20-72 ℃. The temperature sensor has a range of 0-100 ℃ and an accuracy of ± 0.35 ℃. The data collector uses the ADAM-6015 intelligent Ethernet remote data acquisition module, which could collect 7 channels of PT100 signals and transmit the collected signal values to the master control computer through Ethernet. The module could be placed on the collection site to reduce conducted interference caused by analog line transmission.

|
Fig.3 Calibration site of temperature field in wind tunnel (a) field distribution diagram of wind tunnel section temperature sensor; (b) field installation drawing of temperature sensor; (c) outline structure diagram of air nozzle |
For the temperature field calibration test, the air temperatures used were 20 ± 2 ℃ and 70 ± 2 ℃, and the test wind speeds were 1.5 m/s, 8.9 m/s, 18 m/s, and 29 m/s, respectively. The distances between the test section and the nozzle were 1.5 m, 7.5 m, and 12 m, respectively. Therefore, wind speed and temperature sensors at the air inlet are installed to adjust the required air temperature and speed, as shown in Fig. 3 (c). Due to obtain the temperature field distribution at different cross-sectional positions under stable wind speed and temperature conditions to ensure the accuracy of experimental data, the temperature field of the wind tunnel cross-section is tested and analyzed as the inlet air speed and temperature achieve a stable state (with test duration of 0 min, 10 min, 20 min, and 30 min, respectively).
2 Analysis and Simulation of Temperature Field Test ResultsMany researchers have summarized the N-S equations and made corresponding treatments to simplify calculations [15-16]. In the paper, relevant research content is applied as the basis for simulation. On the other hand, researchers have studied the heat transfer between solid interfaces and fluids[17]. In order to simplify the research in this paper, the energy exchange between the fluid and the solid wall is temporarily not considered.
Due to the test wind speed being below 0.3 Ma, the air is able to be considered incompressible in the paper. The simulation of the model was carried out by applying the conservative steady-state energy equation as the control equation, and the Euler method was applied. For the control body, the integral form of the energy equation is given by:
| $\begin{array}{r}\iiint_V \frac{\partial(\rho E)}{\partial t} \mathrm{~d} V+\mathop{{\displaystyle{\int}\!\!\!\!\!\int}\mkern-21mu \bigcirc}_A(\rho \overrightarrow{\boldsymbol{V}} E) \cdot \mathrm{d} \overrightarrow{\boldsymbol{A}}=\iiint_V(\rho \overrightarrow{\boldsymbol{f}} \cdot \overrightarrow{\boldsymbol{V}}) \mathrm{d} V+ \\ \mathop{{\displaystyle{\int}\!\!\!\!\!\int}\mkern-21mu \bigcirc}_A(\overrightarrow{\boldsymbol{n}} \cdot \overrightarrow{\boldsymbol{P}} \cdot \overrightarrow{\boldsymbol{V}}) \mathrm{d} A+\mathop{{\displaystyle{\int}\!\!\!\!\!\int}\mkern-21mu \bigcirc}_A(k \nabla T) \cdot \mathrm{d} \overrightarrow{\boldsymbol{A}}+\iiint_V S \mathrm{d} V\end{array}$ | (1) |
The differential form of the energy equation could be obtained by simplifying Eq.(1) with Gauss theorem:
| $\begin{aligned} \frac{\partial(\rho E)}{\partial t}+\nabla \cdot(\rho \overrightarrow{\boldsymbol{V}} E)=\rho \overrightarrow{\boldsymbol{f}} \cdot \overrightarrow{\boldsymbol{V}}+ \\ \nabla \cdot(\overrightarrow{\boldsymbol{P}} \cdot \overrightarrow{\boldsymbol{V}})+\nabla \cdot(k \nabla T)+S\end{aligned}$ | (2) |
where, ρ—Air density (kg/m3); E—The energy per unit mass of air (J/kg);
In the paper, the temperature field is analyzed, so the energy equation needs to be expressed by temperature, for perfect gas, the thermodynamic equations is given by:
| $\mathrm{d} e=c_V \mathrm{d} T$ | (3) |
| $\mathrm{d} h=c_P \mathrm{d} T$ | (4) |
| $h=e+p / \rho$ | (5) |
where, e—Internal energy per unit mass of gas (J/kg); h—Enthalpy per unit mass of gas (J/kg); p—Pressure (Pa); cV—Specific heat at constant volume (J/kg·K); cp—Specific heat capacity at constant pressure (J/kg·K);
Therefore, the energy equation represented by temperature is given by:
| $\begin{gathered}c_V\left[\frac{\partial(\rho T)}{\partial t}+\nabla \cdot(\rho \overrightarrow{\boldsymbol{V}} T)\right]=-p \nabla \cdot \overrightarrow{\boldsymbol{V}}+ \\ \phi+\nabla \cdot(k \nabla T)+S\end{gathered}$ | (6) |
Or
| $\begin{gathered}c_p\left[\frac{\partial(\rho T)}{\partial t}+\nabla \cdot(\rho \overrightarrow{\boldsymbol{V}} T)\right]=\frac{\mathrm{D} p}{\mathrm{D} t}+ \\ \phi+\nabla \cdot(k \nabla T)+S\end{gathered}$ | (7) |
In the Cartesian coordinate system, the expansion form of the energy equation is given by:
| $\begin{gathered}c_V\left[\frac{\partial(\rho T)}{\partial t}+\frac{\partial(\rho T u)}{\partial x}+\frac{\partial(\rho T v)}{\partial y}+\frac{\partial(\rho T w)}{\partial z}\right]= \\ -p\left(\frac{\partial u}{\partial x}+\frac{\partial v}{\partial y}+\frac{\partial w}{\partial z}\right)+\phi+\frac{\partial}{\partial x}\left(k \frac{\partial T}{\partial x}\right)+ \\ \frac{\partial}{\partial y}\left(k \frac{\partial T}{\partial y}\right)+\frac{\partial}{\partial z}\left(k \frac{\partial T}{\partial z}\right)+S\end{gathered}$ | (8) |
Or
| $\begin{gathered}c_p\left[\frac{\partial(\rho T)}{\partial t}+\frac{\partial(\rho T u)}{\partial x}+\frac{\partial(\rho T v)}{\partial y}+\frac{\partial(\rho T w)}{\partial z}\right]= \\ \frac{\partial p}{\partial t}+u \frac{\partial p}{\partial x}+v \frac{\partial p}{\partial y}+w \frac{\partial p}{\partial z}+\phi+\frac{\partial}{\partial x}\left(k \frac{\partial T}{\partial x}\right)+ \\ \frac{\partial}{\partial y}\left(k \frac{\partial T}{\partial y}\right)+\frac{\partial}{\partial z}\left(k \frac{\partial T}{\partial z}\right)+S\end{gathered}$ | (9) |
where, ϕ—Dissipation function, the expression is given by:
| $\begin{aligned} \phi= & \frac{2}{3} \mu\left[\left(\frac{\partial u}{\partial x}-\frac{\partial v}{\partial y}\right)^2+\left(\frac{\partial v}{\partial y}-\frac{\partial w}{\partial z}\right)^2+\left(\frac{\partial w}{\partial z}-\frac{\partial u}{\partial x}\right)^2\right]+ \\ & \mu\left[\left(\frac{\partial u}{\partial y}+\frac{\partial v}{\partial x}\right)^2+\left(\frac{\partial v}{\partial z}+\frac{\partial w}{\partial y}\right)^2+\left(\frac{\partial w}{\partial x}+\frac{\partial u}{\partial z}\right)^2\right]= \\ & -\frac{2}{3} \mu(\nabla \cdot \vec{\boldsymbol{V}})^2+2 \mu\left[\left(\frac{\partial u}{\partial x}\right)^2+\frac{1}{4}\left(\frac{\partial u}{\partial y}+\frac{\partial v}{\partial x}\right)^2+\right. \\ & \left.\frac{1}{4}\left(\frac{\partial u}{\partial z}+\frac{\partial w}{\partial x}\right)^2\right]+2 \mu\left[\frac{1}{4}\left(\frac{\partial v}{\partial x}+\frac{\partial u}{\partial y}\right)^2+\right. \\ & \left.\left(\frac{\partial v}{\partial y}\right)^2+\frac{1}{4}\left(\frac{\partial v}{\partial z}+\frac{\partial w}{\partial y}\right)^2\right]+2 \mu\left[\frac{1}{4}\left(\frac{\partial w}{\partial x}+\right.\right. \\ & \left.\left.\frac{\partial u}{\partial z}\right)^2+\frac{1}{4}\left(\frac{\partial w}{\partial y}+\frac{\partial v}{\partial z}\right)^2+\left(\frac{\partial w}{\partial z}\right)^2\right]\end{aligned}$ | (10) |
In the paper, the test air is incompressible, so μ=const;
In the paper, the temperature test was conducted after the wind tunnel temperature stabilized, which could be approximated as a steady-state convection diffusion problem. The problem is considered as passive steady-state, so Eqs. (8) -(10) could be simplified, as follows [15-16]:
| $\begin{gathered}c_V \rho\left[\frac{\partial(T u)}{\partial x}+\frac{\partial(T v)}{\partial y}+\frac{\partial(T w)}{\partial z}\right]=-p\left(\frac{\partial u}{\partial x}+\right. \\ \left.\frac{\partial v}{\partial y}+\frac{\partial w}{\partial z}\right)+\phi+k \nabla^2 T\end{gathered}$ | (11) |
| $\begin{gathered}c_p \rho\left[\frac{\partial(T u)}{\partial x}+\frac{\partial(T v)}{\partial y}+\frac{\partial(T w)}{\partial z}\right]=u \frac{\partial p}{\partial x}+ \\ v \frac{\partial p}{\partial y}+w \frac{\partial p}{\partial z}+\phi+k \nabla^2 T\end{gathered}$ | (12) |
| $\begin{aligned} & \phi=2 \mu\left[\left(\frac{\partial u}{\partial x}\right)^2+\frac{1}{4}\left(\frac{\partial u}{\partial y}+\frac{\partial v}{\partial x}\right)^2+\frac{1}{4}\left(\frac{\partial u}{\partial z}+\right.\right.\\ & \left.\left.\frac{\partial w}{\partial x}\right)^2\right]+2 \mu\left[\frac{1}{4}\left(\frac{\partial v}{\partial x}+\frac{\partial u}{\partial y}\right)^2+\left(\frac{\partial v}{\partial y}\right)^2+\right. \\ & \left.\frac{1}{4}\left(\frac{\partial v}{\partial z}+\frac{\partial w}{\partial y}\right)^2\right]+2 \mu\left[\frac{1}{4}\left(\frac{\partial w}{\partial x}+\frac{\partial u}{\partial z}\right)^2+\right. \\ & \left.\frac{1}{4}\left(\frac{\partial w}{\partial y}+\frac{\partial v}{\partial z}\right)^2+\left(\frac{\partial w}{\partial z}\right)^2\right]\end{aligned}$ | (13) |
Applying the above energy control equation and numerical simulation, the temperature field distribution results of the wind tunnel could be obtained as a reference.
In Fig. 4, the temperature, in the central area of the cross-section, is the highest, but the temperature tested every 10 min shows no significant change in the central zone, and the temperature field could be approximated as being in a steady-state state.

|
Fig.4 Distance from air inlet: 1.5 m; the test wind speed: 1.5m/s; temperature field distribution cloud map of nozzle air temperature: 0 min(20.5 ℃), 10 min(20.6℃), 20 min(20.5℃) and 30min(20.3℃) |
In Fig. 5, the air inlet temperature is ca. 70 ℃, and the middle region of the cross-section owns the highest temperature, however, the area is significantly larger than that in Fig. 4. Owing to the air inlet temperature increasing, the wall temperature of the wind tunnel gradually increases. Compared with the wall temperature at 20 ℃, the wall temperature at 70 ℃ is closer to the air temperature in the central region. Therefore, in order to overcome the experimental error caused by the heat absorption of the wind tunnel wall steel plate, under the premise of achieving a stable air inlet temperature, the air temperature should be raised as much as possible. The wall steel plate should be heated by high-temperature air to gradually approach the air temperature, and the impact on the heat absorption of the wall on the temperature field of the wind tunnel section should be minimized as much as possible. The same conclusion could be obtained by comparing the temperature field distribution cloud maps of other wind speeds.

|
Fig.5 Distance from the air inlet: 1.5 m; the test wind speed: 1.5 m/s; temperature field distribution cloud map of nozzle air temperature: 0 min (70.4 ℃); 10 min (70.4 ℃); 20 min (69.9 ℃); 30 min (69.4 ℃) |
In the experiment, it was found that as the wind speed increases, the wind tunnel heats up faster, which is the reason that high wind speeds could lead to higher convective heat transfer coefficients of the air that is beneficial for improving the heat transfer of the air to the wind tunnel.
In Fig. 6, as the stabilization time progresses, the area of the central high-temperature zone gradually decreases, due to the high-speed temperature field calibration conducted firstly during the experiment; the convective heat transfer coefficient of the air is relatively high. When the air speed decreases, the convective heat transfer coefficient between air and the tunnel body also decreases. In the meantime, the heat transfer between the air and the tunnel body decreases, leading to a decrease in the temperature of the tunnel body. On the other hand, due to the decrease in wind speed, the convective heat transfer coefficient between the temperature sensor and the air decreases, resulting in a reduction in the area of the high-temperature zone in the center of the temperature field.

|
Fig.6 Distance from the air inlet: 1.5 m; the test wind speed: 8.9 m/s; temperature field distribution cloud map of nozzle air temperature: 0 min (20.2 ℃); 10 min (20.2 ℃); 20 min (20 ℃); 30 min (20 ℃) |
The phenomenon shown in Fig. 7 is similar to that in Fig. 6. Due to the decrease in experimental air velocity, the convective heat transfer coefficient between the air with the wind tunnel steel plate and temperature sensor decreases, resulting in a decrease in the area and temperature of the central high-temperature zone, as well as a decrease in the temperature of the tunnel body. The air inlet temperature in Fig. 7 is lower than the temperature shown in the temperature field cloud map, owning to a delay in the temperature change of the air inside the wind tunnel when adjusting the inlet air temperature during the experiment. During the debugging of the air inlet temperature, the air temperature exceeded the set temperature, in the meantime, the high-temperature air conducted convective heat transfer on the steel plate and temperature sensor of the tunnel, resulting in a situation where the temperature was higher than the set air inlet temperature.

|
Fig.7 Distance from the air inlet: 1.5 m; the test wind speed: 8.9 m/s; temperature field distribution cloud map of nozzle air temperature: 0 min (70.5 ℃); 10 min (69.4 ℃); 20 min (69.6 ℃); 30 min (70.2 ℃) |
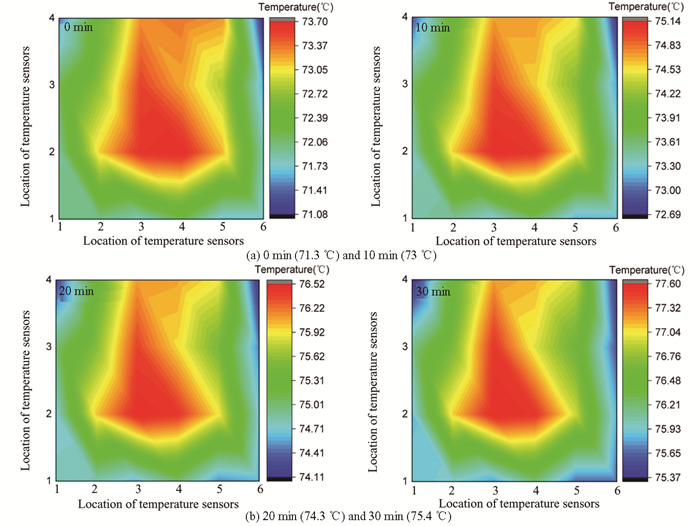
In Fig. 8, when the test wind speed was increased to 29 m/s, the central high-temperature zone is slightly smaller compared to that in Fig. 7, and significantly smaller compared to the high-temperature area in Fig. 5. The phenomenon indicates that as the wind speed increases, the high-temperature area becomes smaller, and the temperature difference between the central area and the cavity temperature is closer, resulting in a more uniform temperature field distribution.
|
Fig.8 Distance from the air inlet: 1.5 m; the test wind speed: 29 m/s; temperature field distribution cloud map of nozzle air temperature: 0 min (71.3 ℃); 10 min (73 ℃); 20 min (74.3 ℃); 30 min (75.4 ℃) |
In order to further observe the temperature field variation of the wind tunnel cross-section during steady state, in the paper, a temperature field with the distance of 3.4 m from the air inlet and an air velocity of 1.5 m/s is taken as the research object. When the inlet air temperature achieves stability, the data collection is conducted every 10 min to further analyze the temperature field variation with time, as shown in Fig. 9.

|
Fig.9 Distance from the air inlet: 3.4 m; the test wind speed: 1.5 m/s; temperature field distribution cloud map of nozzle air temperature: 0 min (20.4 ℃); 10 min (20 ℃); 20 min (19.4 ℃); 30 min (19.2 ℃); 40 min (19.1 ℃); 50 min (19.6 ℃); 60 min (19.9 ℃); 70 min (19.6 ℃); 80 min (19.7 ℃); 90 min (19.6 ℃) |
In the figure, the inlet temperature of the air gradually decreased from 20.4 ℃ to 19.6 ℃, because it is difficult to set the inlet temperature of the air to 20 ℃ without any error when adjusting the air heater, therefore, it is easy to cause deviation in the set temperature during the temperature adjustment process. On the other hand, as the experiment was adjusted from high to low wind speeds, the convective heat transfer coefficient between the air with the temperature sensor decreased. The temperature field continued to decrease with time, and the temperature difference between the central high-temperature area with the tunnel body gradually decreased. The temperature field of the entire cross-section gradually became uniform.
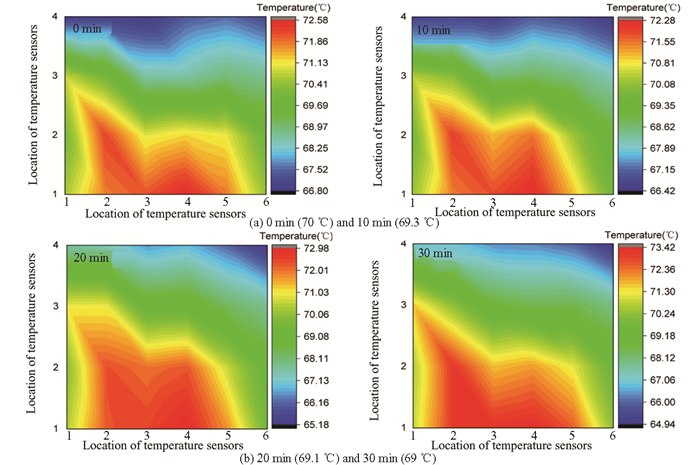
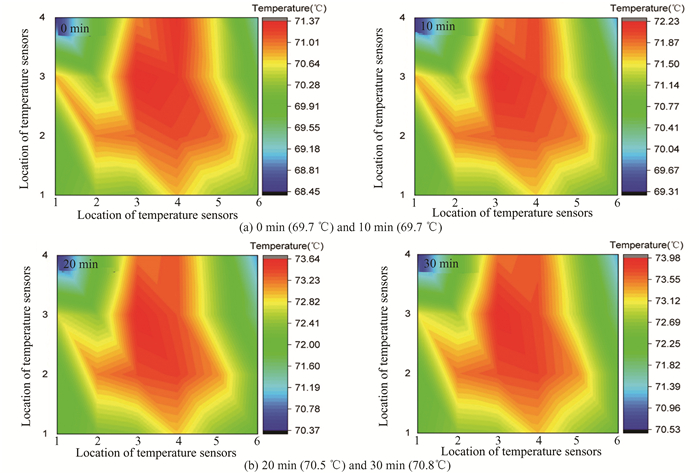
The distance, between the temperature field test section with the air inlet in Figs. 10, 11, 12, and 13, is 7.5 m. By comparison, the temperature field distribution in Figs. 11, 12, and 13 is relatively similar, indicating that when the wind speed reaches a certain value, the impact of wind speed on the temperature field will be no change significantly.
|
Fig.10 Distance from the air inlet: 7.5 m; the test wind speed: 1.5 m/s; temperature field distribution cloud map of nozzle air temperature: 0 min (70 ℃); 10 min (69.3 ℃); 20 min (69.1 ℃); 30 min (69 ℃) |
|
Fig.11 Distance from the air inlet: 7.5 m; the test wind speed: 8.9 m/s; temperature field distribution cloud map of nozzle air temperature: 0 min (69.7 ℃); 10 min (69.7 ℃); 20 min (70.5 ℃); 30 min (70.8 ℃) |

|
Fig.12 Distance from the air inlet: 7.5 m; the test wind speed: 18 m/s; temperature field distribution cloud map of nozzle air temperature: 0 min (69.9 ℃); 10 min (70.2 ℃); 20 min (70.4 ℃); 30 min (70.2 ℃) |

|
Fig.13 Distance from the air inlet: 7.5 m; the test wind speed: 29 m/s; temperature field distribution cloud map of nozzle air temperature: 0 min (71 ℃); 10 min (73 ℃); 20 min (74.3 ℃) |
In Figs. 14 and 15, the distance between the temperature field test section and the air inlet is both 12 m. As shown in Figs. 14 and 15, the high-temperature air region could be more evenly distributed, because the distance between the temperature field sensor with the air inlet of the wind tunnel could overcome the influence of the size and position of the air nozzle, resulting in a more stable airflow.

|
Fig.14 Distance from the air inlet: 12 m; the test wind speed: 8.9 m/s; temperature field distribution cloud map of nozzle air temperature: 0 min (69.9 ℃), 10 min (70.2 ℃) and 20 min (69.9 ℃) |

|
Fig.15 Distance from the air inlet: 12 m; the test wind speed: 18 m/s; temperature field distribution cloud map of nozzle air temperature: 0 min (69.7 ℃), 10 min (70 ℃) and 20 min (70 ℃) |
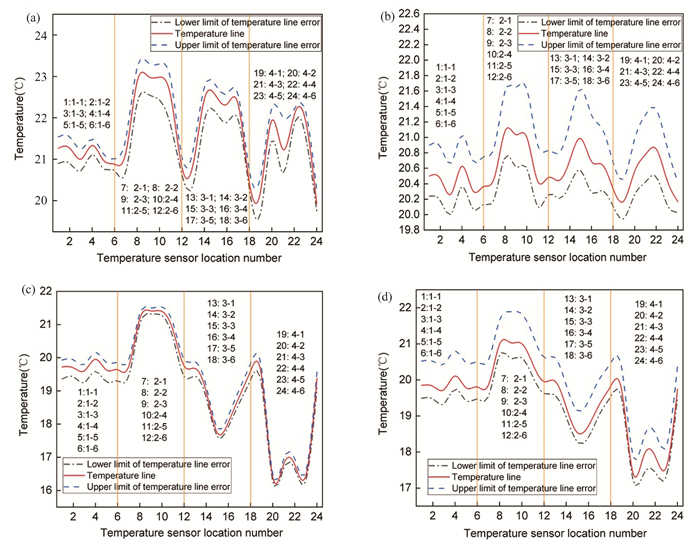
In order to further compare and analyze the distribution of cross-sectional temperature under different conditions, the influence of 20 ℃ nozzle air temperature, 1.5 m away from the nozzle, and different wind speeds on cross-sectional temperature, is summarized in Fig. 16. The numbers in the figure show different positions of the temperature sensor, and the error of the test data is shown through upper and lower limits of the temperature error curve in the figure. As shown in the figure, the temperature obtained by the central area temperature sensor is higher than the temperature of the boundary area.
|
Fig.16 Temperature variation curve at different positions of the cross-section; The distance from the air inlet: 1.5 m; (a) The test wind speed: 1.5 m/s; nozzle air temperature: 20 ℃; (b) The test wind speed: 8.9 m/s; nozzle air temperature: 20 ℃; (c) The test wind speed: 18 m/s; nozzle air temperature: 20 ℃; (d) The test wind speed: 29 m/s; nozzle air temperature: 20 ℃ |
In Fig. 17, the distance from the air nozzle is set to 12 m to observe the influence of different air velocities on the temperature distribution of the section. The temperature of the central zone is higher than that of the boundary zone. Observing Figs. 16 and 17, as the wind speed increases, the rate of change between the temperature located in the boundary area and the temperature in the central area significantly increases, due to increase in wind speed improving the heat transfer between the air and the tunnel. The decrease in air temperature in the boundary area is caused by the heat transfer between air and the cavity.

|
Fig.17 Temperature variation curve at different positions of the cross-section; The distance from the air inlet: 12 m; (a) The test wind speed: 1.5 m/s; nozzle air temperature: 20 ℃; (b) The test wind speed: 8.9 m/s; nozzle air temperature: 20 ℃; (c) The test wind speed: 18 m/s; nozzle air temperature: 20 ℃; (d) The test wind speed: 29 m/s; nozzle air temperature: 20 ℃ |
In order to accurately observe the temperature distribution of the wind tunnel section, the temperature distribution of the wind tunnel is simulated in the paper.
In the paper, the wind tunnel is simulated using unstructured grids with a number of approximately 1500000, mainly monitoring the continuity of the model until the residual error of the model basically tends to be stable. The height of the first boundary layer on the model is set to 0.1 mm, and the growth rate and the number of layers are set to 1.2 and 10, respectively. The model type is set to k-epsilon. Since the wind speed in the paper is lower than 0.3 Ma, the compressibility of air is not considered in the simulation, but is regarded as incompressible ideal gas. Air viscosity is regarded as a constant to simplify the model.
In Fig. 18, the temperature distribution of the wind tunnel is simulated under the wind speed of 8.9 m/s and the air inlet temperature of 343.15 K (70 ℃). The simulation results show that the closer to the air nozzle, the more uneven the temperature distribution. As the comparison shown in Figs. 18 (a) (b) (c), the temperature boundary of the air nozzle gradually becomes blurred, indicating that as the distance from the nozzle increases, the cross-sectional temperature of the wind tunnel gradually becomes uniform. The numbers in Figs. 18 (d), (e) and (f) could refer to the position of the temperature sensor in Fig. 2, and it could be found that the longer the temperature platform length is, the more uniform the temperature distribution is. Especially in Fig. 18 (f), the platform length of the three temperature distribution lines is basically consistent, but the platform temperature is lower than that in Figs. 18 (d) (e), own to the air nozzle size being 3.3 m×3.3 m. However, the temperature sensor in Fig. 18 (f) is located at a distance of 4 m from the ground, which is higher than the size of the air nozzle, so the platform temperature is lower than the others. In Fig. 18 (g), the temperature distribution on the axial section of the wind tunnel is shown, with the increase of the axial distance, the temperature distribution of the wind tunnel is gradually uniform, and a large vortex will appear above the air nozzle, affecting the temperature distribution of the air.

|
Fig.18 The wind speed: 8.9 m/s; Temperature field distribution cloud map of nozzle air temperature: 343.15 K; The wall temperature: 293.15 K; (a) The distance from air nozzle: 1.5 m; (b) The distance from air nozzle: 7.5 m; (c) The distance from air nozzle: 12 m; (d)-(f) Temperature distribution at sensor locations with different distances from air nozzle; (g) Temperature distribution in axial section of wind tunnel |
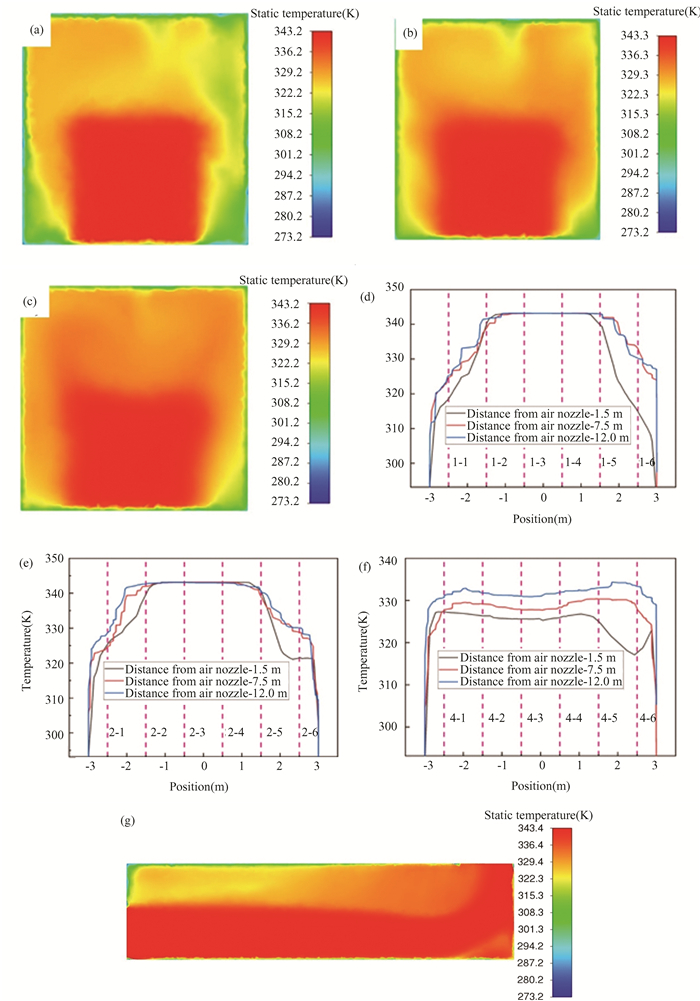
In Fig. 19, the wind speed is 29 m/s. Comparing Figs. 18 and 19, the changes are relatively similar. However, under the action of a wind speed of 29 m/s, the temperature boundary of the air nozzle at the same position section is more obvious, which indicates that high wind speed could improve the convective heat transfer effect, while other temperature images have little difference.
|
Fig.19 The wind speed: 29 m/s; Temperature field distribution cloud map of nozzle air temperature: 343.15 K; The wall temperature: 293.15 K; (a) The distance from air nozzle: 1.5 m; (b) The distance from air nozzle: 7.5 m; (c) The distance from air nozzle: 12 m; (d)-(f) Temperature distribution at sensor locations with different distances from air nozzle; (g) Temperature distribution in axial section of wind tunnel |
3 Conclusions
In the paper, a temperature field test and analysis were conducted on a certain wind tunnel. Based on the distribution of temperature field data, the following relevant conclusions could be given:
1) The test results showed that the temperature in the center area of the wind tunnel was higher than that near the tunnel body, because the hot air generated convective heat transfer between the tunnel bodies, resulting in a decrease in the air temperature zone.
2) In order to ensure the quality of the wind tunnel temperature field, it is necessary to insulation the outer surface of the wind tunnel to prevent energy loss and affect the quality of the temperature field.
3) On the other hand, in order to ensure the accuracy of the results obtained by the model during wind tunnel testing, it is necessary to consider the influence of the wind tunnel wall. Therefore, when conducting wind tunnel testing, the model should be placed at the center of the wind tunnel and be able to stay away from the wall.
4) When heating up the wind tunnel, in order to quickly heat up, a higher wind speed could be applied due to the higher the wind speed, the better the convective heat transfer effect and the higher the quality of the temperature field.
5) During the process of debugging the wind tunnel temperature field, it is recommended to conduct experiments with lower air temperatures as much as possible, because the temperature rise of the wind tunnel body is relatively rapid, while the cooling process is relatively slow. On the other hand, own to the delay effect of the debugging system, it is more difficult to debug from high to low temperatures.
6) The simulation results of the wind tunnel indicate that the temperature is higher in the area below the air nozzle size, but the platform length is shorter. In the area above the air nozzle size, the temperature platform length is longer and is less affected by the distance from the air nozzle. References
| [1] |
Liang Junke, Feng Xiufang, Yu Xueli, et al. Controlling the distribution of temperature in wind tunnel experiment with neural network. Journal of Taiyuan University of Technology, 2000, 31(4): 454-456. (  0) 0) |
| [2] |
Zhu Dezhong, Liao Li. Temperature distribution measurement of gas flow with high temperature using thermal video system. Journal of Engineering Thermophysics, 1999, 20(6): 738-741. (  0) 0) |
| [3] |
Li Yong, Li Guowen, Wang Weiming, et al. Design of subsonic velocity and airflow temperature controlled wind tunnel test-bed. China Mechnical Engineering, 2019, 30(12): 1441-1445. (  0) 0) |
| [4] |
Huang Minghai, Zang Shusheng, Ge Bing, et al. Method of infrared thermography measurement for temperature field of turbine vane in hot wind tunnel. Journal of Aerospace Power, 2014, 29(11): 2679-2683. DOI:10.13224/j.cnki.jasp.2014.11.019 (  0) 0) |
| [5] |
Wu Jun, Li Xiangdong, Pu Xuyang, et al. Calibration and evaluation of flow field in combustion-heating hypersonic high-temperature wind tunnels. Journal of Propulsion Technology, 2022, 43(10): 1-6. (  0) 0) |
| [6] |
Xu Pengbo, Qian Zhansen. Research on temperature prediction based on coupling of flow field and structure. Journal of Northwestern Polytechnical University, 2017, 35: 43-47. (  0) 0) |
| [7] |
Zhang Xinhuan, Zhang Pingtao, Peng Bo, et al. Prediction of icing wind tunnel temperature field with machine learning. Journal of Experiments in Fluid Mechanics, 2022, 36(5): 8-14. DOI:10.11729/syltlx20210196 (  0) 0) |
| [8] |
Zhang Xinhuan, Zhang Pingtao, Peng Bo, et al. Uniformity analysis of temperature field in wind tunnel based on machine learning. Cryogenics, 2022(5): 76-81. (  0) 0) |
| [9] |
Zhao Zhao, Xiong Jianjun, Zhang Pingtao, et al. Temperature field measurement of spray bar in icing wind tunnel based on distributed optical fiber temperature measurement. Computer Measurement & Control, 2021, 29(3): 14-17. (  0) 0) |
| [10] |
Zhang Pingtao, Wang Wenxuan, Guo Xiangdong, et al. Study on temperature uniformity of airflow at evaporator outlet of a large icing wind tunnel. Cryogenics, 2021(5): 68-72. (  0) 0) |
| [11] |
Hans Nyman, Mats Sandberg. The influence of external wind in tunnels. International Journal of Ventilation, 2011, 10(1): 31-46. DOI:10.1080/14733315.2011.11683933 (  0) 0) |
| [12] |
Jiménez-Portaz M, Chiapponi L, Clavero M, et al. Air flow quality analysis of an open-circuit boundary layer wind tunnel and comparison with a closed-circuit wind tunnel. Physics of Fluids, 2020, 32(12): 125120. DOI:10.1063/5.0031613 (  0) 0) |
| [13] |
He Y C, Cheung J C K, Li Q S, et al. Accurate determination of reference wind speed and reference static pressure in wind tunnel tests. Advances in Structural Engineering, 2019, 23(3): 1-6. DOI:10.1177/1369433219875302 (  0) 0) |
| [14] |
Feng D J, Li Z S, Ni J R. Sidewall effects of a wind tunnel on wind velocity and mass flux in aeolian sand transport. Geomorphology, 2009, 106: 253-260. DOI:10.1016/j.geomorph.2008.11.006 (  0) 0) |
| [15] |
Tian Ruifeng, Liu Pingan. Numerical Heat Transfer and Fluid Flow. Harbin: Harbin Engineering University, 2015.59-69.
(  0) 0) |
| [16] |
Tao Wenquan. Numerical Heat Transfer. Xi'an: Xi'an Jiaotong University Press, 2001: 78-120.
(  0) 0) |
| [17] |
Sun Li, Zhang Nan, Liu Xinhua, et al. Effect of boundary conditions on particle-fluid convection heat transfer. The Chinese Journal of Process Engineering, 2019, 19(6): 1075-1084. DOI:10.12034/j.issn.1009-606X.219118 (  0) 0) |
 2024, Vol. 31


