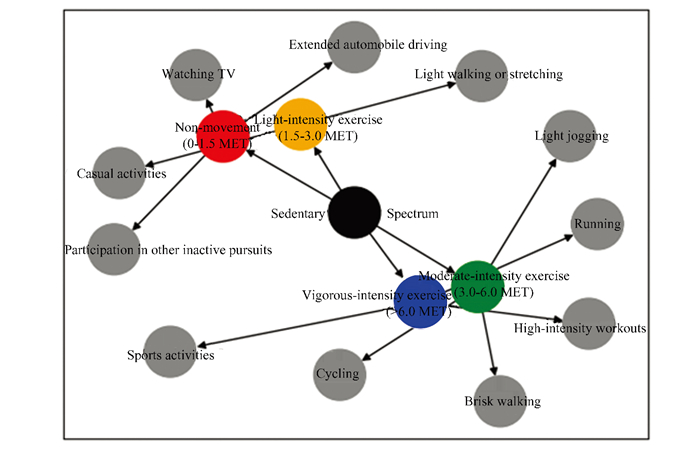
The increase in the prevalence of non-communicable mortality and morbidity has been shown by the latest research to be associated with sedentary lifestyles like reclining or sitting, regardless of physical exercise[1]. A sedentary lifestyle is characterized by a situation where an person's daily activities do not substantially increase the energy expenditure yonder the baseline of his/her inactive state. The significance of Sedentary Behavior (SB) with respect to fatality and other non-communicable risky diseases is demonstrated by this research, highlighting its prevalence, autonomy characteristics, and modifiability. Effectively reducing such deeds through rehabilitations or preventive healthcare interventions requires an assessment of patterns and associations related to sedentary behavior. In a recent comprehensive analysis by O'Donoghue et al.[2], gender, age, emotions, meditations and temperament were identified as factors associated with sedentary behavior. The identification of these covariates deeply depend on data from the general population, a common of whom do not meet recommended levels of daily activity. Additionally, correlations between sedentary behavior and other factors, such as extended periods of sitting at work, transportation, etc., are also plausible[3]. Sequential situations oriented toward sedentary behavior, as outlined by Kumar et al.[4] are elucidated with prolonged features using the term "transitory granularity or via multi-variant data aspects", denoting a short-term condition. Examine outcomes have associated the duration of screen time and sitting with elevated levels of intestinal obesity, fasting lipid profile, and indicators of glucose intolerance distinct from intestinal obesity and exercise duration as stated by Thorp et al.[5]. Prolonged periods of reclining may result in diminished enzymatic hydrolysis of triglycerides and lipid elimination, reduced fascination of plasma glucose, as well as decreased insulin creation in response to fructose. Furthermore, sedentary behaviors such as watching television programs, extended automobile driving, and participation in other inactive pursuits may increase the risk of attacks and other heart related issues. While sedentary behavior has conventionally viewed as a health concern, the findings by Warren et al.[6] proposed that encouraging protracted periods of reclining and light-intensity exercises could be beneficial. Sedentary activity is often assessed using the Metabolic Equivalent Task (MET), with the MET rating for a specific timeframe determining the average level of user activity. Fig. 1 illustrates the physical activity spectrum.
|
Fig.1 Physical activity intensity spectrum |
Recognizing inactive trends can help people become more aware of their individual sedentary inclinations and take measures to address such behaviors. The application of identified patterns to inform individuals about necessary changes can be undertaken by the individual's doctor. Previous research has delved into sedentary behavior. Owen et al.[3] have categorized sedentary behavior into four types (behavior during transportation, work, at home, and leisure) and 3 contexts in which it occurs (the home, the workplace, and the commuting setting) characterized personal (individualistic), community factors (interactional), ecological characteristics, external factors, and institutional landscapes for a specific higher education institution population. Despite clear delineations of sedentary habits, the specific factors contributing to sedentary behaviors differ for each person. Forming accurate subjective conclusions is a challenge for skilled medical professionals due to the simultaneous involvement of numerous variables, making the situation complex. The timing, such as the lack of an adequate workout plan, the daily routine involving rhythmic sitting in the workplace, and past sedentary behaviors like spending time on mobile phones every day after work, constitute three noteworthy and influential predictors of sedentary behavior[7]. The anticipation of sedentary habits is particularly advantageous for preventive programming activities and hinges on principles of patterned behavior. An individual impacted by sedentary behavior, commonly referred to as a "subject" is more likely to embrace recommended activities for reducing sedentary behavior if specific actions are integrated into their schedule, in accordance with patterned behavior principles. It is essential to suggest solutions to mitigate laziness, especially when the individual is expected to be inactive or in a sedentary state at some point in the future. For instance, contemporary devices have been created to alert viewers probable to persist lazy for further than 3 h while viewing mobile phones, prompting them to engage in movement during commercials and other breaks. Subjects are more prone to respond to notices that are personalized to a specific situation and provided in advance, as noted by Sathyanarayana et al.[8]
At times, a heightened risk of developing chronic health conditions has been associated with a sedentary lifestyle. For instance, an increased reliance on private automobiles for mobility may be connected to weight-related issues. Addressing the challenge of personalized physical activity guidelines requires an advanced learning approach capable of constructing a conceptual model for a comprehensible recommender system. These programs not only assist individuals in understanding how to apply assessment rules but also consider the temporal characteristics of subjects and the intricate dynamics involved in enhancing their health. Typically, automated systems monitor and organize subjects' physical behaviors to regulate health-oriented data systems, enabling automated services to adapt their workout routines dynamically. Additionally, a well-suited machine learning system can be employed to intricately examine sedentary behavior and its associated health impacts. To uncover these factors, our proposed approach suggests employing a machine learning strategy, specifically the "Stacked-LSTM (Long Short-Term Memory)", which processes timestamp recordings of subjects' physical movement. In our methodology, we analyze the historical sedentary patterns of subjects to identify temporal patterns that can be exploited to predict their subsequent behavior. Our primary aim is to examine the intricate patterns of sedentary behavior in adults, with a specific focus on various parameters, including the total duration spent in sedentary bouts and breaks. Acknowledging the significant links between sedentary habits and adverse health outcomes, our goal is to offer valuable insights into cardiovascular epidemiology and prevention. Below are the notable objectives of our work:
Objectives:
1) Characterize Sedentary Behavior patterns: Investigate and characterize sedentary behavior patterns among individuals, considering factors such as age, gender, and health history, using the identified datasets.
2) Develop predictive models: Utilize advanced analytical techniques, including the application of a stacked LSTM model, to simulate and predict recurring sedentary behavior patterns based on historical data.
3) Explore correlations with health factors: Investigate correlations between sedentary behavior and health factors, including BMI, smoking behavior, and history of health conditions, to discern potential associations and impacts.
4) Enhance methodologies for sedentary behavior recognition: Contribute to the advancement of methodologies for recognizing and analyzing sedentary behavior patterns, laying the groundwork for future research in this domain.
The rest of the section are categorized as follows: Section 1 describes the background of the work and the proposed method in introduced in Section 2. In Section 3, the result analysis of the proposed model is discussed. Section 4 concludes the work.
1 BackgroundRecently, Neural Network (NN) models have witnessed augmented utilization in the social healthcare sector. However, there exists a need to formulate a systematic neural network technique to comprehensively understand the impact of a sedentary lifestyle on health, encompassing the intricate processes involved in multi-variant relationships. This segment underscores the prevalent occurrence of sedentary lifestyles and the diverse methods employed to transition individuals from a sedentary state. The use of portable wearable information has led to the development of various information retrieval methods. A study conducted by Silva et al.[9] delved into the exploration of adult sedentary behavior patterns using a cross-sectional methodology, offering significant contributions to cardiovascular epidemiology and prevention. By examining diverse sedentary behavior metrics, including total time spent in sedentary bouts and breaks, the study illuminates intricate relationships and factors associated with sedentary habits. Migueles et al.[7] achieved a consensus regarding analytical methodologies to evaluate connections with accelerometer-based physical behaviors, covering not just physical activity but also sedentary behavior and sleep. It responds to the demand for standardized approaches in epidemiological investigations, offering valuable perspectives on analytical frameworks. These insights contribute to a better understanding of the correlations between metrics derived from accelerometers and health outcomes. Rawassizadeh et al.[10] analyzed behavior patterns of the adults in a multidimensional time-series dataset by means of wearable devices and scalable techniques. The researchers devised a strategy based on the premise that adults' daily activities occur in discrete time periods. Additionally, the strategy employs a combination of multiple sensors, rather than individual sensors, to reduce uncertainty by utilizing only reachable dynamic sensors. These proposed techniques are applicable to smartwatches without the necessity for cloud computing. The acquisition of contextual information through a suggested acquisition engine, as proposed by Nath[11], trusts on related buffering and restraints to uninterruptedly monitor the background state of the subjects' wearables. In this context, researchers propose that the acquisition engine could potentially reduce overall energy consumption.
A practical method for detecting drug usage through the utilization of sensing technology (biosensors) was showcased by Wang et al.[12], relying on the methodology of slide windows and the evaluation of anomalies. Task-dependent innovative approaches for extracting information from sensors and analyzing input from wearable electronic devices were underscored in a study by Kruse et al.[13]. The use of a frequency-domain technique given by He et al.[14] allows for the identification of recurring immobile patterns through behavioral time analysis. Trackers, while furnishing a record of user behaviors, generally do not notify users of observed harmful habits. Approaches like NN (Neural Network), SVM (Support Vector Machines), and DT (Decision Trees) produce satisfactory results in addressing broad healthcare concerns. The significance of proper data labeling is underscored when assessing the application of data analysis in the medical field. In a recent assessment conducted by Rehman et al.[15] on the extraction of wearable information, emerging concerns regarding security and privacy have been revealed. Researchers advocate for the optimization of data mining methods to enhance efficiency and minimize complexity. The prioritization of lightweight procedures over intricate models, typically implemented in a virtual environment, is recommended for handheld technology. As demonstrated by Gyllensten et al.[16], the conventional learning models, designed for a scientifically regulated population, exhibited notably poor precision when applied to an unrestricted dataset where participants engaged in their regular daily activities. Consequently, the inclusion of unrestricted information is considered crucial for effectively training such methods and should be utilized whenever possible[17]. Moreover, in the process of sleep-wake analysis and forecast utilizing inertial sensor acceleration and electrocardiographic information[18], computational intelligence approaches have been employed. neighborhood functionality-based LSTM was utilized to analyze the augmented sampling frequency of gesture and hastening data, along with their temporal dependence. The work resulted in accurate recognition and inactive behaviors classifications, as highlighted by Li et al.[19].
2 MethodologyIn this research, the presumption is made that sedentary activities exhibit time correlation, given that the subjects' subsequent and past behaviors are prejudiced by their present and past behaviors. Therefore, a preference is given to a stacked LSTM neural network. The LSTM network is chosen for its support of scalable factors and multi-variant transitory material.
2.1 Dataset DetailsIn our investigative process, we utilized two authentic datasets sourced from reputable outlets: The sedentary behavior research network (sedentary research database, n.d.) and sedentary behaviors recognition as suggested in WilliamPossos[20]. These datasets play a fundamental role in our research, furnishing valuable time series logs or records that meticulously document discrete behavioral patterns or labels pertinent to our research objectives[21].
1) The sedentary behavior research network dataset:
Source: The dataset originates from the sedentary behavior research network. Characteristics: This dataset is anticipated to encompass time series logs capturing the sedentary behavior patterns of individuals, thereby contributing to a holistic understanding of sedentary activities.
2) The sedentary behaviors recognition dataset:
Source: Acquired from sedentary behaviors recognition[20]. Characteristics: This dataset is expected to supply time series records that document identified sedentary behaviors. It serves as a valuable resource for our research, facilitating the recognition and analysis of distinctive sedentary patterns.
Each record contains a timestamp and a series of sedentary actions, encompassing prolonged sitting, television watching, bus or car riding, passive video game engagement, computer usage, and sitting in a car seat. The features of subject and the ranges are given in Table 1. The subsequent step involves data preprocessing which involves the partition of entire dataset is partitioned into time blocks for each observational day. Each time block consists of 6 h, referred to as sessions. With the aim of statistically identifying recurrent patterns of sedentary behavior, summary activity statistics are initially generated for each time block from the datasets. The proportion of all actions accomplished by the subject that are inactive is calculated for each block. For example, if the time slab spans 6 h, the ratio of Inactive Activity (IA) from the data record is computed using Eq.(1).
| Table 1 Subject features and range |
| $\mathrm{IA}=\frac{\vartheta_{B_i}^t}{\delta_{B_i}^t}, i=\{1, 2, 3, 4\}$ | (1) |
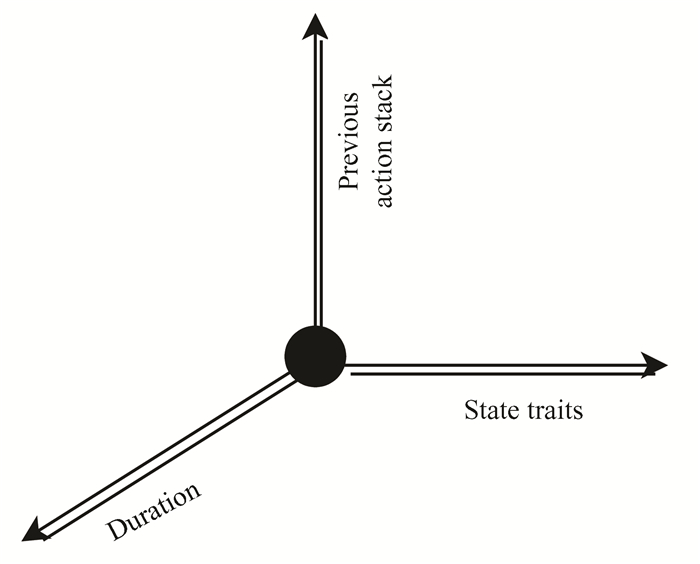
In this context,
|
Fig.2 3D view of multivariate sedentary vectors |
2.2 Stacked LSTM
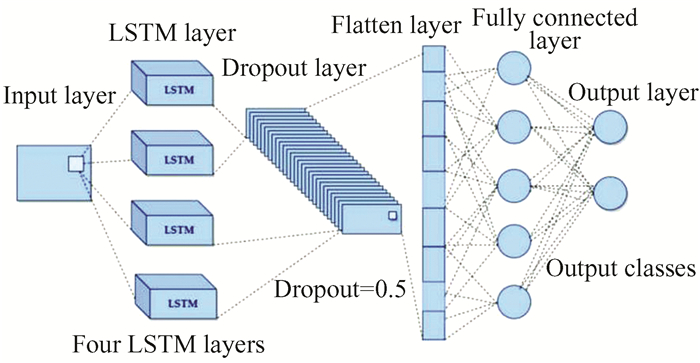
According to the analysis of outlet efficacies conducted in previous study, the stacked LSTM emerges as a right selection for forecasting multivariate time-series patterns. A "stacked" LSTM structure can be represented by a standard LSTM framework that includes multilayer LSTMs[22].The layers stacked above others provide a sequence of outcomes to the layers below them, rather than a single-valued consequence for the overall input. This configuration results in only one outcome for each input sampling interval, offering a graded stream over an extended span of time, which is particularly useful for machine learning-oriented applications. The schematic layout design of the LSTM neural network is depicted in Fig. 3.
|
Fig.3 Stacked LSTM architecture |
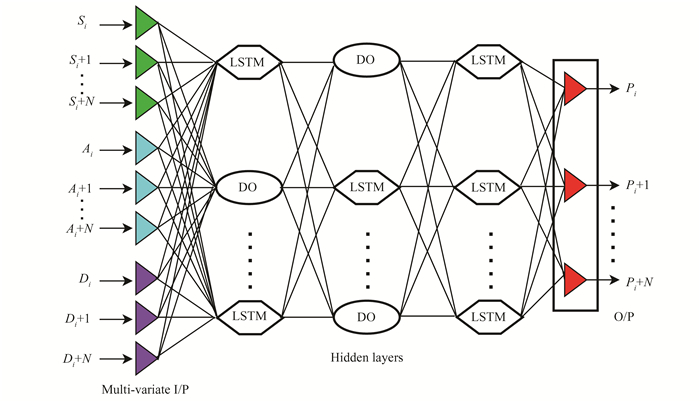
The subsequent step involves the construction of a fully connected neural network capable of assimilating information from previous stages and predicting future sedentary behavior patterns. A novel type of LSTM NN is presented, employing multi-stacked hidden layers with significant neural nodes. The DropOut (DO) procedure is combined with stacked LSTM to improve the model's generality and robustness. Moreover, it incorporates reinforcement loops as feedback links that enable the training and prediction of sequential relationships in multi-variate time-series input. Ultimately, the last layer of the LSTM is combined with a fully connected neural network that synthesizes insights from previous stages and forecasts future sedentary behavior patterns.
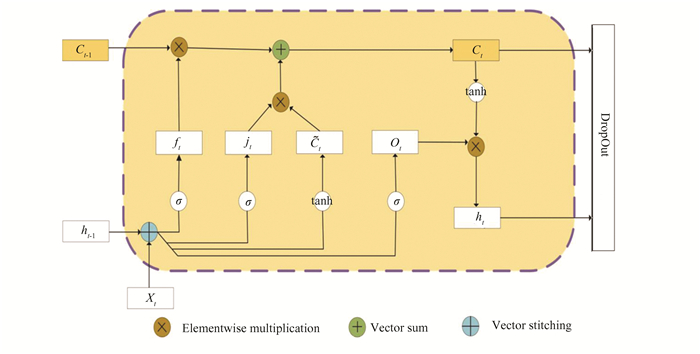
The proposed model's operational framework is illustrated in Fig. 4. The LSTM networking method, which is a variation of the Recurrent Neural Network (RNN), consists of 2 conditional stages and 3 gated actions within each LSTM cell.The diagrammaticrepresentation of the LSTM NN's layout is displayed in Fig. 5[12]. In this context, the state Ct is identified as the storage and memory state, managing crucial long-term correlations. This state is utilized to oversee vital enduring correlations. The subject's activity at time t is reflected by the second conditional state Ct. To govern both Mt and
|
Fig.4 Working process of the proposed model |
|
Fig.5 Working flow of LSTM[12] |
In this context, ft is assigned the responsibility of standardizing the multi-variate information that should be disregarded in the activity state (internal), Ct-1, of the subject at the time, t-1. Its task is then to control the quantity of storage and remember state Ct data that needs to be stored at the moment, t. The range [0, 1] is mapped by the sigmoidal function for ft and it, and the range [-1, 1] is mapped for Ct by the tanh activator. Eqs.(2)-(7)[12]articulate the relationship between the LSTM gates and states.
| $K_t=\sigma\left(\left[\left(M_t\right), (l)\right] \cdot \omega_{X_i}+\varphi_i\right)$ | (2) |
| $h_t=\sigma\left(\left[\left(M_t\right), \left(h_{t-1}\right)\right] \cdot \omega_{X_f}+\varphi_f\right)$ | (3) |
| $\tilde{f}_t=\tanh \left(\left[\left(M_t\right), \left(h_{t-1}\right)\right] \cdot \omega_{X_c}+\varphi_c\right)$ | (4) |
| $g_t=\left[i_t \otimes \widetilde{C}_t\right]+\left[f_t \otimes C_{t-1}\right]$ | (5) |
| $P_t=\sigma\left(\left[\left(X_t\right), \left(h_{t-1}\right)\right] \cdot \omega_{X_o}+\varphi_o\right)$ | (6) |
| $N_t=\left[O_t \otimes \tanh \left(C_t\right)\right]$ | (7) |
In this context, ωXf, ωXi, ωXo, ωXc represent the weight matrices of all input, output gates, and storage and memory state, respectively. Correspondingly, ωXf, ωXi, ωXo, ωXc denote the bias of input, output gates, and storage and remembering state, respectively. Additionally, using composite multiply '·' and component multiplication '⊗', [Mt= {Si+N, Ai+N, Di+N}, ht-1] is the process that combines the multi-variate vectors of time-varying input, Xt, and ht-1 into an extended vector matrix.
The suggested stacked LSTM architecture incorporates the dropout technique to enhance generalizability. During the NN training procedures, the dropout technique randomly excludes neurons with a specific likelihood to prevent interdependence among neurons. In essence, an average of p fold population of initial neurons is activated. However, during the testing process, all integrated neurons are typically activated, leading to unstable network outcomes. To address this issue, the processed value by each neuron, especially during testing, is multiplied by p. Optimal results were achieved when p=0.5. Consequently, some neurons are eliminated and adapted during activation, imparting high resilience to the network due to the arbitrary diversification of processed outcomes. The dropout approach serves as an effective method for addressing overfitting issues in the LSTM model by reducing the system's complexity.
3 DiscussionThe intensity of Bi is shaped by the person's conduct, prejudiced by the precise timeframe during which the subject has been exposed to previous data. Put differently, if a person's movements in the next hour (Xt+2) hinge on their ongoing action and what they did in the 3 h preceding it (Xt+1, Xt, and Xt-1), then the necessary magnitude of Bi (ζ) to forecast their behavior is three hours. The model can proficiently illuminate a wide array of behavioral patterns across subjects with variable degrees. To gauge the effectiveness of the proposed stacked LSTM model, we juxtapose it against a scalable algorithm and a frequency domain algorithm. For this assessment, ten subjects were chosen randomly for testing, each with distinct blocks. The proposed approach was implemented using Python 3.8.10 as the primary programming language. The key machine learning and deep learning libraries utilized include:
1) TensorFlow 2.5.0: TensorFlow served as the core framework for building and training the stacked Long Short-Term Memory (LSTM) model, providing efficient tools for constructing neural networks.
2) Keras 2.4.3: Keras, integrated with TensorFlow, was employed for its high-level neural network API, simplifying the model-building process and enhancing code readability.
The code was executed on a high-performance computing cluster with NVIDIA GPUs to accelerate model training. The preprocessing and analysis of sedentary behavior data were conducted using Pandas 1.3.3 and NumPy 1.21.2 for efficient data manipulation and statistical computations.
The evaluation of the proposed stacked LSTM model is assessed in comparison with a scalable process and a frequency domain system to demonstrate its effectiveness. Various analytical indicators are employed to evaluate the effectiveness of the suggested approach, including the MAE (Mean Absolute Error), the RMSE (Root Mean Square Error), the correlation coefficient-r, and the MAPE (Mean Absolute Percentage Error). The following equations describe these indicators:
| $\text { MAE }=\frac{1}{d} \sum\limits_{t=1}^T\left|\left(a_t-\hat{a}_t\right)\right|$ | (8) |
| $\text { RMSE }=\sqrt{\frac{1}{d} \sum\limits_{t=1}^T\left(a_t-\hat{a}_t\right)^2}$ | (9) |
| $r=\frac{\sum\limits_0^T\left[\left(a_t-\bar{a}_t\right) \cdot\left(\hat{a}_t-\overline{\hat{a}}_t\right)\right]}{\sqrt{\sum\limits_0^T\left(a_t-\bar{a}_t\right)^2} \cdot \sqrt{\sum\limits_0^T\left(\hat{a}_t-\overline{\hat{a}}_t\right)^2}}$ | (10) |
| $\text { MAPE }=\frac{1}{d} \sum\limits_{t=1}^T\left|\frac{\left|\left(a_t-\hat{a}_t\right)\right|}{a_t}\right| \times 100$ | (11) |
In the given scenario, d representes the total size of behavioral information, at indicates the actual value at t,
| Table 2 Performance analysis of stacked LSTM on various subjects |
The observations in Table 2 reveal that subjects were more inclined to engage in shorter periods of sedentary behavior (ζ=3) compared to longer periods (ζ=6). Despite experiencing irregular sedentary behaviors at different Bi, this indicates that each subject did not participate in repeated reclining.
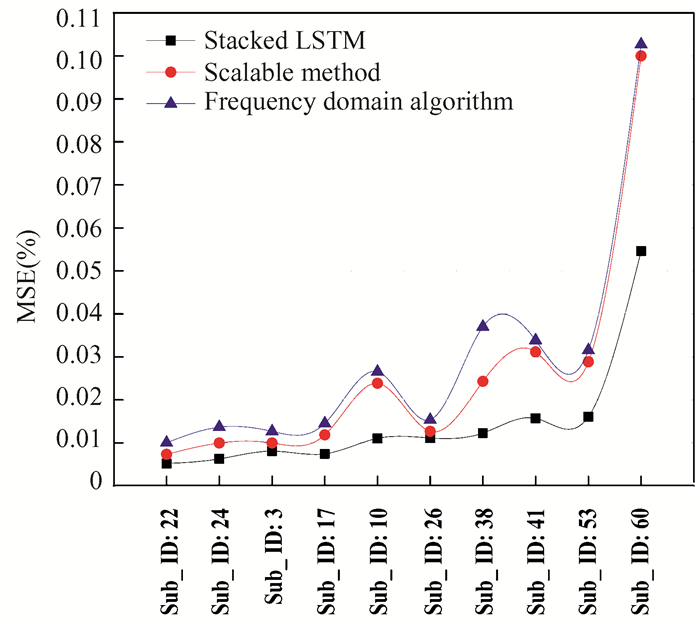
The models for Subjects 19, 24, and 26 demonstrated the best fit and the minimum MSEs compared to additional themes. Illustrated in Fig. 6, the factors (Sn, An, Dn) of the stacked LSTM influenced the pattern change and learning quality, both of which could be adjusted through trials. The effectiveness of the suggested stacked LSTM model in learning was assessed by varying the values of hidden neurons, and the model parameters were subsequently calculated.
|
Fig.6 Analysis of MSE |
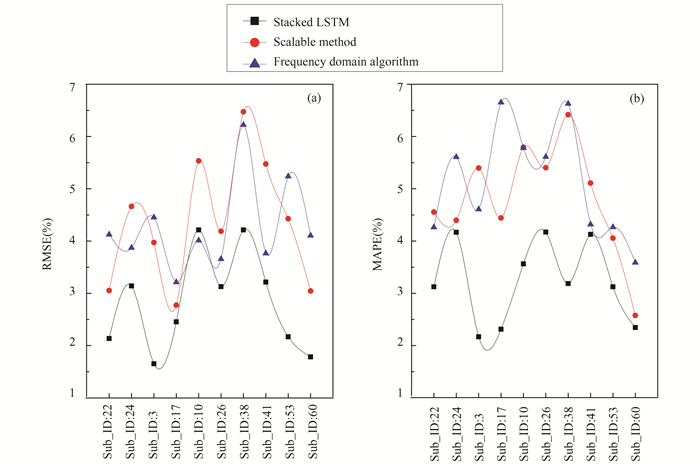
Fig. 7 displays the RMSE and MAPE for each subject. Subjects 3 and 22 showed the bottommost RMSE and MAPE, indicating the potential utility of multi variate sequential datasets not considered in previous models. However, a notable limitation of the study is that the absence of a measures assessment of posture during the reclining period, a significant fault in all methods.
|
Fig.7 Analysis of (a) RMSE and (b) MAPE |
Our previous representations emphasized multi-variate sequential patterns, recognizing the importance of acknowledging recurring behaviors at any given time. To capture correlations across various timescales, specifically on an hourly basis as well as considering weekly and monthly recurrent trends, we employed a time-series-based stacked LSTM model. Investigating all conceivable timeframes could result in a comprehensive exploration of recurring patterns, but it may prove inefficient. When seeking recurrent trends/patterns, we analyze the proportion of time spent sitting as a continuous signal, its dynamics depending on the frequency of sitting occurrences. So, it is reasonable to explore information in the time-frequency domain, as temporal iterations are unceasing.
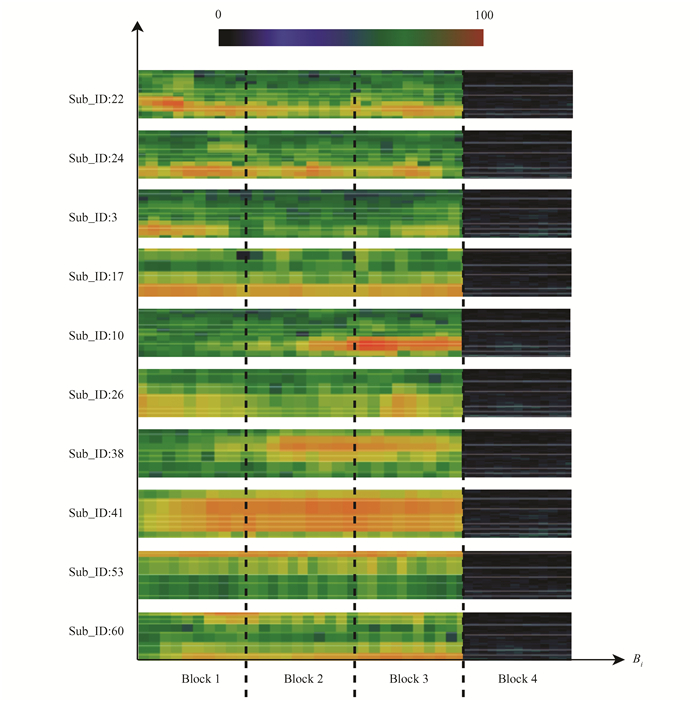
Sedentary behavior is commonly observed amid people of all ages and genders who engage in less physical activity, presenting a challenge that affects everyone equally. On the other hand, persons in salaried positions are more susceptible to being sedentary. In Fig. 8, it is shown that the 3 multi-variate mechanisms are positively and statistically significantly linked to lower health perception and physical inactivity, as indicated by the findings (r-value closer to 1). This correlation has not been consistently observed in other studies. The fourth block denotes very low work intensity, indicating a continuous state of sleep. This may be attributed to the fact that the person is sedentary in certain situations, raising the possibility of accomplishing low-intensity exercise routines. Challenges in completing high-intensity workouts may lead individuals to become demoralized by their specific difficulties.
|
Fig.8 Sedentary analysis of different subjects |
4 Conclusions
In summary, the connection between sedentary behavior in adults and the preceding six hour window blocks of sedentary activity suggests recurring patterns of sedentary trends. Consequently, a stacked LSTM model was employed to feign these sedentary tendencies and predict future sedentary behavior based on past behavior. Starting with unrefined activity archives, the research underwent preprocessing, established the stacking LSTM model sequence, explored event traces for relevant activities and passivity features, and then evaluated the conceptual method by means of RMSE, MSE, MAPE, and r-correlation metrics. Ultimately, the stacked LSTM model successfully simulated state traits, previous action stacks, and duration, achieving a 99% accuracy level. The work is solely concentrated on two predefined datasets (adults). As part of future studies, the model's evaluation will extend to a wider range of demographics and a higher sample size. Additionally, subjects will be equipped with wearable devices to continuously monitor their physical activity, enabling the collection of real-time data.References
| [1] |
Bellettiere J, Lamonte M J, Evenson K R, et al. Sedentary behavior and cardiovascular disease in older women: The objective physical activity and cardiovascular health (OPACH) study. Circulation, 2019, 139: 1036-1046. DOI:10.1161/CIRCULATIONAHA.118.035312 (  0) 0) |
| [2] |
O'Donoghue G, Perchoux C, Mensah K, et al. A systematic review of correlates of sedentary behaviour in adults aged 18-65 years: A socio-ecological approach. BMC Public Health, 2016, 16: 163. DOI:10.1186/s12889-016-2841-3 (  0) 0) |
| [3] |
Owen N, Sugiyama T, Eakin E E, et al. Adults' sedentary behavior. American Journal of Preventive Medicine, 2011, 41(2): 189-196. DOI:10.1016/j.amepre.2011.05.013 (  0) 0) |
| [4] |
Kumar V V, Raghunath K M K, Muthukumaran V, et al. Aspect based sentiment analysis and smart classification in uncertain feedback pool. International Journal of System Assurance Engineering and Management, 2021, 13(Suppl 1): 252-262. DOI:10.1007/s13198-021-01379-2 (  0) 0) |
| [5] |
Thorp A A, Healy G N, Owen N, et al. Deleterious associations of sitting time and television viewing time with cardiometabolic risk biomarkers: Australian diabetes. Obesity and Lifestyle (AusDiab) study 2004-2005. Diabetes Care, 2009, 33(2): 327-334. DOI:10.2337/dc09-0493 (  0) 0) |
| [6] |
Warren T Y, Barry V, Hooker S P, et al. Sedentary behaviors increase risk of cardiovascular disease mortality in men. Medicine and Science in Sports and Exercise, 2010, 42(5): 879-885. DOI:10.1249/mss.0b013e3181c3aa7e (  0) 0) |
| [7] |
Migueles J H, Aadland E, Andersen L B, et al. GRANADA consensus on analytical approaches to assess associations with accelerometer-determined physical behaviours (physical activity, sedentary behaviour and sleep) in epidemiological studies. British Journal of Sports Medicine, 2022, 56(7): 376-384. DOI:10.1136/bjsports-2020-103604 (  0) 0) |
| [8] |
Sathyanarayana A, Joty S R, Fernández-Luque L, et al. Impact of physical activity on sleep: A deep learning based exploration. ArXiv, abs/1607.07034. 2016.
(  0) 0) |
| [9] |
Silva G O, Cunha P M, Oliveira M D, et al. Patterns of sedentary behavior in adults: A cross-sectional study. Frontiers in Cardiovascular Medicine, 2023, 10. DOI:10.3389/fcvm.2023.1116499 (  0) 0) |
| [10] |
Rawassizadeh R, Momeni E, Dobbins C, et al. Scalable daily human behavioral pattern mining from multivariate temporal data. IEEE Transactions on Knowledge and Data Engineering, 2016, 28(11): 3098-3112. DOI:10.1109/tkde.2016.2592527 (  0) 0) |
| [11] |
Nath S. ACE: Exploiting correlation for energy-efficient and continuous context sensing. IEEE Transactions on Mobile Computing, 2013, 12(8): 1472-1486. DOI:10.1109/tmc.2013.12 (  0) 0) |
| [12] |
Wang X, Zhang Y. Multi-Step-Ahead time series prediction method with stacking LSTM neural network. 2020 3rd International Conference on Artificial Intelligence and Big Data (ICAIBD). Piscataway: IEEE, 2020: 51-55. DOI: 10.1109/icaibd49809.2020.9137492.
(  0) 0) |
| [13] |
Kruse N T, Hughes W E, Benzo R M, et al. Workplace strategies to prevent sitting-induced endothelial dysfunction. Med Sci Sports Exerc, 2018, 50(4): 801-808. DOI:10.1249/MSS.0000000000001484 (  0) 0) |
| [14] |
He Q, Agu E O. A rhythm analysis-based model to predict sedentary behaviors. 2017 IEEE/ACM International Conference on Connected Health: Applications, Systems and Engineering Technologies (CHASE). Piscataway: IEEE, 2017: 383-391. DOI: 10.1109/chase.2017.122.
(  0) 0) |
| [15] |
Rehman M, Liew C, Wah T, et al. Mining personal data using smartphones and wearable devices: A survey. Sensors, 2015, 15(2): 4430-4469. DOI:10.3390/s150204430 (  0) 0) |
| [16] |
Gyllensten I C, Bonomi A. Identifying types of physical activity with a single accelerometer: Evaluating laboratory-trained algorithms in daily life. IEEE Transactions on Biomedical Engineering, 2011, 58(9): 2656-2663. DOI:10.1109/TBME.2011.2160723 (  0) 0) |
| [17] |
Sedentary Research Database. (n. d. ). The Sedentary Behaviour Research Network (SBRN). https://www.sedentarybehaviour.org/sedentary-research-database/
(  0) 0) |
| [18] |
Chen Z, Wu M, Wu J, et al. A deep learning approach for Sleep-Wake detection from HRV and accelerometer data. IEEE EMBS International Conference on Biomedical & Health Informatics (BHI). Piscataway: IEEE, 2019: 1-4. DOI: 10.1109/bhi.2019.8834502.
(  0) 0) |
| [19] |
Li X, Zhang Y, Jiang F, et al. A novel machine learning unsupervised algorithm for sleep/wake identification using actigraphy. Chronobiology International, 2020, 37: 1-14. DOI:10.1080/07420528.2020.1754848 (  0) 0) |
| [20] |
WilliamPossos. New dataset for sedentary behaviors recognition. 2021. GitHub. https://github.com/WilliamPossos/sedentary-behaviors-dataset.
(  0) 0) |
| [21] |
Khan A B F, Kamalakannan K, Ahmed N S S. Integrating machine learning and stochastic pattern analysis for the forecasting of time-series data. SN Computer. Science, 2023, 4: 484. DOI:10.1007/s42979-023-01981-0 (  0) 0) |
| [22] |
Christofaro D G D, Tebar W R, Vanderlei L C M, et al. Association of cardiac autonomic modulation with different intensities of physical activity in a small Brazilian inner city: A gender analysis. European Journal of Sport Science, 2023, 23(4): 649-655. DOI:10.1080/17461391.2022.2044913 (  0) 0) |
 2024, Vol. 31


