2. Department of Virtual Simulation, Suzhou Sonavox Electronics Co., Ltd., Suzhou 215100, Jiangsu, China
Most practical assembled structures do not comply with an assumption of linearity. The complex non-linearity will be introduced into mechanical products due to the existing of nonlinear elements. The existing of nonlinear elements can no longer be neglected due to their amplitude-dependent properties[1-2]. Some research has been carried out in vibration analysis of nonlinear structures. Engineers need to identify the nonlinear elements in order to predict output vibration response during product design stage[3-4]. The investigation of nonlinear vibration is important for mechanical product improvement. With the dramatic improvement of vibration test techniques, it is necessary to develop general method to extract nonlinear elements for industrial applications.
Vibration test is necessary for nonlinear mathematical model update. Importantly, the presence of non-linearity can be detected in vibration tests at larger excitation levels[5-6]. The FRF might be distorted with increasing loading levels, the distortion of FRF for different excitation levels can offer meaningful insight into nonlinear behaviour. The variation of receptance can also be considered as evidence of structural non-linearity, and even the jump phenomenon may occur. As FRF in nonlinear system is not consistent, and it is dependent on response amplitude levels[7]. The evolution of modal parameters of nonlinear system for different output response often follows a particular law due to non-linearity, which is used to predict vibration response of nonlinear structures[8].
Some techniques have been proposed for nonlinear element identification. The linearity plot method is the most convenient method. Goege[9] provided a fast nonlinear characterization for large scale structures. The resonance frequencies and damping ratios of large aircraft were fitted as particular functions. Carrella[10] estimated the amplitude-dependent natural frequency and modal loss factor by modal test. The realization of non-linear identification is conducted by Restoring Force Surface (RFS) method. Feldman[11] utilized RFS to perform the nonlinear identification from measured vibration data. Yuan[12] compared RFS and Hilbert transform method based on vibration test of piezoelectric bimorph plate. The describing function method offers well description of nonlinear behaviour, which allows the quantification of practical non-linearity[13-15]. Wang[16] proposed the equivalent dynamic stiffness mapping technique, and the method was verified by classical numerical and experimental examples. Jalali[17] detected the multiple unknown elements in a nonlinear system by series FRFs and a reference linear one. Londo?o[18] presented a technique for extraction of backbone curves of damped nonlinear systems. The technique for nonlinear stiffness identification needed the vibration response with steady-state.
There is a need to extend the identification technique to practically extract structural non-linearity. In this study, constant response vibration test is developed to identify nonlinear stiffness and damping element in frequency-domain. The displacement amplitude is maintained in constant displacement vibration test. The velocity amplitude is maintained in constant velocity vibration test. The identification method depends on the basic idea that nonlinear structures exhibit linear behavior under steady response amplitude[19-20]. The idea is equivalent to the HBM with first-order expansion[21]. The displacement or velocity varies only within a limited range. Equivalent stiffness or damping is obtained for varied displacement or velocity response. The stiffness or damping function is constructed by fitting to describe the nonlinear elements. Response control vibration test is implemented to identify the pre-unknown nonlinear element of experimental setup. The stiffness and damping elements are approximated with ordinary polynomials. Finally, the predicted response is compared with the measured one, which shows a certain identification accuracy.
1 Estimation of Nonlinear Force 1.1 TheoryThe basic theories are given in Refs.[20] and [21]. Some nonlinear structures exhibit linear behavior for steady response amplitude, thus equivalent linear analysis is applicable in response control vibration test.
The dynamic property of nonlinear system in steady-state response is corresponding to effective stiffness and damping. It is based on the equivalent linear concept. If the steady-state response can be considered to respond at the frequency of excitation, only the primary harmonic is considered in the describing function method, which is equivalent to application of HBM with first order expansion. The dynamic behaviour of a nonlinear system with amplitude-dependent damping and stiffness can be presented as Eq. (1).
| $ m \ddot{x}+c(V) \dot{x}+k(X) x=f(t) $ | (1) |
where m represents the modal mass, k(X) is the stiffness function, c(V) is the damping function, and V and X denote the displacement and velocity amplitude respectively. If the response amplitude is kept constant for the excitation frequency range, k(X) and c(V) in Eq. (1) are considered as constant.
If the nonlinear structure is excited by harmonic excitation and the force value is as shown in Eq.(2).
| $ f(t)=F \mathrm{e}^{\mathrm{i} \omega t} $ | (2) |
where F is excitation amplitude, ω is the excitation frequency, and i denotes the imaginary unit.
The governing equation of the nonlinear system can be expressed as Eq. (3). The internal nonlinear force fn(x,
| $ m \ddot{x}+f_n(x, \dot{x})=f(t) $ | (3) |
| $ f_n(x, \dot{x})=f_k(x)+f_c(\dot{x}) $ | (4) |
where x,
This procedure will be illustrated through experimental setup with pre-unknown non-linearity. The identification using ordinary orthogonal polynomials is applied to rather special function. The order of fitting polynomials is discussed. The nonlinear spring and damping force is assumed as follows:
| $ f_k(x)=k_1 x+k_2 x|x|+k_3 x^3+k_4 x^3|x| $ | (5) |
| $ f_c(\dot{x})=c_1 \dot{x}+c_2 \dot{x}|\dot{x}|+c_3 \dot{x}^3+c_4 \dot{x}^3|\dot{x}| $ | (6) |
Moreover, the nonlinear elements of engineering structures are usually unknown before nonlinear characterization. The internal nonlinear force needs to be assumed and suitable nonlinear function needs to be selected for nonlinear modeling.
It is assumed that most of the vibration energy is concentrated in the excitation frequency[22-23]. The super-harmonics and the sub-harmonics are suppressed due to the damping effect. The steady-state vibration response only containing the primary harmonic component is presented as Eq. (7), where β=ωt+φ denotes the phase information of output response.
Substituting Eq. (7) into the polynomials nonlinear spring and damping force, it could be expanded in the Fourier series by Eq. (8).
| $ x=X \mathrm{e}^{\mathrm{i} \beta} $ | (7) |
| $ f_n(x)=\frac{\mathrm{i}}{\pi} \int_0^{2 \pi} f_n(x, \dot{x}) \mathrm{e}^{-\mathrm{i} \beta} \mathrm{~d} \beta $ | (8) |
When the Euler's formula is introduced,
| $ e^{-\mathrm{i} \beta}=\cos (\beta)-\mathrm{i} \sin (\beta) $ | (9) |
It yields:
| $ f_n(x)=\frac{1}{\pi} \int_0^{2 \pi} f_n(x, \dot{x}) \sin \beta \mathrm{d} \beta+\\\frac{\mathrm{i}}{\pi} \int_0^{2 \pi} f_n(x, \dot{x}) \cos \beta \mathrm{d} \beta $ | (10) |
The stiffness and damping function is given to present equivalent stiffness and damping coefficient as
| $ k(X) \approx \frac{1}{\pi X} \int_0^{2 \pi} f_k(x) \sin \beta \mathrm{d} \beta $ | (11) |
| $ c(V) \approx \frac{1}{\pi \omega X} \int_0^{2 \pi} f_c(\dot{x}) \cos \beta \mathrm{d} \beta $ | (12) |
| $ k(X)=k_1+\Delta_k $ | (13) |
| $ c(V)=c_1+\Delta_c $ | (14) |
For the polynomials nonlinear forcing, the stiffness and damping function of Eq.(5) and Eq.(6) take the form as Eq. (13) and Eq. (14), where
| $ \Delta_k=\frac{8}{3 \pi} k_2 X+\frac{3}{4} k_3 X^2+\frac{32}{15 \pi} k_4 X^3\\ \Delta_c=\frac{8}{3 \pi} c_2 V+\frac{3}{4} c_3 V^2+\frac{32}{15 \pi} c_4 V^3 $ |
The stiffness and damping function is dependent on displacement and velocity response amplitude. It can be fitted by the equivalent stiffness and damping coefficient of response.
Then the nonlinear receptance expression of the system can be written in terms of stiffness and damping function as shown in Eq. (15). The complex dynamic stiffness can be defined according to Eq. (15), as shown in Eq.(16). The amplitude of nonlinear internal force in Eq. (16) can be presented as Eq. (17).
| $ H_n=\left(-\omega^2 m+\mathrm{i} \omega \cdot\left(c_1+\Delta_c\right)+\left(k_1+\Delta_k\right)\right)^{-1} $ | (15) |
| $ D(\omega, X)=H_n^{-1} $ | (16) |
| $ N(\omega, X)=\left(H_n^{-1}+\omega^2 m\right) X $ | (17) |
The equivalent stiffness and damping can be obtained by conducting a constant displacement/velocity vibration test. It is necessary, but not strictly required, to maintain a constant displacement or velocity response during the test. The force level is adjusted to keep the constant output response within a certain frequency range.
The constant response vibration test results in FRFs as follows:
| $ \begin{aligned} & H_X(\omega, X)=\frac{X(\omega)}{F(\omega)}= \\ & \quad \frac{A(X)}{\omega_{\mathrm{r}}^2(X)-\omega^2+2 \mathrm{i} \xi_{\mathrm{r}}(X) \omega \omega_{\mathrm{r}}(X)} \end{aligned} $ | (18) |
| $ \begin{aligned} & H_{\mathrm{V}}(\omega, V)=\frac{V(\omega)}{F(\omega)}= \\ & \quad \frac{B(V)}{\omega_{\mathrm{r}}^2(V)-\omega^2+2 \mathrm{i} \xi_{\mathrm{r}}(V) \omega \omega_{\mathrm{r}}(V)} \end{aligned} $ | (19) |
where HX(ω, X) is FRF of displacement control test. HV(ω, V) is FRF of velocity control test. A(X) or B(V) is the modal constant, ωr(X) and ωr(V) are the resonant frequencies, and ξr(X) and ξr(V) are the damping coefficients. To be sure, the parameters vary with the control response. Note that Eq. (18) and Eq. (19) can be solved using an iterative approach. The real part of HX(ω, X) is used to extract the resonant frequency ωr(X). The imaginary part of HV(ω, V) is used to extract damping coefficient ξr(V). The resonant frequency and damping ratio vary with the response amplitude. The modal quantities need to be converted into spatial parameters to obtain equivalent stiffness and damping.
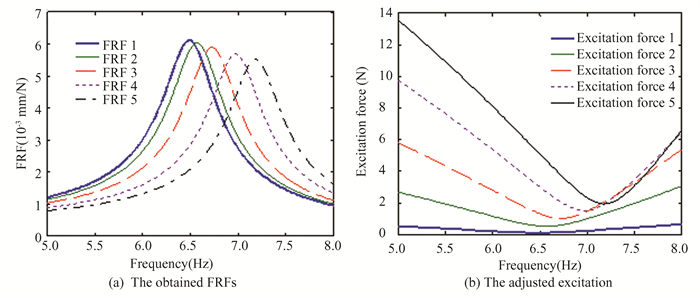
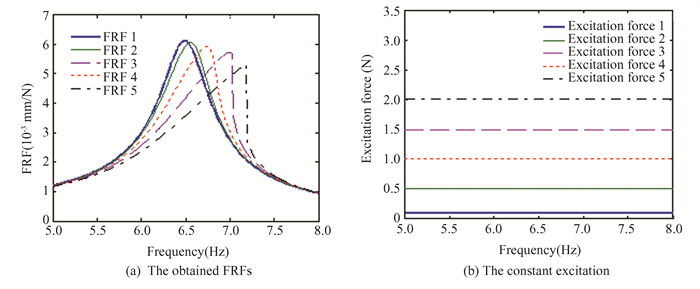
1.2 Identification ProcedureThe nonlinear FRFs are important for identification method based on frequency domain. The constant response testing method is proposed. Fig. 1(a) shows the FRFs of a response control vibration test. Fig. 1(b) shows the adjusted excitation level to maintain a constant response. During the procedure, dedicated excitation signals are employed to control the response amplitude as constant using a feedback control system. The FRFs avoid nonlinear distortion and exhibit non-deformed FRFs. The nonlinear structure is actually linearized at the fixed response level. The excitation force in response control vibration test is a variable. The conventional linear analysis tool is applicable for non-deformed FRFs. Fig. 2(a) shows the FRFs of excitation control vibration test. Fig. 2(b) shows the constant excitation level. As the the excitation level increases, the non-linearity can be checked by the FRF deformation. In contrast to Fig. 1(a), the nonlinear FRFs shift due to inherent non-linearity. The distorted FRFs can be used to characterize the non-linearity and judge its types. In contrast to Fig. 1(b), the excitation force in response control vibration test is changed in the frequency range.
|
Fig.1 FRFs by response control vibration test |
|
Fig.2 FRFs by excitation control vibration test |
The identification procedure is presented in Fig. 3. First, response control vibration results in FRFs within certain frequency range. FRFs are used to extract modal data ωr(Xi) and ξr(Vi) using conventional linear analysis tools. obviously, it refers to a fixed value of the response amplitude. Then, the modal quantities are converted into spatial quantities. Equivalent stiffness is extracted by relationship ke=mωr2(Xi). Equivalent damping is extracted by relationship ce=2ξr(Vi)mωr(Vi). Thirdly, extraction tools are applied for each response control test. The discrete stiffness ke is fitted as a function of displacement amplitude. The discrete damping ce is a fitted as function of velocity amplitude. Stiffness function k(X) is fitted by discrete stiffness ke and is dependent on X. Stiffness function c(V) is fitted by discrete damping ce and is dependent on V. The fitting function reveal the inherent non-linearity information. The stiffness function and damping function are obtained to characterize the nonlinear element. The nonlinear elements are identified by combining the stiffness and damping function with the HBM using a first-order expansion. In this procedure, it allows a accurate identification of non-linearity using stiffness function and damping function. This method has been successfully applied to identify nonlinear elements later.

|
Fig.3 Flowchart of nonlinear parameter identification by response control vibration test |
2 Experimental Example 2.1 Experimental Setup
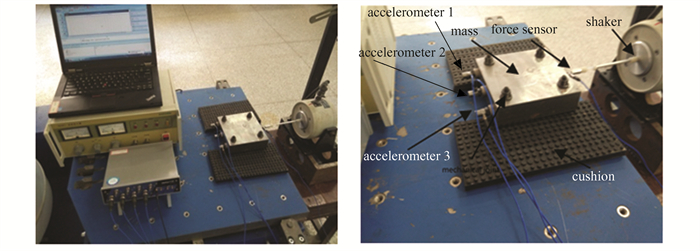
Structural joints are widely used in mechanical systems. Previous experiments have already shown that, due to the discontinuity of materials, frictional contact, mechanical micro-slippage or slapping along the contact interface, structural joints have become the main sources of structural non-linearity. The investigation with mechanical joint system is used in experimental setup. It produces non-linearity that can be varied by adjustment of pretension of mechanical joint. Note that the non-linearity is easy to be induced for low pretension level[24-26]. The torque wrench can easily regulate the pretension levels. Fig. 4 shows the real experiment rig for setup. A mass is resting on softening cushion, and four bolted joints are applied for connection. The mass is attached via a mechanical joint, which introduces nonlinearity into system. All the measurements and excitations are measured by m+p data pickup. The mass is excited by a shaker in horizontal direction through the stinger. Three accelerometers are placed on one side of the mass. The shaker's driving force is measured by one force sensor. And the nonlinear behavior of experimental setup is unknown. It presents non-linearity identification of experimental setup subsequently. Loosened connection is selected for subsequent constant response vibration test. It is used to validate the non-linear identification procedure.
|
Fig.4 Experimental setup representing configuration for vibration test |
2.2 Normal Vibration Test
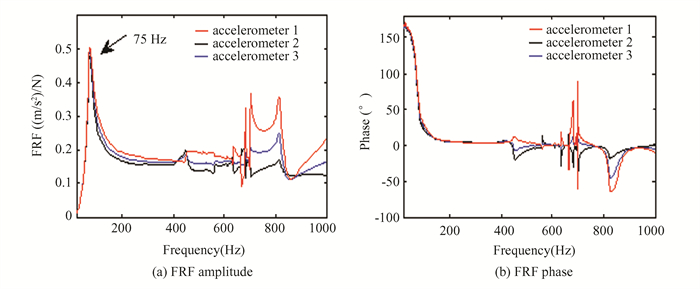
Before conducting the constant response vibration test, some normal vibration tests are conducted to detect the vibration and nonlinear properties of mechanical joint system. First, a hammer test is conducted to estimate the resonance frequency. The mass is excited by a hammer to judge the domaint resonance frequency. The input excitation and output response signals are measured in the horizontal direction. The sampling frequency is set to 2048 Hz with a frequency resolution of 0.125 Hz. The output responses of three accelerometers are shown in Fig. 5. It is shown that the first resonance frequency is around 75 Hz. The first mode is well separated from other modes. It can be considered as an isolated mode. The three accelerometers have nearly the same outputs for the first dominant resonance. It proves that the first mode shape is the dominant rigid motion in the horizontal direction.
|
Fig.5 FRFs are obtained from three accelerometers on the mass |
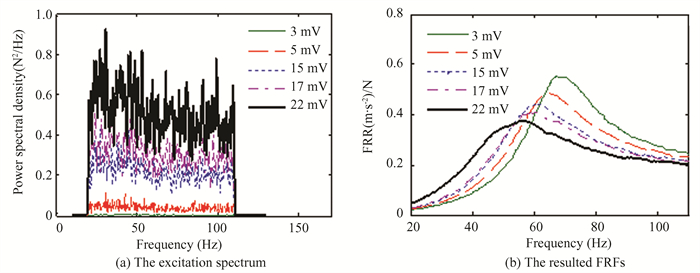
Secondly, a random vibration test is conducted to observe the structural non-linearity. The mass is excited by the shaker with random vibration. A broad band random white noise is applied within the range of 20-110 Hz. The input excitation voltage and its spectrum range are shown in Fig. 6 (a). The FRFs under different input voltage levels around the resonance frequency are shown in Fig. 6 (b). It shows that the FRFs are distorted and do not overlay each other. The existence of non-linearity can be observed. Both resonance frequency and peak amplitude decreases as excitation level increases. The frequency shift indicates the softening stiffness effect. The decrease in peak amplitude indicates a hardening damping effect, which will be discussed later.
|
Fig.6 Set of FRFs for different input voltage levels using random excitation |
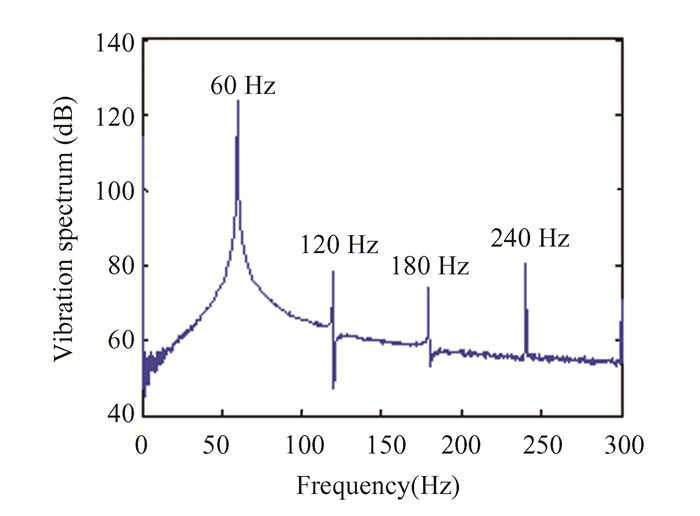
At last, a vibration test with a single frequency is conducted to verify whether the primary harmonic response is dominant. The mass is excited by an excitation with a frequency of 60 Hz and a force amplitude of 7 N. The mass's acceleration response is shown in Fig 7. It shows that the sub- or super-harmonics can also be seen under excitation. And the primary harmonic response is absolutely dominant in comparison with sub- or super-harmonics. The steady-state response can be regarded as containing only the primary harmonic component at the same frequency as the input force.
|
Fig.7 Frequency domain responses of the acceleration (7 N, 60 Hz) |
2.3 Constant Response Vibration Test
The response control vibration test is conducted for non-linearity identification. The most important mode is rigid motion in the horizontal direction. It reveals the nonlinear stiffness and damping of mechanical joints directly. Response control vibration is conducted by adjusting the shaker's output excitation. The shaker can easily regulate the excitation levels and frequency range as needed. The three accelerometers have the same outputs at the first resonance frequency. The middle accelerometer placed on mass is selected as the response control point. The force sensor connected to the force bar is used to pick up the excitation signals. The output response is maintained as constant by the feedback control system. The closed feedback loop control is achieved using the m+p VibControl. The vibration data is analyzed by the m+p Data Pickup. The response control vibration test results in FRFs for modal information extraction. Different displacement and velocity response levels are selected for vibration response control.
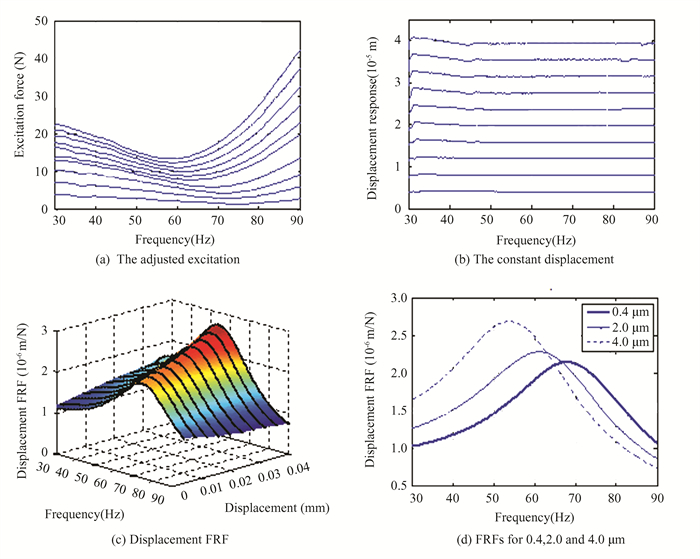
Constant displacement vibration test is conducted for equivalent stiffness identification and stiffness function fitting. Ten nearly constant output displacement levels, ranging from4 μm to 40 μm, are chosen, and the experimental result confirms displacement control of mass is successfully achieved by closed-loop control. Fig. 8(a) describes the adjusted excitation levels around resonance to maintain a constant displacement response. Fig. 8(b) shows nearly constant displacement of mass in the horizontal direction. Fig. 8(c) shows FRFs ranging from 30 to 90 Hz in displacement response control vibration test. Fig. 8(d) shows FRFs of response control vibration test for 0.4 μm, 2.0 μm and 4.0 μm, respectively.
|
Fig.8 Results of constant displacement response vibration test |
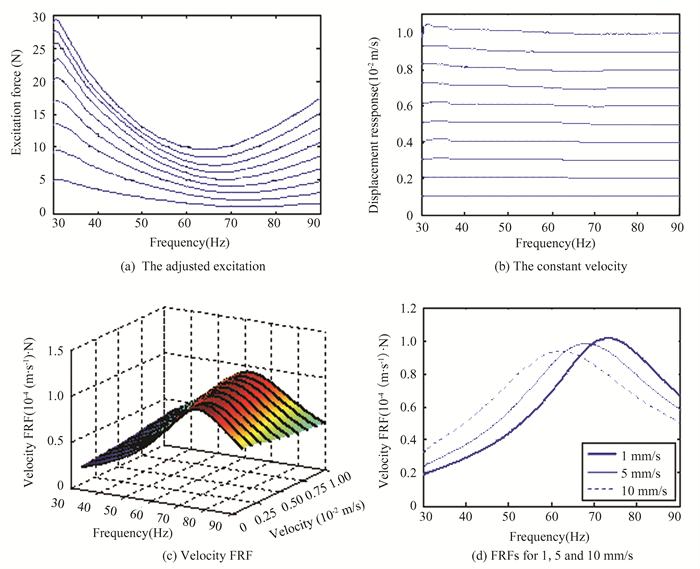
Constant velocity vibration test is similar to constant displacement vibration test. Constant velocity vibration test is conducted for equivalent damping coefficient identification and damping function fitting. Ten sets of constant velocity tests are performed for the nonlinear modelling, and the velocity amplitude level ranges from 1 mm/s to 10 mm/s. Fig. 9(a) describes the adjusted excitation levels around resonance to maintain a constant velocity response. Fig. 9(b) shows nearly constant velocity of the mass. Fig. 9(c) shows the FRFs for sets of velocity control vibration test. Fig. 9(d) shows FRFs of response control vibration test for 1 mm/s, 5 mm/s and 10 mm/s, respectively.
|
Fig.9 Results of constant velocity response vibration test |
3 Modeling and Validation 3.1 Stiffness and Damping Function
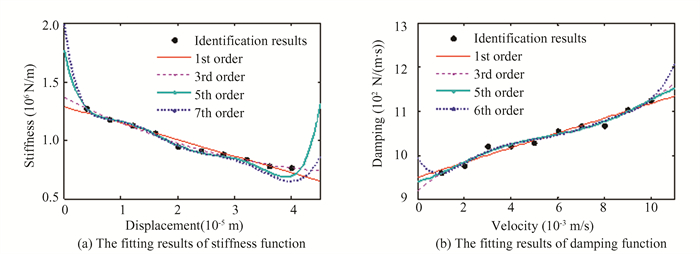
The mass's displacement and velocity are controlled. The equivalent stiffness are related to displacement, while the equivalent damping is related to velocity. Equivalent stiffness decreases by 34.3% with the increase of displacement. Equivalent damping coefficient increases by 16.6% with the increase of velocity amplitude. It confirms the nonlinearities of softening stiffness and hardening damping. The non-linearity of experimental setup is not pre-known. Its variation reveals the nonlinear property. The equivalent stiffness is shown in Fig. 10(a), as displacement ranges from 4 μm to 40 μm. The equivalent damping is shown in Fig. 10(b), as velocity ranges from 1 mm/s to 10 mm/s.
|
Fig.10 Fitting function obtained by vibration test |
Series of equivalent stiffness and damping are fitted in ordinary polynomials. Combination of several basis functions (X, X2, V, V2, V3) is sufficient to approximate k(X) and c(V) as:
| $ k(X)=1.366 \;\mathrm{e}^6-2.817\; \mathrm{e}^{10} X+2.93 \;\mathrm{e}^{14} X^2 $ | (20) |
| $ c(V)=919.8+5.121 \;\mathrm{e}^4 V-7.717 \;\mathrm{e}^6 V^2+5.172 \;\mathrm{e}^8 V^3 $ | (21) |
Groups of various polynomial terms are selected as the basis functions for fitting shown in Fig. 8. It shows additional polynomial terms makes the numerical model more complex, which can not improve the goodness of fitting well.
3.2 Nonlinear Stiffness and Damping ForceThe stiffness and damping function, dependent on the response amplitude, have been fitted. The physical parameter considering motion friction or connection stiffness is not established. Nonlinear spring and damping force with higher orders polynomial is effective. Substituting Eq. (18) and Eq. (19) into Eq. (1), it yields Eq. (22).
| $ \begin{aligned} & m x+\left(919.8+5.121\; \mathrm{e}^4 V-7.717\; \mathrm{e}^6 V^2+\right. \\ & \left.5.172\; \mathrm{e}^8 V^3\right) x+\left(1.366 \;\mathrm{e}^6-2.817 \;\mathrm{e}^{10} X+\right. \left.2.93\; \mathrm{e}^{14} X^2\right) x=f(t) \end{aligned} $ | (22) |
Note that it is difficult to solve Eq. (21) using numerical methods. Numerical model is proposed to describe the nonlinear stiffness and damping force, as shown in Eq. (23).
| $ m \ddot{x}+n_k(x)+n_c(\dot{x})=f(t) $ | (23) |
The stiffness and damping forces are analyzed using the harmonic balance method and the fitted stiffness/damping functions. The nonlinear spring and damping forces are determined according to Eqs.(13) and (14), as shown in Eqs.(24) and (25).
The function of the spring force (x, x|x|, x3) presented as follows:
| $ \begin{aligned} n_k(x)= & 1.366\; \mathrm{e}^6 x-3.319 \;\mathrm{e}^{10} x|x|+ \\ & 3.907\; \mathrm{e}^{14} x^3 \end{aligned} $ | (24) |
The function of the damping force (
| $ n_c(\dot{x})=919.8\; \dot{x}+6.033\; \mathrm{e}^4 \dot{x}|\dot{x}|-10.289\; \mathrm{e}^6 \dot{x}^3+\\7.616\; \mathrm{e}^8\; \dot{x}^3|\dot{x}| $ | (25) |
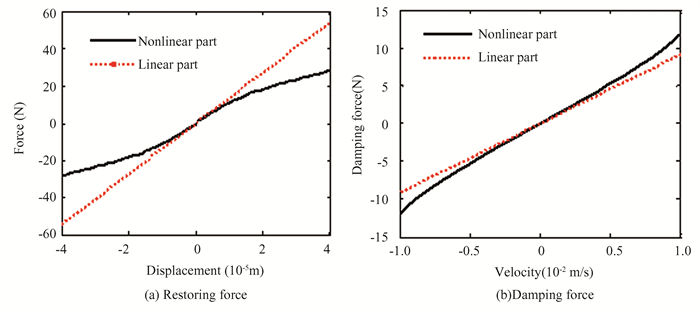
Fig. 11 shows both linear and nonlinear components. It is related to the restoring force-displacement relationship in Fig. 11(a) and the damping force-velocity relationship in Fig. 11(b). The nonlinear force reveals a typical softening stiffness. And the damping force increases with the velocity, which means a hardening nonlinear damping property. The estimated coefficient only describe the non-linearity within specific response range. The disadvantage is that the function has no physical meaning. The function is used to approximate restoring/damping forces within a certain response range. For mechanical joints, both the spring and damping forces are approximated using this method.
|
Fig.11 Linear and nonlinear part of restoring and damping force |
3.3 Modelling Validation
The identified results are employed to validate the identification procedure. Eq. (23) is used to predict nonlinear vibration response of experimental setup. The measured response and the predicted acceleration response are shown in Fig. 12. The predicted and experimental responses show good agreement. It shows the nonlinear theoretical model can identify the system with high accuracy. The evolution of natural frequency and response peak reveals the nonlinear type. It indicates the softening stiffness and hardening damping nolinearity. The drawback is that the identified results are effective within a limited response range. The prediction of a broader range of excitation levels is not so well when using the identified nonlinear spring and damping forces. The nonlinearity of experimental setup is not a particular function with certain characteristic. It needs a new fitting procedure to fit the stiffness and damping functions for broader range of vibration response prediction.

|
Fig.12 Measured and predicted responses for the loosened pretension level |
4 Conclusions
The procedure has proven capable of nonlinear identification by response control vibration test. The output vibration response is maintained as constant by adjusting the input excitation level. It is based that, at given response amplitude (displacement/velocity), the stiffness or damping can be considered as constant. And the equivalent stiffness and damping can be extracted from the measured FRFs using conventional linear analysis tools. The equivalent stiffness and damping are fitted as function of response amplitude. Stiffness function is dependent upon displacement and damping function is dependent upon velocity. The parameters or mathematical model with the unknown elements can be identified by combining the HBM with fitting function. Then the experiment is conducted. It represents the nonlinear force of experimental setup using suitable basis functions. The agreement between the predicted and measured results is satisfactory. It is linear with a very small forcing level and becomes nonlinear with increased excitation. So accurate identification of nonlinearity of mechanical joints can be achieved within a certain, limited frequency and amplitude range.
| [1] |
Noel J P, Kerschen G. Nonlinear system identification in structural dynamics: 10 more years of progress. Mechanical Systems & Signal Processing, 2017, 83: 2-35. DOI:10.1016/j.ymssp.2016.07.020 (  0) 0) |
| [2] |
Fu H, Zhang W, Liu J, et al. Design and verification of high attenuation vibration isolation damper in remote sensing satellite transport. Journal of Harbin Institute of Technology (New Series), 2021, 28(6): 63-71. DOI:10.11916/j.issn.1005-9113.20038 (  0) 0) |
| [3] |
Hernández S, Menga E, Naveira P, et al. Dynamic analysis of assembled aircraft structures considering interfaces with nonlinear behavior. Aerospace Science and Technology, 2018, 77: 265-272. DOI:10.1016/j.ast.2018.03.004 (  0) 0) |
| [4] |
Koyuncu A, Cigeroglu E, Özgüven H N, et al. Localization and identification of structural nonlinearities using cascaded optimization and neural networks. Mechanical Systems and Signal Processing, 2017, 95: 219-238. DOI:10.1016/j.ymssp.2017.03.030 (  0) 0) |
| [5] |
Kong X, Xiong H, Liu Y, et al. Dynamics analysis of nonlinear energy sink for metal-rubber vibration absorber. Journal of Harbin Institute of Technology (New Series), 2017, 24(5): 39-45. DOI:10.11916/j.issn.1005-9113.15371 (  0) 0) |
| [6] |
Arslan O, Aykan M, Oezgueven H N. Parametric identification of structural nonlinearities from measured frequency response data. Mechanical Systems and Signal Processing, 2011, 25(4): 1112-1125. DOI:10.1016/j.ymssp.2010.10.010 (  0) 0) |
| [7] |
Liu X, Sun B, Li L, et al. Nonlinear identification and characterization of structural joints based on vibration transmissibility. Journal of Southeast University (English Edition), 2018, 34(1): 36-42. DOI:10.3969/j.issn.1003-7985.2018.01.006 (  0) 0) |
| [8] |
Özge Arslan, Aykan M, Özgüven H N. Parametric identification of structural nonlinearities from measured frequency response data. Mechanical Systems and Signal Processing, 2011, 25(4): 1112-1125. DOI:10.1016/j.ymssp.2010.10.010 (  0) 0) |
| [9] |
Goege D. Fast identification and characterization of nonlinearities in experimental modal analysis of large aircraft. Journal of Aircraft, 2015, 44(2): 399-409. DOI:10.2514/1.20847 (  0) 0) |
| [10] |
Carrella A, Ewins D J. Identifying and quantifying structural nonlinearities in engineering applications from measured frequency response functions. Mechanical Systems and Signal Processing, 2011, 25(3): 1011-1027. DOI:10.1016/j.ymssp.2010.09.011 (  0) 0) |
| [11] |
Feldman M. Mapping nonlinear forces with congruent vibration functions. Mechanical Systems and Signal Processing, 2013, 37(1-2): 315-337. DOI:10.1016/j.ymssp.2013.01.002 (  0) 0) |
| [12] |
Yuan T, Yang J, Chen L. Restoring force surface method and Hilbert transform one for nonlinear system identification. Journal of Vibration and Shock, 2019, 38(1): 73-78. DOI:10.13465/j.cnki.jvs.2019.01.011 (  0) 0) |
| [13] |
Sadati S M S, Nobari A S, Naraghi T. Identification of a nonlinear joint in an elastic structure using optimum equivalent linear frequency response function. Acta Mechanica, 2012, 223(7): 1507-1516. DOI:10.1007/s00707-012-0656-6 (  0) 0) |
| [14] |
Liu X, Wang L X, Chen Q D, et al. Nonlinear modeling and identification of structural joint by response control vibration test. Transactions of Nanjing University of Aeronautics and Astronautics, 2019, 36(6): 964-976. DOI:10.16356/j.100-1120.2019.06.009 (  0) 0) |
| [15] |
Liu X, Sun B, Xue F. Identification of nonlinear parameter of mechanical joint system based on vibration tests. Journal of Vibration Engineering and Technologies, 2016, 4(5): 475-482. (  0) 0) |
| [16] |
Wang X, Zheng G T. Equivalent dynamic stiffness mapping technique for identifying nonlinear structural elements from frequency response functions. Mechanical Systems and Signal Processing, 2016, 68: 394-415. DOI:10.1016/j.ymssp.2015.07.011 (  0) 0) |
| [17] |
Jalali H, Ahmadian H. Characterization of dominant mechanisms in contact interface restoring forces. International Journal of Mechanical Sciences, 2012, 65(1): 75-82. DOI:10.1016/j.ijmecsci.2012.09.005 (  0) 0) |
| [18] |
Londoño J M, Neild S A, Cooper J E. Identification of backbone curves of nonlinear systems from resonance decay responses. Journal of Sound and Vibration, 2015, 348: 224-238. DOI:10.1016/j.jsv.2015.03.015 (  0) 0) |
| [19] |
Arslan O, Aykan M, Oezgueven H N. Parametric identification of structural nonlinearities from measured frequency response data. Mechanical Systems and Signal Processing, 2011, 25(4): 1112-1125. DOI:10.1016/j.ymssp.2010.10.010 (  0) 0) |
| [20] |
Noeel J P, Kerschen G, Foltete E. Grey-box identification of a non-linear solar array structure using cubic splines. International Journal of Non-Linear Mechanics, 2014, 67: 106-119. DOI:10.1016/j.ijnonlinmec.2014.08.012 (  0) 0) |
| [21] |
Shan W D, Zang C P, Zhang G B. Method for identifying the nonlinearity of a helicopter tail drive shaft system based on frequency response functions. Journal of Vibration and Shock, 2020, 39(14): 102-108. DOI:10.13465/j.cnki.jvs.2020.14.015 (  0) 0) |
| [22] |
Zhang G B, Zang C P. A novel method for nonlinear parametric identification based on vibration tests. Journal of Vibration and Shock, 2013, 32(1): 83-88. DOI:10.3969/j.issn.1000-3835.2013.01.018 (  0) 0) |
| [23] |
Wang X, Khodaparast H H, Shaw A D, et al. Localisation of local nonlinearities in structural dynamics using spatially incomplete measured data. Mechanical Systems and Signal Processing, 2018, 99: 364-383. DOI:10.1016/j.ymssp.2017.06.021 (  0) 0) |
| [24] |
Yang X, Nassar S A, Wu Z, et al. Nonlinear behavior of preloaded bolted joints under a cyclic separating load. Journal of Pressure Vessel Technology, 2012, 134(1): 011206. DOI:10.1115/1.4004614 (  0) 0) |
| [25] |
Koroma S G, Hussein M F M, Owen J S. Influence of preload and nonlinearity of railpads on vibration of railway tracks under stationary and moving harmonic loads. Journal of Low Frequency Noise Vibration and Active Control, 2015, 34(3): 289-306. DOI:10.1260/0263-0923.34.3.289 (  0) 0) |
| [26] |
Kong L G, Jiang H L, Ghasemi A H, et al. Condensation modeling of the bolted joint structure with the effect of nonlinear dynamics. Journal of Sound and Vibration, 2019, 442: 657-676. DOI:10.1016/j.jsv.2018.10.053 (  0) 0) |
 2024, Vol. 31


