Abstract
The analytic continuation serves as a crucial bridge between quantum Monte Carlo calculations in imaginary-time formalism, specifically the Green's functions, and physical measurements (the spectral functions) in real time. Various approaches have been developed to enhance the accuracy of analytic continuation, including the Padé approximation, the maximum entropy method, and stochastic analytic continuation. In this study, we employ different deep learning techniques to investigate the analytic continuation for the quantum impurity model. A significant challenge in this context is that the sharp Abrikosov-Suhl resonance peak may be either underestimated or overestimated. We fit both the imaginary-time Green's function and the spectral function using Chebyshev polynomials in logarithmic coordinates. We utilize Full-Connected Networks (FCN), Convolutional Neural Networks (CNNs), and Residual Networks (ResNet) to address this issue. Our findings indicate that introducing noise during the training phase significantly improves the accuracy of the learning process. The typical absolute error achieved is less than 10-4. These investigations pave the way for machine learning to optimize the analytic continuation problem in many-body systems, thereby reducing the need for prior expertise in physics.
Keywords
0 Introduction
In physics, mathematical functions are frequently employed. However, these functions may exhibit singularities or discontinuities within their domains, rendering conventional methods inadequate for their analysis. To address these challenges, analytic continuation is introduced. Analytic continuation is widely used in computational quantum many-body physics. Real-time response functions, which is related to experimental measurement, are derived from imaginary-time Green's functions obtained through various theoretical or numerical techniques. Beyond serving as a vital link between many-body theory and experimental measurement, analytic continuation presents complexities due to the pathological nature of this mapping. A common difficult is the presence of singularities in the real-time Green's function. This issue is frequently encountered in quantum field theory and condensed matter physics. Although analytic continuation is a powerful and useful tool in quantum mechanics, it can also lead to pathological problems in certain cases[1-4].
Quantum impurity solvers are extensively utilized in dynamical mean field theory. A crucial focus of research in this field is to develop universal, faster, and more accurate quantum impurity solvers. In recent decades, significant advancements in machine learning techniques have dramatically increased the processing speed of impurity solvers by several orders of magnitude[5]. However, compared with conventional methods, such as quantum Monte Carlo simulations and numerical renormalization group calculations, the comprehensiveness of machine learning models for impurity solvers remains a subject of ongoing investigation.
Several approaches, including the maximum entropy method and the Padé approximation, have been proposed to optimize the inverse problem and analytic continuation[6-12]. The Padé approximation, commonly referred to as a fitting method, is actually an interpolation method for the given data. It should be mentioned that noise or random uncertainty on the imaginary axis can significantly affect the accuracy of interpolation. The objective of the maximum entropy method[13-14] is to determine the maximum value of the generalized entropy function.The maximum entropy method tends to favor smooth, Gaussian-like spectral distributions, which may lead to significant inaccuracies in resolving sharp peaks or edges in the spectral function. In practice, the sharp Abrikosov-Suhl resonance peak is often underestimated or even entirely smeared out.Stochastic techniques[15] were also put forth to retrieve the unique features of the peak and edge sections to solve this issue. However, it should be noted that utilizing the randomized method can be time-consuming. Each of these approaches is grounded in the specific physical principles or understanding of the problem, and they are developed based on its own set of presumptions and parameters for fitting.
With the fast advancement of computer technology and the currently ongoing advancement of research, deep learning[16-19] has provided solutions to several issues[20-21] that were once considered challenging. Among them, deep learning has been highly effective in the fields of speech recognition, text classification, target detection and computer vision[22-24], significant contributing to the rapid growth of artificial intelligence. Deep learning has also demonstrated significant potential for advancement in the field of physics, i.e., distilling physical concepts[25], solving the Schrödinger equation[26-30], the quantum many-body problem[31-33], and it also helps to recognize distinct phases in topological and heat phase transformations[34]. Meanwhile, machine learning plays a crucial role across various fields, including statistical physics, materials science, quantum information, and the study of quantum many-body problems[35-41].
In 2016, Stoudenmire et al.[42] put forward a novel method on the basis of Artificial Neural Networks (ANN) to tackle challenges in quantum many-body systems, as well as aspects of analytic continuation. Their work introduced a novel methodology for managing complex quantum systems by applying machine learning algorithms, potentially leading to significant advancements in the domains of computer science and quantum physics[43]. Recently, there has been a growing focus on utilizing machine learning techniques to optimize analytic continuation problems, which has attracted significant attention in the research community. This surge in interest has led to an increasing number of researchers engaging in related studies[44-47].For instance, solving the ambiguous definition of the analytic continuation problem and the absence of currently available analytic transformations, Fournier et al.[48] proposed a comprehensive framework for constructing ANNs that effectively addressed the challenges by using a supervised learning approach, which could achieve a level of precision that is comparable to that of the maximum entropy method. Adding the appropriate amount of noise to the training data can significantly enhance the robustness of machine learning, as found by Yao et al.[49].
In this study, we utilize the Density of States (DOS) for the single impurity Anderson model to generate a dataset using the numerical renormalization group method. The capabilities of Fully Connected Layer Neural Network (FCN) , CNN as well as residual network (ResNet) to predict spectral functions in analytic continuation problem are studied and compared separately. The structure of this paper is organized as follows. Section 1 provides a concise overview of the model under investigation, namely the single Anderson impurity model. Additionally, it elaborates on the methodologies employed for the polynomial fitting of both the input data, specifically the DOS, and the output data, the spectral function, as part of the preparatory steps for machine learning applications. Section 2 presents the three neural network frameworks and the hyperparameters utilized in this study. In Section 3, noise parameters are incorporated throughout the training process to increase the model's robustness, which could demonstrate the predictive capabilities of FCN, CNN and ResNet across various datasets, comparing their performance with the maximum entropy method. Finally, a conclusion is given in Section 4.
1 Database Creation
1.1 Problem Description
The relationship between the spectral function and imaginary-time Green's function is shown in Eq. (1) .
(1)
where i is the imaginary unit, ωn= (2n+1) πT is the Matsubara frequency of Fermion, n is an integer, T is the absolute temperature,A (ω) is the spectral function, and ω is the real frequency. We set T=10-4D in NRG calculation, where D is the half effective bandwidth of the host material for the magnetic impurity. We use this temperature to approximate the 0 K temperature limit.
Eq. (1) clearly illustrates that the extraction of the spectral function poses significant challenges. The coefficients exhibit a gradual decline, tending toward zero as the frequency increases. This behavior results in the inverse mapping of Eq. (1) being inherently ill-conditioned.
This paper aims to utilize machine learning approach to establish a mapping between the spectral function and the imaginary-time Green's function. Through the process of training the imaginary-time Green's function to serve as the input and the spectral function as the output, it is possible to establish a one-to-one correspondence between the input and the output. To enhance the effectiveness of machine learning, we partition the input data into two groups for training: the real part and the imaginary part associated with the complex Green's function. Two sets of data are input separately, and the final result is produced after the flattening operation.
1.2 Data Generation
In this study, the data for machine learning is obtained from the solution to the Anderson impurity model. The DOSs are designed for the single impurity Anderson model (details are given in the following context) , while the spectral function is obtained using the Numerical Renormalization Group (NRG) method[50].
The single impurity Anderson model is given as follows[51]:
(2)
where Hof is the unperturbed Hamiltonian of the host material (the metal) , Hod is the Hamiltonian of the unperturbed d-states of the impurity atoms, Hcoor is the correlation term, and Hεd describes the hybridization between the free electron states in the host material and the localized states on the impurity site, they can be expressed by the following equations:
(3)
(4)
(5)
(6)
where εkσ is the dispersion of host material, c+kσ and ckσ are the electron creation and annihilation operators, respectively. d+σ and dσ represent the creation and annihilation operators for d-electrons with σ spin, σ=↑, ↓, while εdσ represents the energy associated with the d-state when it is singly occupied. U is the correlation energy of the d-electrons, ndσ=d+σdσ is the particle number operator of spin state, represents the spin state opposite to σ, Vkσ and V*kσ are called the mixing energies and can be described as follows:
(7)
where χ denotes the total energy possessed by the individual electrons, a (r-RL) represents the Warnier function associated with the electrons within the specified band of energy in the metal, φL (r) represents the impurity state. The total Hamiltonian can be written as follows:
(8)
To simplify calculations using the NRG method, the Hamiltonian is usually expressed as:
(9)
(10)
(11)
In the context of one-dimensional quantum mechanics, the operators c+nσ and cnσ (n≥0) represent the processes of creation and annihilation, respectively. Meanwhile, the coefficients εn and tn represent the on-site energies and hopping terms within the aforementioned chain. Following appropriate discretization, these coefficients may be derived from the hybridization function Vk and the DOS.
In this paper, we employ the program NRG Ljubljana to perform the NRG calculation. We utilize the discretization scheme suggested by Žitko et al.[52], which is built on the Campo-Oliveira discretization method and demonstrates significant improvements in reducing numerical errors in spectral function calculations. A weight function is introduced to characterize each state across various discretization intervals. The Žitko's discretization method minimizes errors and enhances the accuracy of results. This method also decreases computational effort and enhances computational efficiency.
Without loss of generality, we assume that the hybrid function is short distanced, where V and Vk are equal. Concurrently, the parameters in our numerical calculations are set as follows: U=0.2D, εd=-0.1D. To facilitate and expedite the computation, we use the half width of the electron energy band D=1 as the unit of energy. The NRG discretization parameter, denoted by Λ, has been set to 2. The parity oscillations are smoothed by using four discrete grids with z values of 0.25, 0.5, 0.75, and 1. Evey iteration of the NRG computation retains 2000 values.
Here, we provide a detailed description of the data set generated by NRG calculations. The impurity energy εd is distributed at random in the [-D/2, 0] region, and the Coulomb interaction U=-2εd is distributed in the [0, D] region. Hybridization intensity Γ=πV2/ (2D) in NRG calculation is randomly distributed between [0, D/10]. The interval ω has been set to [-2D, 2D], which matches to 7 grids and could be written as ωj= (j-4) D/3, (j=1, 2, ···, 7) . For each lattice point, we generate random data that range from 0 to 1. The data is transformed into continuous smooth curves using the cubic spline interpolation technique. In this method, low-order polynomials are employed to approximate the data within the intercell, ensuring the smoothness of the entire curve, which is guaranteed by the connection requirements of these polynomials. The continuous curve generates a function f (ω) . We normalize it in the interval [-D, D] to get the DOS,
(12)
Subsequently, 2918 grid points are constructed for computations at zero temperature, ω±j-±2Λ-j, (j=0, 1, ···, 1459) . These points are utilized to generate the DOSs and perform NRG calculations. Additionally, we calibrate the DOS used in the NRG calculations by employing logarithmically spaced coordinates. The NRG calculation produces 2918 logarithmic coordinate spectral function points.
Fig.1 (a) presents a representative DOS plot, while Fig.1 (b) illustrates the corresponding spectral function A (ω) obtained using the NRG Method. The corresponding parameters in Fig.1: εd=-0.20307D, Γ=0.06541. One can clearly see the expanded peaks on both sides near ω=±0.2D. They indicate the existence of impurity levels εd=±0.20307D. The sharp peak in the middle is the Abrikosov-Suhl peak, which is produced at ω=0. The spectral function yielded a total of 2918 data points.

Fig.1Randomly chosen sample DOS and corresponding spectral function
The spectral function data obtained above are substituted into Eq. (1) , and Green's function is derived by integrating over the specified range of [-1, 1]. Where n of ωn takes the values-50, -49, -48, ..., 4849 for a total of 100 values. As T approaches zero, the integral derived from Eq. (1) becomes infinite, indicating that a mutation has occurred near n = 0. To avoid affecting the precision of the integration results, based on Ref. [53] and the NRG method is employed to handle the integral component. We divide the integral into two parts [-1, 0] and [0, 1] and partition the interval into infinitely small segments, ensuring that the superior and inferior limits of the integration approach zero but do not reach to zero.
(13)
After considerable calculation, we find that the integral value is small enough to be negligible when s is greater than 20, so s takes the range of [0, 20] in the calculation. This method enables the attainment of a highly accurate value for the Green's function. In total, we provide400000 data samples for neural network training.
1.3 Data Processing
When the data is complete, both the input and output data are pre-processed to optimize. It is a tedious work to analyze the relationship between the two groups with 2918 data, since the number of data points on the spectral function curve should be minimized while preserving its key characteristics to ensure the smooth execution of subsequent tasks.
After the investigation of some works[54-55], it is common to use polynomials to fit curves in data processing. Specifically, Legendre polynomials and Chebyshev polynomials are the most commonly used fitting methods, therefore, we utilize both types of polynomials for data fitting processing, as shown in Fig.2, where L and C denote the Legendre and Chebyshev polynomials fittings, respectively. Firstly, the accurate function expression of the spectral function is derived using cubic spline interpolation on 2918 data points. The spectral function curve is then fitted by using the Legendre polynomials, resulting in an expression for the fitting curve. Finally, we get some fitting coefficients after considerable trial and error.The result shows that the first 50 fitting coefficients are sufficient to accurately describe the spectral function, so we selected these50 coefficients for our analysis. This operation reduces the spectral function data from the original2918 to 50, significantly decreasing computational complexity and shortening calculation time. Then substitute the second type of Chebyshev polynomial, repeat the aforementioned calculation steps, and include the first 50 terms of the polynomial for fitting. The results are shown in Fig.2 (a) , the fitting effect is suboptimal; the highest peak in the center is not accurately captured, and there is a noticeable oscillation phenomenon. The fitting effects of the two polynomials are similar, however, the Chebyshev polynomial fitting exhibits slightly stronger oscillations at the edges compared with the Legendre polynomial fitting.

Fig.2A randomly chosen spectral function and its polynomial fittings
Gibbs-like oscillations occur near the domain boundaries, making polynomial fitting problematic in these regions.To address these oscillations, we utilize the Jackson kernel function[56] as the damping factor to handle these oscillations, as shown in Eq. (14) :
(14)
in which n=1, 2, 3, ···, N is the order of polynomial, and N denotes total order. The number of polynomial terms influences the accuracy of the fitting process.However, this also increases the computational cost associated with training neural networks. After conducting several tests, it could be found that N=50 for Chebyshev polynomials is a suitable choice.
Fig.2 (b) illustrates the results obtained from the Chebyshev polynomial fitting, which includes the incorporation of the damping factor. The spectral function curves obtained from the two-polynomial fitting, after incorporating a damping factor, closely align with the spectral function calculated using NRG method. This shows that we can accurately fit the spectral function curves using either of the two polynomial approaches.
Finally, the50 fitting points were expanded to 2918 points again and compared the results with the spectrum function curve calculated by NRG to further validate the accuracy of the fitting curve. The formula for restoring data is as follows:
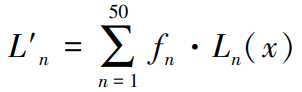
(15)
where fn is the coefficient obtained by polynomial fitting, Ln (x) is the term of the polynomial, and 2918 points between [-1, 1] are taken as the value of x. By substituting Legendre and Chebyshev polynomials, the results obtained are compared with the spectral functions calculated by NRG. In order to ascertain the extent of the discrepancy between the observed and the expected results, the mean square error was utilized as the standard measurement. After extensive calculations, it was established that the error value remained on the order of 10-4. The following work employs the utilization of Chebyshev polynomial fitting with damping factors to facilitate further calculations.
After simplifying the Chebyshev polynomial fitting, a spectral function curve can be accurately represented with 50 points as the output data for machine learning, significantly reducing computational costs. The simplified spectral function data is substituted into the Eq. (13) , yielding the corresponding imaginary-time Green's function value, which serves as the input data for machine learning. Data processing has effectively streamlined the input and output data for machine learning applications. Specifically, while the original input and output datasets each comprised 2918 data points, the simplified versions have been reduced to just 50 data points each.
2 Frameworks
The FCN, CNN, and ResNet are used in this work. The FCN, also known as the dense layer, is characterized by each node being connected to each node in the preceding layer. This connectivity enables the synthesis of features derived from the preceding layers. Because of its fully connected characteristic, the FCN generally has the largest quantity of parameters in comparison with other layers. Neverthelesses, Vaswani et al.[57] indicated a declining trend in the use of FCN. One of the primary reasons is that, in high-dimensional space, employing FCN results in a significant computational burden due to the large number of calculations involved. Moreover, an excessive number of parameters further exacerbates the computational cost. Therefore, this study focuses on one-dimensional space. The calculations involved are relatively straightforward, allowing us to utilize a simple FCN. In such cases, the computational burden and parameter complexity may be minimal, making it a suitable choice.
As designing the FCN network, we try to construct networks with 2, 3, 4, 5, 7, and 12 hidden layers. A reduction of the loss value to 0.0012 can be achieved when the model includes two hidden layers. However, when the model is tested, the loss value is found to be 0.0015. This result indicates that having fewer hidden layers causes the neural networks to extract only superficial features, leading to a poor generalization. Increasing the quantity of hidden layers to three or four results in a similar phenomenon. When the quantity of hidden layers is five, the learning ability of the neural network improves significantly and the loss value for both the train and test sets can be reduced to 0.0008. This result demonstrates that the model is more effective and general for deeper layers. After continuing to increase the amount of layers, the loss value of the fully connected neural network stays at a stable level and does not improve considerably as the number of layers increases, as shown in Fig.3. In Fig.3, black lines are produced by NRG method, red lines are FCN predictions. Since the time and computational cost increase significantly with the increase of the number of layers. After considering various factors, the FCN network with five hidden layers is an appropriate choice.

Fig.3The machine-learning-predicted spectral function for FCN with 5 and 12 hidden layers
Five hidden layers are defined in the full connectivity layer of this study, and each hidden layer is a sequence of linear transformations and nonlinear activation functions. Each layer defines the dimensions of the input features and the output features, as well as whether it incorporates an offset, an activation function, and other pertinent components. Each layer is selected based on the bias, a quantity which represents the systematic error between the model's predicted values and the true values. Optimizing the bias generally enhances performance relative to the proposed deviation, thereby improving the model's fitting accuracy and generalization capabilities. The first 4 layers use ReLU (Rectified Linear Unit) as the activation function, which is simple to calculate and helps to alleviate the gradient disappearance problem in training and promote the sparsity and fast convergence of the model. The last layer activates the function with Sigmoid. Finally, a linear layer is defined to integrate the acquired features and pass them to the output layer, as shown in Fig.4. The model of Fig.4 consists of 5 hidden layers and 1 linear layer. Input feature sizes and output feature sizes of the five hidden layers are (100, 90) , (90, 80) , (80, 70) , (70, 60) , and (60, 50) , respectively. The ReLU and Sigmoid activation functions are used in the first four hidden layers and the last layer, respectively.

Fig.4Illustration of FCN
The capability of CNN in image manipulation significantly surpasses the performance of algorithms designed by human based on “domain knowledge”. CNN finds extensive application in autoencoders and high-dimensional noise filters for sound or video data because of its outstanding performance in capturing features in tensor space.Fig.5 shows the structure of our CNN, which composed of 4 convolutional layers, 2 maximum pooling layers, as well as 1 fully connected layer. The convolution kernel's dimensions of Fig.5 are 1×13, the step size is 2, and the different colors denote different layer structures.

Fig.5Structure diagram of CNN
Theoretically, the addition of new layers to the network has the potential to improve the fit of model to the training dataset, thereby facilitating a reduction in the training error. However, in practice, it has been observed that adding too many layers can actually result in an increase in training error. To address this problem, ResNet is proposed. The core idea of a ResNet is to build a deeper network by introducing skip connections, also known as residual connections, which allow the network to skip one to multiple layers of connections between layers. This design can help solve problems such as gradient vanishing and gradient blowing up in deep neural networks, making it easier to train deeper networks.
A visual representation of the ResNet's architectural layout provides insight into its internal structure, as illustrated in Fig.6, where the convolutional layer uses a convolutional kernel size of 1×7 and the stride size is 1. This includes three convolution layers, two maximum pooling layers, and two fully connected layers. Each convolution module consists of a one-dimensional convolution layer, Batch Normalization (BN) , and ReLU activation functions. The output of the first layer convolutional module is retained for subsequent use in the remaining connections. The pooling layer is inserted into the subsequent second and third convolution modules. Next, the previously retained values are added to the output values obtained from the last pooled layer to achieve residual concatenation. Finally, the connection to the output layer is made through two fully connected layers and the drop layer.

Fig.6Schematic structure of ResNet
Input data is split into two channels, the real and imaginary parts of Green's function, and the output is the spectral function. Adam optimizer is widely chosen because it has many advantages. Adam optimizer combines the characteristics with momentum optimization and adaptive learning rate, which makes it relatively straightforward to adjust the learning rate and obtain good performance when training neural networks. The Adam optimizer typically demonstrates strong convergence and computational efficiency, and its performance remains stable across a variety of problems. In addition, the parameter updates of the Adam optimizer remain unaffected by gradient scaling. This characteristic allows researchers to apply the same hyperparameter settings across various problems and architectures without needing to adjust for the magnitude of the gradient, which also makes the training process of the model simpler and more stable. We choose the Mean Absolute Error (MAE) as the loss function, which is represented by Eq. (16) .
(16)
where yi and f (xi) are the i-th sample's true and expected values, respectively, and m is the sample size. The average absolute error can effectively weaken the effect of outliers overall, and its numerical calculation results show good stability, and can intuitively and clearly represent the difference between the predicted value and the real value. In addition, the mean absolute error has been widely used in many studies and is easy to make a comparation, which makes it easier to assess the training results.
3 Results and Analyses
3.1 Adding Noise to the Training Data
For these neural networks, a cross-validation is adopted by randomly selecting 80% (320000) of the data volume from the database to train the network model and utilize the left 20% (80000) to verify the network model. The training epochs are established at a constant value of 100, taking into account the intricacy of the models, the magnitude of the dataset, and the outcomes of various experimental evaluations. Table 1 presents the structural composition of each neural network along with the number of parameters utilized during training.
In constructing models, we systematically explore a range of hyperparameters and employ relevant evaluation metrics, including the trajectory of the loss function, the lowest achieved loss value, and the outcomes of predictions, to evaluate the efficacy of the model. After a thorough evaluation, the network architecture and hyperparameters presented in Table 1 are optimal for practical applications.
Table1The architectures and hyperparameters of the models

During the training process, it could be observed that the loss value remained significantly high even after numerous iterations, consistently staying within the same order of magnitude throughout the training. Various methods have been employed to address this issue, including increasing the dataset size, adjusting certain parameters, and adding more layers to the network. However, none of these approaches can lead to a significant decrease in the loss value beyond its initial level. Consequently, a solution has been found by examining the input and output data.
Figs.7 (a) and (b) are input Green's functions (the real parts have been multiplied by 1000 for clear representation) . Figs.7 (c) and (d) are machine-learning-predicted spectral functions. Figs.7 (e) and (f) are the details of spectral function data, the horizontal coordinates show the order of data. The inputs of the two sets of data in Figs.7 (a) and (b) are very similar, in contrast to their output data in Figs.7 (c) and (d) which are significantly different. Figs.7 (c) and (e) have distinct peaks on both sides of the resonance peak (ω=0) , while Figs.7 (d) and (f) do not. This means that each of the input data used in this study is very similar while its corresponding output data is different. It is a great challenge to predict different outputs with similar inputs. This may explain the significantly higher loss values observed in the absence of applied noise.

Fig.7Two sets of input and output data
Adding noise to machine learning training can improve the generalization capabilities of neural networks and enhance their robustness against noise. To enhance the network's capacity for generalization and prevent overfitting, Gaussian random noise is introduced to the input data at the beginning of the training process.
(17)
where δ and δ′ are Gaussian distributions with fixed mean μ=0 and standard deviation values σ.
To determine the best standard deviation for Gaussian-type noise, seven values were chosen, which are σ= 0.001, 0.005, 0.010, 0.015, 0.020, 0.025, 0.030, and the average absolute error was used to measure the prediction ability of the FCN, CNN, and ResNet with the addition of different noises. To work effectively, a10000 dataset was selected to perform the training. In Fig.8, the black, blue, and red lines denote the FCN, CNN, and ResNet, respectively, while the solid and dashed lines indicate the outcomes for the training and validation sets, respectively. The horizontal axis of Fig.8 represents the standard deviation σ of the Gaussian-type noise, while the vertical axis indicates the loss value (μ=0) . The first point of each line denotes the MAE value of the neural network without noise correction. From the perspective of the overall change trend of the image, the MAE value of the image is significantly reduced, indicating that the addition of Gaussian random noise in the training process has a good correction effect and greatly reduces the error in machine learning. In this case, we just need to find the σ value at the lowest point of each curve, which is the optimal noise standard deviation value. As shown in Fig.8, the most favorable noise standard deviation of the FCN (black) and CNN (blue) is 0.005, and the best noise standard deviation of the ResNet (red) is 0.010. The optimal noise parameters were added to subsequent neural network training.

Fig.8Loss values obtained by FCN, CNN and ResNet when adding different Gaussian-type noises
3.2 Prediction Results
The computation of the spectral function for the Anderson impurity model using the NRG method requires an average processing time of approximately 2 min. It only takes a few milliseconds for a neural network to predict a spectral function. The computational speed of the neural network is 105-106 times quicker than that of the conventional impurity solver.
Fig.9 shows spectral functions predicted by FCN, CNN and ResNet, respectively. Left column: spectral functions for ω in the interval [-1, 1]. Right column: details of spectral function data, the horizontal coordinates show the order of data. Black lines are NRG results, orange dashed lines are machine-learning predictions, blue dashed lines are machine-learning predictions with noise in network training.
Comparing the blue and orange curves in Fig.9, the introduction of Gaussian random noise enhances the predictive capabilities of all three neural networks to varying extents. This indicates that incorporating random noise during the training process is beneficial. Among the three networks, the FCN provides the most accurate prediction of the spectral function, closely aligning with the results obtained from the NRG. It excels in precisely capturing the peak locations, amplitudes, and widths. The CNN has the best prediction at the peak position (ω=0) . The results of the ResNet also accurately predict the peaks, but there are some errors on both sides of the resonance peaks. The MAE values of FCN, CNN and ResNet neural networks reach 0.0007, 0.0012 and 0.0012, respectively, achieving better results. Fig.10 shows the loss functions of the FCN, CNN, and ResNet evaluated on the training and validation sets.
Then, the consequences of machine learning for predicting spectral functions are compared with the currently more popular maximum entropy methods. Here we use the Python package for parsing Green's functions for many-body systems proposed by Kaufmann et al.[58], which contains both Padé approximation and maximum entropy methods. When performing maximum entropy calculations, we similarly add a Gaussian-type random noise to the input statistics. The mean of the random noise is 0, while its standard deviation is 0.01.
As shown in Fig.11, a comparative analysis of the outcomes generated by the FCN, CNN, and ResNet networks has been carried out to compare with the results obtained from the maximum entropy method. The maximum entropy method captures the location of the resonance peaks accurately. Compared with the outputs of each neural network, the spectral function derived by the maximum entropy method has errors on both sides of the resonance peak. After repeatedly adjusting the parameters and calculating the results, it has been found that the maximum entropy algorithm calculates a set of spectral functions in less than 1 s on an ordinary computer.

Fig.9Spectral functions predicted by FCN, CNN and ResNet
In addition, two independent data sets are prepared to examine the validity of the networks. In the first data set (T1) , the DOS (Density of States) takes the formula ρ (ω) ={-exp[- (ω-ω0) 2/σ2]+b}, in which N is a constant of normalization, ω0 is the mean value, σ is the standard deviation, b is the bias. Dataset of DOS is chosen by setting ω0∈[-1, 1], σ∈[0.5, 6], b∈[1, 2] with even distributions. In another dataset (T2) , the DOS takes the formula ρ (ω) =1/{N[cos (ω+ω0) +b}, in which N is the normalization constant, and ω0 and b take evenly distributed random values in the interval ω0∈[2, 4], b∈[1, 2]. The dataset sizes of both T1 and T2 are both 5 K. To comprehend the networks, and to understand the subtle differences between the models, and also to analyze the data models in sufficient detail, we calculate the MAEs of these models (as shown in Fig.12) . With respect to the original data set, it could be observed that all networks demonstrate a statistical tendency toward an approximately normal distribution when plotted on logarithmic coordinates. Meanwhile, MAE values for FCN can be as low as 0.0007, which is a degree of magnitude inferior than CNN and ResNet. There is a tendency for the range of the MAE distribution on the horizontal coordinate to move sequentially to the right, with the median of lgMAE=-2.782 (MAE=0.0165) for FCN, -2.539 (0.00288) for CNN, and-2.125 (0.00749) for ResNet. For the T1 dataset, the medians of the FCN, CNN and ResNet are lgMAE=-1.823 (MAE=0.015) , lgMAE=-1.815 (MAE=0.0153) and lgMAE=-1.812 (MAE =0.0154) , respectively.The medians for the T2 dataset are lgMAE=-1.764 (MAE=0.0172) , lgMAE=-1.752 (MAE=0.0177) and lgMAE=-1.749 (MAE=0.0178) , respectively, and the range of the main distribution of the MAE also tends to shift to the right.

Fig.10The loss functions of FCN, CNN and ResNet on the training and the validation data sets

Fig.11Spectral functions predicted by neural network models and maximum entropy method (a) spectral functions as functions of ω, (b) details of spectral function data


Fig.12Distributions of MAE value for the three neural network models on three different datasets
The median difference between the three models on the two datasets is small, suggesting that they may have similar predictive and learning capabilities. In addition, the differences in the MAE values obtained from training using the same dataset are not very large in any of the three models, suggesting that the models are all good predictors and none of them suffer from overfitting. Based on these analyses, it can be concluded that the FCN exhibits stronger predictive ability on all datasets, while the ResNet exhibits relatively weak performance on all datasets.
4 Conclusions
This study employs machine learning methods to investigate the relationship between the spectral function and Green's function, aiming to improve the analytic continuation issue in quantum many-body systems. Three different neural networks are used in this problem and comparative analyses are performed. The entire sample size is 400000 and we use cross validation method where80% of the data are used for training and 20% for testing. Three network structures, namely CNN, FCN and ResNet, are employed to predict the spectral function from the Green's function. MAE serves as the evaluation metric, and the newly constructed dataset is utilized to validate the migratory nature of our training model. Our conclusions are as follows:
(a) The calculation of spectral functions can be greatly accelerated by machine learning. Our machine learning-based methods are5-6 orders of magnitude faster than conventional impurity solvers.
(b) Adding appropriate noise during the training process can enhance prediction accuracy and improve the model's robustness.
(c) Polynomial fitting can be used to optimize the data during data processing. It simplifies the data, improves efficiency, and reduces computational costs without compromising the accuracy of the data and without losing any essential features. For the oscillation problem caused by high order polynomials, adding a damping factor to the polynomial fitting process is very effective. In this study, the oscillations generated by higher order Chebyshev polynomials in the fitting are well resolved using the Jackson damping factor.
(d) The FCN can achieve a MAE value of 7×10⁻⁴ on the original dataset, with better predictive ability than the other models.
(e) FCN were significantly better than CNN and ResNet, and increasing the number of neural network layers did not enhance prediction, so building networks with greater complexity internal frameworks is not the right way to ameliorate prediction.
Modern machine learning methods have proved their usefulness in solving long-standing analytic continuation physics problems. Its accuracy, speed, and resilience to noise have shown its superiority over conventional methods.