2. 长春工业大学 工程训练中心, 长春 130012
2. Engineering Training Center, Changchun University of Technology, Changchun 130012, China
加工中心功能先进性及其结构复杂性,导致系统故障存在相关性,使系统多模、连锁故障频率有增加趋势. 早在50年代,在核反应堆设计和操作的初始阶段就发现了相关失效现象,1962年Lennox等将其称为交叉揺合故障. 相关失效分析主要包括定性分析和定量计算. 定性分析常用方法是显示模型法,如事件树、故障树、因果表等;定量计算主要指参数模型,如B因子模型、C因子模型、基本参数(BP)模型、a因子模型、多希腊字母(MGL)模型等数,但这些定量模型多以共因失效为主[1]. Pickles[2]借助Domino骨牌将独立的可靠性评价扩展成连续失效过程,借助指定的系数来刻画某一子系统故障对其相邻子系统的影响,但因假定的失效序列比较单一,无法适用于故障的多路径传递方式;Sun 等[3-4]构建了定量化分析关联故障的可靠性模型,并结合故障数据计算子系统的相关系数,但是该相关系数是一个综合指标. 很多学者借助Copula函数来研究故障相关性问题[5-7],文献[8]用Gumbel Copula函数建立数控装备部件故障间函数关系,但无法体现相关关系的作用方向. 还有一些学者应用复杂系统相关理论对连锁关联故障进行研究,主要包含两个方面:一是基于复杂网络理论的“小世界网络”模型[9]、Watts构造模型[10]、Holme等[11]的相隔中心性模型、Motter与 Lai模型[12-13]等进行连锁关联故障机理分析;二是利用Monte Carlo模拟法[14]、递归算法[15]、基于AHP和灰色关联度选择故障序列等进行连锁关联故障路径搜索[16-17]. 加工中心部件相关故障是连锁故障类型,且不存在冗余,因此,不能直接照搬电力系统连锁故障分析及相关度计算方法.
本文将相关故障机理分析与图论相结合,建立系统部件故障传递有向图,使系统部件相关度评估转化为复杂网络节点重要度计算,由邻接矩阵及其转置变换并结合Pagerank算法,实现加工中心系统部件故障相关度求解.
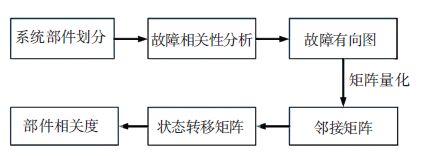
1 系统关联故障建模与评估原理工程实际中,系统部件的故障事件可能从系统中某一故障源开始,继而引发系列元件故障,这种关联故障的迅速传播最终导致系统崩溃. 本文引入图论构建系统部件故障传递有向图模型,将部件节点相关度转化为节点重要度. 应用邻接矩阵量化图中节点关联关系,邻接矩阵归一及转置变换形成系统状态转移矩阵,结合pagerank算法实现故障传递有向图中节点相关度计算.
建模与评估流程如图 1所示.

|
图 1 关联故障建模与评估流程 Figure 1 The tree of relevant failure’s modeling and evaluation |
故障传递有向图是将系统中各元件或子系统简化为图中的节点,单元间的故障传递关系则被简化为节点之间的有向边,依据系统各个元件或单元之间的故障相关关系,构建整个系统的故障有向传递模型. 如果单元i出现故障会引发单元j出现故障,则存在从节点i到节点j的一条有向边.
单纯的故障有向图虽能反映节点间的传递关系,但无法进行量化分析. 为此本文引入邻接矩阵,对于具有n个节点的故障传递有向图,可用邻接矩阵C=[cij]n×n表示.
当ij时,若存在从节点i指向节点j的边,则cij=1;否则cij=0. 当i=j时,cij=0.
1.2 基于pagerank算法的部件相关度评估pagerank算法原理:若部件M故障导致部件N故障,则可认为部件M传递给部件N一个重要度p值,此值的大小取决于部件M的重要度p(M)以及出链数. 设任何部件的重要度都被平均传递到它所链接的部件. 由于部件故障之间存在相互链接关系,这个过程会一直迭代下去,最后部件重要度根据故障部件迭代后p值进行排序.
基于这一思想,将整个系统抽象成一个有向图G=(V,E),其中将n个部件抽象成网络节点,节点集合为V,部件间关系抽象成有向边,有向边集合为E. 若链入部件M的故障节点是部件V1,V2,…,Vk,那么部件M的重要度为
| $p\left( M \right) = \sum\limits_{i = 1}^k {\frac{{p({V_i})}}{{q({V_i})}}} .$ | (1) |
式中p(Vi)和q(Vi)分别为部件Vi的重要度和出度.
设故障传递是一个马尔可夫过程. 对于n个部件和链接关系组成的有向图G(V,E),其邻接矩阵C中元素为1的数量为有向图的链接数. 将矩阵C每行元素除以此行元素的总和(行元素全为0除外)会得到一个归一化矩阵C′,矩阵C′可看作马尔可夫状态转移概率矩阵. 对矩阵C′进行转置得到其转置矩阵[C′]T,若定义一个n维向量P,它的分量分别代表各个节点的重要度值,Px+1表示第(x+1)次迭代所得到的各个节点的重要度所组成的(n×1)阶矩阵.
用概率转移矩阵计算p值:
| ${P^{x + 1}} = \left( {1 - d} \right)/n \cdot E + d \cdot {[{C^\prime }]^T} \cdot {P^x},$ | (2) |
式中:d为阻尼因子,即连锁故障传递概率,E是元素均为1的(n×1)阶矩阵.
展开可得
| $\begin{gathered} {P^{x + 1}} = \left[ \begin{gathered} \left( {1 - d} \right)/n \hfill \\ \left( {1 - d} \right)/n \hfill \\ \ldots \hfill \\ \left( {1 - d} \right)/n \hfill \\ \end{gathered} \right] + \hfill \\ d\left[ {\begin{array}{*{20}{c}} {l({p_1},{p_1})}&{l({p_1},{p_2})}& \ldots &{l({p_1},{p_n})} \\ {l({p_2},{p_1})}&{l({p_2},{p_2})}& \ldots &{l({p_2},{p_n})} \\ \vdots & \vdots &{l({p_i},{p_j})}& \vdots \\ {l({p_n},{p_1})}&{l({p_n},{p_2})}& \ldots &{l({p_n},{p_n})} \end{array}} \right] \hfill \\ \end{gathered} $ |
若存在部件i到部件j的故障链接,那么,$\sum\limits_{i = 1}^n {l({p_i},{\text{ }}{p_j}) = 1} $,否则,l(pi,pj)=0.
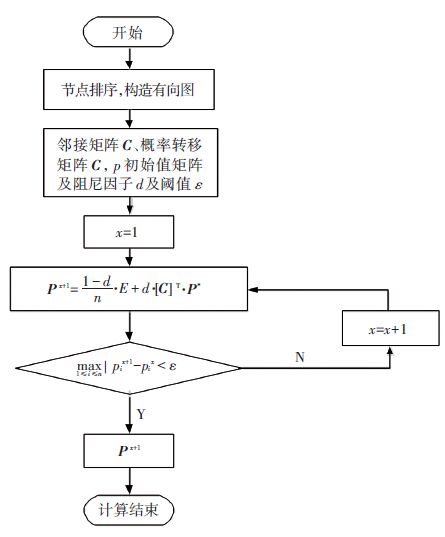
设ε为指定的迭代收敛平稳阈值,取各部件的初始p值P1=p11p21…pn1,迭代计算,当满足max1≤i≤n|pix+1-pix|<ε时,迭代结束,其算法流程实现过程如图 2所示.

|
图 2 Pagerank算法实现流程 Figure 2 Pagerank algorithm’s implement procedure |
系统部件间相关度分为影响度与被影响度.
1) 被影响度计算. 基于pagerank算法来计算系统部件的被影响度是基于以下假设:
假设1 系统部件故障以概率d出现故障传递现象,即沿着故障传递模型进行传递,其中0<d<1;
假设2 当系统以概率(1-d)不沿故障链传递,那么下一个故障将以等可能概率发生于任何一个系统部件,系统部件的CK值将会平均传递到各个系统部件;
假设3 当系统部件Vi能够将故障传递到部件M,部件M会获得故障相关被影响度CK(M),传递值的大小依赖于部件Vi的出度和其本身的CK(Vi)值;
假设4 如果部件容易受到其他CK值较高的系统部件故障的影响,那么此系统部件的CK值也会越高.
根据式(2),系统由n个部件组成,定义一个n维向量,其分量分别是各个部件的CK值,CKx+1表示第(x+1)次迭代所得的各部件的CK值组成的(n×1)矩阵,参考式(2),CK值的迭代计算公式为
| ${C_K}^{(x + 1)} = \left( {1 - d} \right)/n \cdot E + d \cdot {({C^\prime })^T} \cdot {C_K}^{(x)},$ | (3) |
2) 影响度计算. 在故障传递过程中,影响度是指系统部件能够对其他系统部件传递故障的能力,是与系统部件出度正相关的,记为CI,节点出度越大,相应CI值也越大. CI值代表了系统部件对其它部件产生故障影响的概率. 所以通过对邻接矩阵进行转置,借助pagerank算法可以求得系统部件故障相关影响度CI.
根据式(2),系统由n个部件组成,定义一个n维向量,其分量分别是各个部件的CI值,CI(x+1)表示第(x+1)次迭代所得的各部件的CI值组成的(n×1)矩阵,且
| ${C_I}^{(x + 1)} = \left( {1 - d} \right)/n \cdot {\text{E}} + d \cdot {\left[ {{{\left[ {{C^T}} \right]}^\prime }} \right]^T} \cdot {C_I}^{(x)}.$ | (4) |
式中[CT]′是将邻接矩阵C的转置矩阵每行元素除以此行元素的总和(行元素全为0除外)后得到的一个归一化矩阵.
使用幂法来求解CK、CI值,其计算公式为
| $\begin{gathered} {C_K} = \mathop {lim}\limits_{n \to \infty } \left[ {\left( {1 - d} \right)/n \cdot E + d \cdot {{\left[ {C'} \right]}^T}} \right]{C_K}^{(1)}, \hfill \\ {C_I} = \mathop {lim}\limits_{n \to \infty } [\left( {1 - d} \right)/n \cdot E + d \cdot {\left[ {{{\left[ {{C^T}} \right]}^\prime }} \right]^T}]{C_I}^{(1)}. \hfill \\ \end{gathered} $ |
Larry Page和Sergey Brin从理论、算法上保证了节点的估计值能收敛到其真实值,不会改变最终的重要度值排序关系,故一般取CK、CI初值分别为
| $\begin{gathered} {C_K}^{(1)} = \left[ {1,1 \ldots \ldots 1} \right], \hfill \\ {C_I}^{(1)} = \left[ {1,1 \ldots \ldots 1} \right]. \hfill \\ \end{gathered} $ |
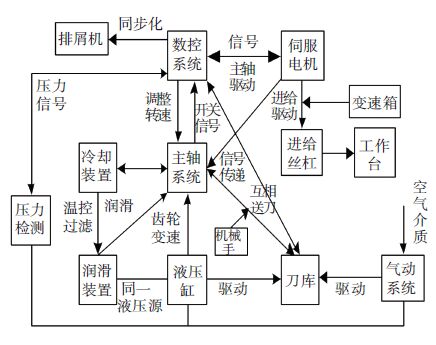
加工中心系统功能关系如图 3所示.

|
图 3 加工中心系统功能关系 Figure 3 System function relation chart of machining center |
加工中心系统及部件划分如表 1所示.
| 表 1 加工中心系统故障部件划分 Table 1 Failure component division of machining center |
通过对某型加工中心现场故障数据分析,获得加工中心部分关联故障,其关联故障分析与统计如表 2、3所示.
| 表 2 加工中心关联故障统计 Table 2 Relevant failure statistical list of machining center |
| 表 3 加工中心关联故障分析 Table 3 Relevant failure parse list of machining center |
根据表 3的加工中心关联故障分析构建故障传递关系模型如图 4所示.

|
图 4 加工中心故障传递有向图模型 Figure 4 Failure transfer’s directed graph model of machining center |
根据图 4中加工中心各子系统部件的代码构建加工中心子系统相关故障的邻接矩阵C、状态转移概率矩阵[C′]T分别为
| $\begin{gathered} C = \left[ {\begin{array}{*{20}{c}} {\text{0}}&{\text{1}}&{\text{1}}&{\text{0}}&{\text{0}}&{\text{0}}&{\text{0}}&{\text{0}}&{\text{0}}&{\text{0}}&{\text{0}}&{\text{0}} \\ {\text{0}}&{\text{0}}&{\text{0}}&{\text{0}}&{\text{0}}&{\text{0}}&{\text{0}}&{\text{0}}&{\text{0}}&{\text{0}}&{\text{0}}&{\text{0}} \\ {\text{0}}&{\text{0}}&{\text{0}}&{\text{0}}&{\text{0}}&{\text{0}}&{\text{0}}&{\text{0}}&{\text{0}}&{\text{0}}&{\text{0}}&{\text{0}} \\ {\text{1}}&{\text{0}}&{\text{1}}&{\text{0}}&{\text{0}}&{\text{0}}&{\text{0}}&{\text{0}}&{\text{0}}&{\text{0}}&{\text{0}}&{\text{0}} \\ {\text{1}}&{\text{1}}&{\text{0}}&{\text{0}}&{\text{0}}&{\text{0}}&{\text{0}}&{\text{0}}&{\text{0}}&{\text{0}}&{\text{0}}&{\text{0}} \\ {\text{1}}&{\text{0}}&{\text{1}}&{\text{1}}&{\text{0}}&{\text{0}}&{\text{0}}&{\text{0}}&{\text{1}}&{\text{0}}&{\text{0}}&{\text{0}} \\ {\text{1}}&{\text{1}}&{\text{0}}&{\text{0}}&{\text{0}}&{\text{0}}&{\text{0}}&{\text{0}}&{\text{0}}&{\text{0}}&{\text{0}}&{\text{0}} \\ {\text{1}}&{\text{1}}&{\text{1}}&{\text{0}}&{\text{0}}&{\text{0}}&{\text{0}}&{\text{0}}&{\text{0}}&{\text{0}}&{\text{0}}&{\text{0}} \\ {\text{0}}&{\text{0}}&{\text{1}}&{\text{0}}&{\text{0}}&{\text{0}}&{\text{0}}&{\text{0}}&{\text{0}}&{\text{0}}&{\text{0}}&{\text{0}} \\ {\text{0}}&{\text{0}}&{\text{1}}&{\text{0}}&{\text{0}}&{\text{0}}&{\text{0}}&{\text{0}}&{\text{0}}&{\text{0}}&{\text{0}}&{\text{0}} \\ {\text{0}}&{\text{0}}&{\text{0}}&{\text{0}}&{\text{0}}&{\text{0}}&{\text{0}}&{\text{0}}&{\text{0}}&{\text{0}}&{\text{0}}&{\text{0}} \\ {\text{0}}&{\text{0}}&{\text{0}}&{\text{0}}&{\text{0}}&{\text{0}}&{\text{0}}&{\text{0}}&{\text{0}}&{\text{0}}&{\text{0}}&{\text{0}} \end{array}} \right] \hfill \\ {\left[ {C\prime } \right]^T} = \left[ {\begin{array}{*{20}{c}} {\text{0}}&{{\text{1/2}}}&{{\text{1/2}}}&{{\text{1/4}}}&{{\text{1/2}}}&{{\text{1/3}}}&{\text{0}}&{\text{0}}&{\text{0}}&{\text{0}}&{\text{0}}&{\text{0}} \\ {{\text{1/2}}}&{\text{0}}&{{\text{1/2}}}&{\text{0}}&{{\text{1/2}}}&{{\text{1/3}}}&{\text{0}}&{\text{0}}&{\text{0}}&{\text{0}}&{\text{0}}&{\text{0}} \\ {{\text{1/2}}}&{{\text{1/2}}}&{\text{0}}&{{\text{1/4}}}&{\text{0}}&{{\text{1/3}}}&{\text{1}}&{\text{1}}&{\text{0}}&{\text{0}}&{\text{0}}&{\text{0}} \\ {\text{0}}&{\text{0}}&{\text{0}}&{{\text{1/4}}}&{\text{0}}&{\text{0}}&{\text{0}}&{\text{0}}&{\text{0}}&{\text{0}}&{\text{0}}&{\text{0}} \\ {\text{0}}&{\text{0}}&{\text{0}}&{\text{0}}&{\text{0}}&{\text{0}}&{\text{0}}&{\text{0}}&{\text{0}}&{\text{0}}&{\text{0}}&{\text{0}} \\ {\text{0}}&{\text{0}}&{\text{0}}&{\text{0}}&{\text{0}}&{\text{0}}&{\text{0}}&{\text{0}}&{\text{0}}&{\text{0}}&{\text{0}}&{\text{0}} \\ {\text{0}}&{\text{0}}&{\text{0}}&{\text{0}}&{\text{0}}&{\text{0}}&{\text{0}}&{\text{0}}&{\text{0}}&{\text{0}}&{\text{0}}&{\text{0}} \\ {\text{0}}&{\text{0}}&{\text{0}}&{\text{0}}&{\text{0}}&{\text{0}}&{\text{0}}&{\text{0}}&{\text{0}}&{\text{0}}&{\text{0}}&{\text{0}} \\ {\text{0}}&{\text{0}}&{\text{0}}&{{\text{1/4}}}&{\text{0}}&{\text{0}}&{\text{0}}&{\text{0}}&{\text{0}}&{\text{0}}&{\text{0}}&{\text{0}} \\ {\text{0}}&{\text{0}}&{\text{0}}&{\text{0}}&{\text{0}}&{\text{0}}&{\text{0}}&{\text{0}}&{\text{0}}&{\text{0}}&{\text{0}}&{\text{0}} \\ {\text{0}}&{\text{0}}&{\text{0}}&{\text{0}}&{\text{0}}&{\text{0}}&{\text{0}}&{\text{0}}&{\text{0}}&{\text{0}}&{\text{0}}&{\text{0}} \\ {\text{0}}&{\text{0}}&{\text{0}}&{\text{0}}&{\text{0}}&{\text{0}}&{\text{0}}&{\text{0}}&{\text{0}}&{\text{0}}&{\text{0}}&{\text{0}} \end{array}} \right] \hfill \\ \end{gathered} $ |
根据式(2),由经验d=0.3进行矩阵迭代,通过Matlab计算,结果如表 4所示.
| 表 4 子系统CK值及排序 Table 4 Subsystem’s CK values and ranking |
由于重要度p值与故障相关影响度CI值的传递机理是相反的,那么需要对邻接矩阵C进行一次转置得到转置邻接矩阵CT,进而得到[[CT]′]T.
| ${[[{C^T}]\prime ]^T} = \left[ {\begin{array}{*{20}{c}} {\text{0}}&{{\text{1/4}}}&{{\text{1/6}}}&{\text{0}}&{\text{0}}&{\text{0}}&{\text{0}}&{\text{0}}&{\text{0}}&{\text{0}}&{\text{0}}&{\text{0}} \\ {\text{0}}&{\text{0}}&{\text{0}}&{\text{0}}&{\text{0}}&{\text{0}}&{\text{0}}&{\text{0}}&{\text{0}}&{\text{0}}&{\text{0}}&{\text{0}} \\ {\text{0}}&{\text{0}}&{\text{0}}&{\text{0}}&{\text{0}}&{\text{0}}&{\text{0}}&{\text{0}}&{\text{0}}&{\text{0}}&{\text{0}}&{\text{0}} \\ {{\text{1/5}}}&{\text{0}}&{{\text{1/6}}}&{\text{0}}&{\text{0}}&{\text{0}}&{\text{0}}&{\text{0}}&{\text{0}}&{\text{0}}&{\text{0}}&{\text{0}} \\ {{\text{1/5}}}&{{\text{1/4}}}&{\text{0}}&{\text{0}}&{\text{0}}&{\text{0}}&{\text{0}}&{\text{0}}&{\text{0}}&{\text{0}}&{\text{0}}&{\text{0}} \\ {{\text{1/5}}}&{\text{0}}&{{\text{1/6}}}&{\text{0}}&{\text{0}}&{\text{0}}&{\text{0}}&{\text{0}}&{\text{0}}&{\text{0}}&{\text{0}}&{\text{0}} \\ {{\text{1/5}}}&{{\text{1/4}}}&{\text{0}}&{\text{0}}&{\text{0}}&{\text{0}}&{\text{0}}&{\text{0}}&{\text{0}}&{\text{0}}&{\text{0}}&{\text{0}} \\ {{\text{1/5}}}&{{\text{1/4}}}&{{\text{1/6}}}&{\text{0}}&{\text{0}}&{\text{0}}&{\text{0}}&{\text{0}}&{\text{0}}&{\text{0}}&{\text{0}}&{\text{0}} \\ {\text{0}}&{\text{0}}&{{\text{1/6}}}&{\text{0}}&{\text{0}}&{\text{0}}&{\text{0}}&{\text{0}}&{\text{0}}&{\text{0}}&{\text{0}}&{\text{0}} \\ {\text{0}}&{\text{0}}&{{\text{1/6}}}&{\text{0}}&{\text{0}}&{\text{0}}&{\text{0}}&{\text{0}}&{\text{0}}&{\text{0}}&{\text{0}}&{\text{0}} \\ {\text{0}}&{\text{0}}&{\text{0}}&{\text{0}}&{\text{0}}&{\text{0}}&{\text{0}}&{\text{0}}&{\text{0}}&{\text{0}}&{\text{0}}&{\text{0}} \\ {\text{0}}&{\text{0}}&{\text{0}}&{\text{0}}&{\text{0}}&{\text{0}}&{\text{0}}&{\text{0}}&{\text{0}}&{\text{0}}&{\text{0}}&{\text{0}} \end{array}} \right]$ |
根据式(4)用Matlab实现得到各子系统的CI值及排序如表 5所示.
由表 4和表 5可知,进给系统、刀库和主轴系统的被影响度比较高,容易受其他子系统故障影响;电气系统、润滑系统、液压系统、气动系统等子系统的影响度比较高,当这些子系统出现故障时容易影响其他子系统,对整个加工中心具有较强的危害性.
| 表 5 子系统CI值及排序 Table 5 Subsystem’s CI values and ranking |
1) 故障相关度的大小与部件间故障关联关系成正比,存在故障相关关系的部件的故障相关度大于不存在故障相关关系的部件的故障相关度;
2) 故障相关度反映部件在故障传递中的位置. 若部件被影响度大,影响度小,说明其是故障表象部件;反之,影响度大而被影响度小的是故障源部件,这有助于故障诊断与维护.
3) 通过对某加工中心相关故障数据分析发现,进给系统、刀库和主轴系统的被影响度比较高,这些子系统属于执行机构,是故障表象子系统;电气系统、润滑系统、液压系统、气动系统等子系统的影响度比较高,它们属于动力或控制系统,属于故障源子系统. 这与故障相关性定性分析结果一致,说明该方法是合理有效的.
4) 基于Pagerank算法的子系统相关度计算,能够定量评价系统部件故障相关度,为后续的系统部件故障率计算、可靠性评价及可靠性分配等研究奠定理论基础.
| [1] |
张静.复杂机械系统可靠性评价及软件开发[D]. 沈阳: 东北大学,2009.
ZHANG Jing. Reliability evaluation and software develop of complex mechanical system[D]. Shenyang: Northeastern University,2009. http://cn.bing.com/academic/profile?id=f6eda19ba215fe61115966293dc7456c&encoded=0&v=paper_preview&mkt=zh-cn |
| [2] | PICKLES J H. A stochastic domino model for a sequential failure process[J]. Reliability engineering, 1986, 16 (3) : 219-236. DOI: 10.1016/0143-8174(86)90042-9 |
| [3] | SUN Y, MA L, MATHEW J, et al. An analytical model for interactive failures[J]. Reliability Engineering & System Safety, 2006, 91 (5) : 495-504. |
| [4] | SUN Y, MA L. Estimate of interactive coefficients[C]//8th International Conference on Reliability, Maintainability and Safety, ICRMS 2009. Piscataway: IEEE Computer Society, 2009: 310-314. |
| [5] | JIA X, CUI L, YAN J. A study on the reliability of consecutive k-out-of-n: G systems based on copula[J]. Communications in Statistics—Theory and Methods, 2010, 39 (13) : 2455-2472. DOI: 10.1080/03610921003778134 |
| [6] | RAM M, SINGH S B. Analysis of reliability characteristics of a complex engineering system under copula[J]. Journal of Reliability and Statistical Studies, 2009, 2 (1) : 91-102. |
| [7] | TANG Jiayin, ZHAO Y, HE P, et al. Copulas new theory for reliability calculation involving correlation in mechanical systems[J]. Mechanical Science and Technology for Aerospace Engineering, 2009, 28 (4) : 532-535. |
| [8] |
张英芝, 郑锐, 申桂香, 等. 基于 Copula 理论的数控装备故障相关性[J].
吉林大学学报(工学版), 2011, 41 (6) : 1636-1640.
ZHANG Yingzhi, ZHENG Rui, SHENG Guixiang, et al. Fault correlation of NC machine tools based on Copula theory[J]. Journal of Jilin University Engineering and Technology Edition, 2011, 41 (6) : 1636-1640. DOI: 10.13229/j.cnki.jdxbgxb2011.06.007 |
| [9] | WATTS D J, STROGATZ S H. Collective dynamics of ‘small-world’networks[J]. nature, 1998, 393 : 440-442. DOI: 10.1038/30918 |
| [10] | WATTS D J. Small worlds: the dynamics of networks between order and randomness[M]. Princeton : Princeton university press, 1999 . |
| [11] | HOLME P, KIM B J, YOON C N, et al. Attack vulnerability of complex networks[J]. Physical Review E, 2002, 65 (1) : 106-109. DOI: 10.1103/PhysRevE.65.056109 |
| [12] | LAI Y C, MOTTER A E, NISHIKAWA T. Attacks and cascades in complex networks[J]. Lecture Notes in Physics, 2004, 650 : 299-310. DOI: 10.1007/978-3-540-44458-5_14 |
| [13] |
曹一家, 陈彦如, 曹丽华, 等. 复杂系统理论在电力系统中的应用研究展望[J].
中国电机工程学报, 2012, 32 (19) : 1-9.
CAO Yijia, CHEN Yanru, CAO Lihua, et al. Propects of studies on application of complex system theory in power systems[J]. Proceedings of the CSEE, 2012, 32 (19) : 1-9. |
| [14] | YU X, SINGH C. Integrated power system vulnerability analysis considering protection failures[J]. IEEE Trans on Power Systems, 2004, 19 (4) : 1811-1820. DOI: 10.1109/PES.2003.1270393 |
| [15] |
邹欣, 程林, 孙元章. 基于线路运行可靠性模型的电力系统连锁故障概率评估[J].
电力系统自动化, 2011, 35 (13) : 7-11.
ZOU Xin, CHENG Lin, SUN Yuanzhang. Probability evaluation of electrical power system cascading failure based on line running reliability model[J]. Automation of Electric Power, 2011, 35 (13) : 7-11. |
| [16] |
张硕, 顾雪平. 电力系统大停电事故仿真的故障序列选择[J].
电力系统自动化, 2009 (14) : 12-16.
ZHANG Shuo, GU Xueping. Option of failure order on simulation of the power black out[J]. Automation of Electric Power, 2009 (14) : 12-16. |
| [17] |
张海翔, 吕飞鹏. 基于连锁故障序列分析的电网脆弱性评估[J].
电力系统保护与控制, 2013, 41 (17) : 32-38.
ZHANG Haixiang, LV Feipeng. Evaluation of power network fragility based on analysis of cascading failure order[J]. Power System Protection and Control, 2013, 41 (17) : 32-38. |
 2017, Vol. 49


