Helium cryogenic systems have been widely used in particle accelerators and nuclear fusion experimental reactors in recent years.The operations of helium refrigerators affect the safety and efficiency of the experimental devices directly. Helium cryogenic plants and their control systems are highly complex due to the large number of correlated variables on wide operation range.Most helium cryogenic systems are designed based on static calculations, and the control of helium refrigerators is based on operators’ experience. However, the helium cryogenic systems for superconductor Tokamaks (EAST, ITER, JT60SA, KSTAR, et al.)are operated under pulsed heat loads.Cryogenic systems are designed not only for the steady-state but also for the dynamic process[1]. And the control requirements of helium refrigerators to cope with periodic load variations of fusion reactors are also highlighted[2-3].Dynamic simulation is necessary for helium cryogenic systems, representing a new way to provide adequate data during transients[4]. Dynamic simulation has been applied to design helium cryogenic plants gradually.
Existing cryogenic process simulators have been carried out starting from a simple Brayton cryocycle[5] to large scale cryogenic systems.Maekawa et al.[6-9]had carried out C-PREST (Cryogenic Process REal-time SimulaTor) as a platform for process analysis and optimization for LHD 10kW@4.5K helium refrigerator.Bradu et al.[4, 10-11]had developed PROCOS (PROcess and COntrol Simulator) to improve knowledge for LHC 18kW@4.5K helium refrigerator.Deschildre et al.had simulated the 800W@4.5K helium refrigerator at CEA[12] and presented a cold bypass valve to mitigate effects on the helium refrigerator under pulsed loads[13-14].The controllers in C-PREST were executed on the real hardware architecture, increasing the equipment cost in the design phase[7]. The controllers in PROCOS were executed in the process model instead of the PLC simulators[4].Other dynamic simulators only simulated cryogenic processes without the control systems. In addition, the applications in controller tuning and operation optimization are not mentioned.They are conducive to shorten the commissioning time and reduce the test risk greatly.
In this paper, a Cryogenic Process and Control Simulator (CryoPCS)for a 500W@4.5K helium refrigerator has been developed. The helium refrigerator is under construction at Institute of Plasma Physics, Chinese Academy of Sciences.Controller parameter tuning using process simulation is demonstrated and applied to the actual refrigerator.The operation of Joule-Thomson (JT)bypass valve is optimized to increase the cool-down rate. And the evaluation of the cool-down process under the control program is presented.
2 Design and Development of CryoPCSMost existing simulators are only cryogenic process simulation without the control system, except the simulators achieved by Maekawa et al.[7]and Bradu et al.[10], mentioned above.The proposed purposes of CryoPCS are summarized as follows: to train operators without affecting safety or additional cost; to investigate dynamic behaviors to optimize the operation; to design control strategies to enhance the stability and test control programs on virtual plants. So, CryoPCS is designed to reproduce the whole cryogenic system, not only the cryogenic process but also the control system including the supervision.
CryoPCS adopts the typical industrial control architecture of three hardware layers, as shown in Fig. 1. The supervision layer remains the actual operator station, realized by WinCC. The control layer is replaced by the PLC simulator, PLCSIM, provided by SIEMENS. The control layer also remains the actual PLC to execute control programs before implementation. The field layer is replaced by the cryogenic process model based on commercial simulation software, Aspen HYSYS©.It is widely applied to large scale helium cryogenic systems by CEA[12-14] and IIT[15-16], and proved to be a reliable dynamic simulation software to model complex helium refrigerators.

|
Figure 1 The control architecture of CryoPCS |
The operations are realized in WinCC, and the controllers are executed in PLC. The process model receives or sends process variables from or to the control system.CryoPCS has the similar simulation architecture with PROCOS and C-PREST. But the simulation software of the process model is different.EcosimPro© was adopted in PROCOS[4] and Visual ModelerTMwas adopted in C-PREST[9].
2.1 Process Description of the 500W@4.5K RefrigeratorThe first application of the CryoPCS is the 500W@4.5 Khelium refrigerator, which is designed to provide 4.5 K supercritical helium to test superconductor coils or as a helium liquefier.The simplified process flow diagram of the helium refrigeratoris presented in Fig. 2.High pressure (HP) helium from the compressor enters the cold box, cooled down in EX1A by nitrogen and low pressure (LP) helium in counter flow. EX1B has passages of nitrogen as well, and HP stream is pre-cooled by liquid nitrogen (LN2) to get the refrigeration capacity larger. In EX2, HP stream is split into two parts: turbine stream and JT stream. The turbine stream gets expanded in turbine T2230. After further cooled down in EX3, it enters turbine T2250 and gets expanded to LP stream.

|
Figure 2 Simplified process flow diagram of 500W@4.5K refrigerator |
In the liquefaction mode, the JT stream passes the last heat exchanger EX5, throttled to low pressure in JT valves CV2270 and CV2272 before the two-phase helium stream leaves the cold box into Dewar. Vaporized helium from Dewar reenters the cold box through CV2190. The returned helium is warmed up in EX5 before it is mixed with the turbine stream. Then the LP stream is warmed in counter flow by the HP stream in heat exchangers and enters the suction of compressor.
2.2 Process Modeling of the 500W@4.5K RefrigeratorOn the way to explore dynamic simulator of the cryogenic refrigerator, different simulation approaches have been completed and validated. Process simulation based on HYSYS expands rapidly. It is a modular sequential process simulator, using the Euler implicit method.It offers an equation oriented method for the calculation of the pressure and flow balances called Pressure-Flow Solver[17]. Each component, such as heat exchange, turbine, valve, pipe and phase separator, can be parameterized with its own characteristics. But some specific customizations are required to cope with helium cryogenic applications, especially the heat exchanger and turbine expander[15].
1)Heat Exchanger.
The thermal conductivity and heat capacity of materials in heat exchangers are highly non-linear. The accuracy of simulation results is depended on the accurate property data. Approach of these properties is not provided directly in HYSYS. Therefore, logarithmic equations are inserted through spreadsheets to calculate the thermal conductivity and heat capacity of materials[15].
| $ \begin{array}{l} \ln y = a + b\left( {\ln T} \right) + c{\left( {\ln T} \right)^2} + d{\left( {\ln T} \right)^3} + \\ \;\;\;\;\;\;\;\;\;e{\left( {\ln T} \right)^4} + f{\left( {\ln T} \right)^5} + g{\left( {\ln T} \right)^6} + h{\left( {\ln T} \right)^7} + \\ \;\;\;\;\;\;\;\;\;i{\left( {\ln T} \right)^8} \end{array} $ | (1) |
where y represents thermal conductivity or heat capacity, and the constant coefficients depend on materials.
In addition, the heat transfer coefficients vary with the temperature, the mass-flow and the fins geometry for each stream.A function is added to the process model in order to make the heat transfer coefficients vary according to correlations as Eq.(2)[18]:
| $ h = j\left( {{\mathop{\rm Re}\nolimits} } \right) \cdot Cp \cdot g/{\Pr ^{2/3}} $ | (2) |
where Re and Pr are the Reynolds and the Prandtl Number. j, representing heat transfer factor, is the function of Re. Cp is specific heat capacity. And g is the mass-flow rate per flow cross-sectional area.j and g depend the fins geometry.
2) Turbine Expander[12].
The turbine expander is defined by its capacity and its efficiency, which are constant values in HYSYS. Therefore, a spreadsheet has been added which includes equations describing these parameters as functions of the input of the turbine expander conditions, in Eqs. (3) and (4).
| $ Capacity = {K_1}\frac{{{P_{{\rm{in}}}}}}{{{\rho _{{\rm{in}}}}\sqrt {{Z_{{\rm{in}}}}{T_{{\rm{in}}}}} }} $ | (3) |
where Pin, Tin, ρinand Zin are respectively the inlet pressure, temperature, density and compressibility factor; K1is the flow coefficient determined by design parameter of mass flow.
| $ Efficiency = {K_2} + {K_3}\left( {\frac{U}{{{C_s}}}} \right) + {K_4}{\left( {\frac{U}{{{C_s}}}} \right)^2} $ | (4) |
where U=π·D·N, D is turbine expander wheel diameter and N is rotational speed; Cs=
In order to reduce computational complexities, certain assumptions have been made: all filters and absorbers have been ignored. The pressure drops between them have been added to pipes placed nearby. The heat load from superconducting magnet is replaced by the heater in Dewar. The simplified process model of cold box in HYSYS is shown in Fig. 3.

|
Figure 3 Process model of the 500W@4.5K refrigerator |
2.3 Communication Between Process Model and Controller
The same PLC inputs/outputs are used in the process model. So the communication between the process model and controller is vital to data interchange[19].HYSYS incorporates an advanced software architecture and OLE(Object Linking and Embedding)technology to provide a component-based framework. Various objects in HYSYS are exposed, offering the ability to programmatically interact with other applications[20].
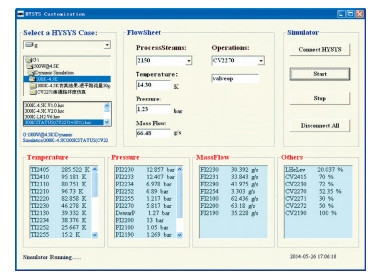
Based on the technology, this paper presents a communication methodology through OPC(OLE for Process Control)protocol. The process model is accessed as an OPC server, and PLC works as an OPC client. Controllers are executed in PLC, and then outputs of controllers are written to the process model. Main process parameters in the model are read back to PLC synchronously to ensure the consistency.The OPC server is programmed by Visual Basic using HYSYS customization, as shown in Fig. 4.Via this program, cryogenic model is used as a calculation engine, hiding the complexity of dynamic simulation by building a front-end in another program.
|
Figure 4 Interface of OPC server |
3 Verification of the Process Model 3.1 Cool-down Process of 300 K-80 K in HX1
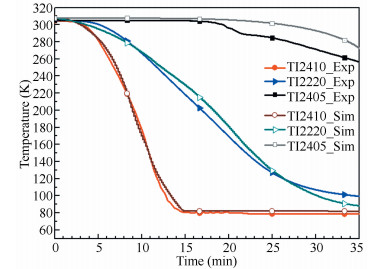
At present, the cold box has been installed except the turbines, and the cool-down process from 300 K-80 K is achieved utilizing LN2. HX1 is the most complex heat exchange, comprised of three streams with two helium streams and one nitrogen stream.In order to verify the accuracy of the process model, the cool-down process of 300 K-80 K in HX1 has been simulated according the actual operations.The cool-down curves of HX1 in simulation are compared with the experiment data in Fig. 5. From Fig. 5, the cool-down rate of TI2410(middle temperature of nitrogen stream) and TI2220(outlet temperature of helium stream)is in good agreement with the actual refrigerator. However, TI2405(outlet temperature of nitrogen stream) is higher than the value in the actual refrigerator. It means that the cooling capacity from vaporized LN2 is not conducted enough compared with simulation results. The maximum errorsof TI2410, TI2220 and TI2405 are about 8 K at 92 K, 10 K at 100 K and 21 K at 270 K respectively.The relative errors of temperatures in HX1 during the process of 300 K-80 K are less than 10%. From the cool-down trend and cool-down rate, this dynamic model can predict the cool down process of the 500 W @ 4.5 K refrigerator very well.In General, this dynamic simulator is suitable to operation guide for helium refrigerator.
|
Figure 5 Cool-down curves of HX1 in simulation compared with experiment |
3.2 T-S Diagram in Simulation
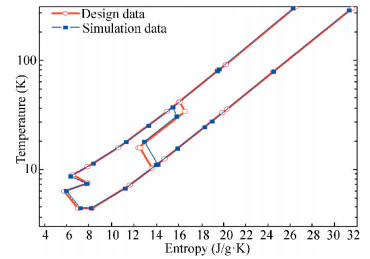
When the cool-down process is completed, the thermodynamic parameters reach to steady-state. The mass flow of helium supplied by compressor is 69.5 g/s@14bar, and the power of compressor is 247 kW.The mass flow of LN2 is 21.7 g/s. The comparison of T-S diagram between dynamic simulation and design parameter is shown in Fig. 6. From T-S diagram, the temperatures estimated in dynamic simulation, is fit well with design values except HX2 and HX3. In simulation, the performance of HX2 is excellent compared with design data. However, the performance of HX3 is lower than design data. This causes the liquefaction rate is slightly smaller than the designed liquefaction rate(120 L/h), about 112 L/h. The deviation is primarily caused by heat exchange models. Each of heat exchanges is divided into 20 zones. The inadequate spatial divisions of heat exchangers can lead to the divergence in calculation. More spatial divisions can compensate the effect, bringing tremendous load to CPU conversely[7].
|
Figure 6 T-S diagram compared with design parameters |
4 Applications of Process and Control Simulation 4.1 Controller Parameters Tuning
A typical cryogenic system has dozens of controllers, all of them must be confirmed(gain, integral time, derivative time, etc). Due to the complexity of cryogenic components, the theoretical calculation of controller parameters is difficult. Based on CryoPCS, controller parameters can be tuned on the process model before implementation. The control loop(PC2270)is chose as an example to demonstrate, controlling PI2270 at 5.0 bar by CV2270 valve.
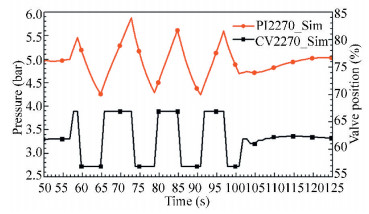
In this part, controller tuning is based on relay-feedback. The advantage is that the process is carried out in a closed-loop system, still running in the vicinity of the working point. When the process variable crosses the set-point every time, the controller output is switched. And the loop started to oscillate around the set-point, as shown in Fig. 7.
|
Figure 7 Input and output from relay-feedback test of PC2270 |
From Fig. 7, the height of relay(h), maximum amplitude(a), ultimate gain(Ku) and ultimate period(Tc) can be obtained. The parameters of PI controller are calculated using Ziegler-Nichols tuning equations as Eqs. (5) and (6):
| $ \begin{array}{l} {k_p} = 0.45{\rm{ \times }}{k_u} = 0.45{\rm{ \times }}\frac{{4h}}{{\pi a}} = 4.24\\ \;\;\;\;\;\;\;\;\;{T_i} = 0.85{\rm{ \times }}{T_c} = 10.2{\rm{s}} \end{array} $ | (5) |
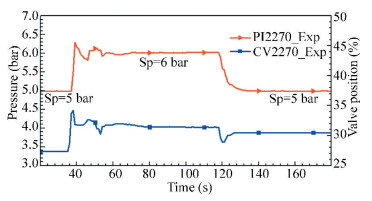
In order to test the performance, setpoint of PC2270 is changed from 5.0 bar to 6.0 bar in experiment. The maximum deviation is 0.2 bar and setting time is about 20 s, as shown in Fig. 8. After reaching to a new steady state, setpoint is set back to 5.0 bar. Simulations results indicate that PC2270 is able to follow the setpoint in time.
|
Figure 8 Performance of PC2270 under step response |
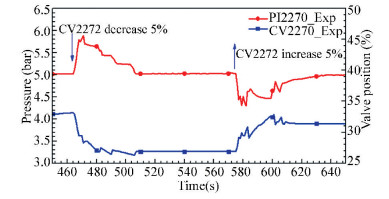
Load disturbance is also added manually through closing CV2272 by 5%. Under the disturbance, PI2270 is higher than its setpoint, causing the controller closed CV2270. With controller action, PI2270 reaches to the set state steadily, as shown in Fig. 9. Then the position of CV2272 is set back. PC2270 is able to remove the external disturbance fast.This method can tune controller parameters without affecting the safety of the actual refrigerator. Other parameter tuning methods utilizing process identification can be also achieved on CryoPCS.
|
Figure 9 Performance of PC2270 under load disturbance |
4.2 Operation Optimization of JT Bypass Valve
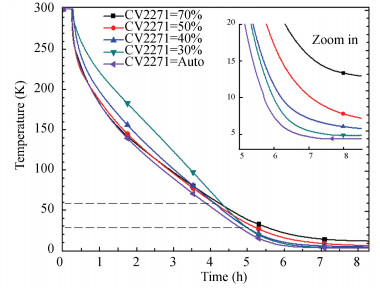
JT bypass stream is designed to accelerate the cool-down rate, which is controlled by CV2271 valve according to the returned temperature of Dewar (TI2180). It is confirmed that the operation of CV2271 is an important factor of the cool-down process. The relationship between CV2271 and TI2180 is uncertain because of the complex cryogenic devices. The operation of CV2271 is needed to explore during the coo-down process.In simulation, the position of CV2271 is set at 70%, 50%, 40% and 30% respectively during the cool-down process. Then the comparison of cool-down curves is presented in Fig. 10.

|
Figure 10 Mass flows of JT bypass stream under CV2271 |
In high temperature zone(>60 K), increasing CV2271 position is beneficial to improve the cool-down rate.However, the cool-down curve of CV2271=50% is accordant with that of CV2271=70% almost. It indicates that increasing CV2271 position further has no distinct effect, bringing more energy consumption of compressor oppositely. So the initial position is confirmed at 60% conservatively. In low temperature zone, CV2271 should be closed gradually to improve the cool-down rate. From the beginning, the cool-down rate of CV2271=50% is fast than that of CV2271=40%, and then two cool-down curves are crossed at 60 K. Below 60 K, the cool-down rate of CV2271=40% is faster than that of CV2271=30%, and then two cool-down curves are crossed at 30 K. Below 30 K, the cool-down rate of CV2271=30% is fastest. In consideration of the fact that the cold source is from TI2255 (turbine T2250 outlet), and the design value of TI2255 is about 10 K.So when TI2180 is lower than 10 K, CV2271 should be shut off. Therefore, the operation of JT bypass valve can be configured as follows:
·TI2255>60 K,CV2271=60%-40%, as the equation:
| $ \frac{{40*\left( {300 - {\rm{TI}}2255} \right) + 60*\left( {{\rm{TI}}2255 - 60} \right)}}{{300 - 60}} $ |
·60 K>TI2255>30 K,CV2271=40%-30%, as the equation:
| $ \begin{array}{l} {\rm{CV2271 = }}\\ \frac{{30*\left( {60 - {\rm{TI}}2255} \right) + 40*\left( {{\rm{TI}}2255 - 30} \right)}}{{60 - 30}} \end{array} $ |
·30 K>TI2255>10 K,CV2271=30%
·TI2180 < 10 K,CV2271=0
Energy consumption is related to mass-flow of JT bypass stream closely. Reducing massflow of JT bypass stream and raising cool-down rate are a coordinated control strategy. From Fig. 10, mass flow of JT bypass stream has been controlled at a low level, and reduced gradually with the cool-down process. Under this control scheme of JT bypass valve, the cool-down rate is faster than other JT bypass operations, as shown in Fig. 11.
|
Figure 11 Relationship between CV2271 and TI2180 |
4.3 Cool-down Process of 300 K-4.5 K in Simulation
The cool-down process from 300 K to 4.5 K has been realized automatically under the sequences program. LN2 is supplied to pre-cool HP helium, controlled by CV2415. At the beginning, CV2415 is opened at 50% until TI2410 reaches to 80 K and then controls TI2410 at 80 K. The turbine expanders are started up at room temperature, shortening the cool-down time, controlled by CV2230. During the cool-down process, CV2190 is opened fully when TI2180 > 60 K, and then controls PI2190 at 1.25 bar when TI2180 < 60 K. CV2272 is opened at 50%when TI2180>TI2255, and then controls TI2255 at 10.3 K when TI2180 < TI2255.The mass flow of JT bypass is reduced as cool down proceeds by CV2271. PI2270 is controlled at 5.0 bar by CV2270.
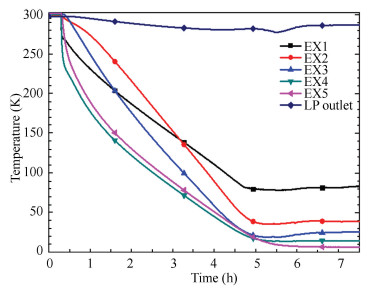
The evaluation of the cool-down process from 300 K to 4.5 K has been presented in simulation, as shown in Fig. 12. From the beginning to 4.5 h, the cool-down process from 300 K to 80 K is completed with the outlet temperature of EX1 reaching to 80 K. With the continuous actions of turbines, the refrigerator starts to produce liquid helium at about 6.8 h. At the initial appearance of two-phase helium, the mass-flow of JT stream fluctuates sharply, as shown in Fig. 13. After producing liquid helium normally, all the mass flows are balanced, and the thermodynamic parameter does not change with time nearly.
|
Figure 12 Temperature evaluation during cool-down process |

|
Figure 13 Mass flows of main streams during the cool-down process |
5 Discussion and Conclusion
In this paper, the process modeling and control simulation for a 500 W@4.5 K helium refrigerator has been implemented. An OPC server has been programmed to establish the data interaction between the process model and controllers. This simulator is conducive to understand dynamic behavior for optimizing operation and control strategies on the virtual refrigerator.Based on the actual control architecture, control programs of interlocks, sequences and closed-loops can be validated directly before their implementation in the actual refrigerator.This process simulator is proved to be an available tool for the design and operation of helium refrigerators.
The following purposes will simulate the responses of the helium refrigerator under various disturbances and optimize control strategies to strengthen its stability. Different operational sequences will be also simulated in order to optimize the operation of the helium refrigerator. In addition, the process model and the control duties are simulated separately and synchronously together, allowing the simulation of future large scale systems on several computers by decoupling the main parts of the helium cryogenic plants.
| [1] |
Bradu B, Vinuela E B, Gayet P. Example of cryogenic process simulation using EcosimPro:LHC beam screen cooling circuits.
Cryogenics, 2013 , 53 (1) : 45-50.
( 0) 0)
|
| [2] |
Kuendig A. Recent progress in dynamic process simulation of cryogenic refrigerators.
Advances in Cryogenic Engineering, 2008 , 53 (985) : 859-864.
( 0) 0)
|
| [3] |
Kuendig A, Schoenfeld H. Helium refrigerator design for pulsed heat load in Tokomaks.
Advances in Cryogenic Engineering, 2006 , 51 (823) : 1995-2001.
( 0) 0)
|
| [4] |
Bradu B, Gayet P, Niculescu S I. A process and control simulator for large scale cryogenic plants.
Control Engineering and Practice, 2009 , 17 (12) : 1388-1397.
DOI:10.1016/j.conengprac.2009.07.003 ( 0) 0)
|
| [5] |
Kutzschbach A, Kauschke M, Haberstroh Ch, et al. Dynamic characteristics of a simple Brayton cryocycle.
Advances in Cryogenic Engineering, 2006 , 51 (823) : 1987-1994.
( 0) 0)
|
| [6] |
Maekawa R, Ooba K, Mito T, et al. Dynamic simulation of a helium liquefier.
Advances in Cryogenic Engineering, 2004 , 710 : 192-199.
DOI:10.1063/1.1774682 ( 0) 0)
|
| [7] |
Maekawa R, Ooba K, Nobutoki M, et al. Dynamic simulation of the helium refrigerator/liquefier for LHD.
Cryogenics, 2005 , 45 (3) : 199-211.
DOI:10.1016/j.cryogenics.2004.10.001 ( 0) 0)
|
| [8] |
Maekawa R, Ooba K, Nobutoki M, et al. Dynamic simulation of a large scale cryogenic plant.
Advances in Cryogenic Engineering, 2006 , 51 (823) : 2002-2009.
( 0) 0)
|
| [9] |
Maekawa R, Ooba K, Nobutoki M, et al. Understanding dynamic behaviors of a large scale cryogenic plant.
Advances in Cryogenic Engineering, 2008 , 53 (985) : 483-490.
( 0) 0)
|
| [10] |
Rogez E, Bradu B, Moraux A, et al. A simulation study for the virtual commissioning of the CERN central helium liquefier.Proceedings of 22nd ICEC.Seou, 2009.249-253.
( 0) 0)
|
| [11] |
Bradu B, Gayet Ph, Niculescu S I. Control optimization of a LHC 18 kW cryoplant using dynamic simulations.
Advances in Cryogenic Engineering, 2010 , 55 (1218) : 1619-1627.
DOI:10.1063/1.3422344 ( 0) 0)
|
| [12] |
Deschidre C, Barraud A, Bonnay P, et al.Dynamic simulation of an helium refrigerator, Advances in Cryogenic Engineering, 2008, 985:475-482.
( 0) 0)
|
| [13] |
Dauguet P, Briend P, Deschildre C, et al.Using Dynamic Simulation to support Helium Refrigerator Process Engineering. Proceedings of 22ndICEC.The Korea Institute of Applied Superconductivity and Cryogenics, 2009.243-248.
http://cn.bing.com/academic/profile?id=2068530066&encoded=0&v=paper_preview&mkt=zh-cn ( 0) 0)
|
| [14] |
Briend P, Deschildre C, Icart Y, et al. Dynamic simulation of a large scale pulsed load helium refrigerator.
Advances in Cryogenic Engineering, 2010 , 55 (1218) : 1453-1459.
( 0) 0)
|
| [15] |
Dutta R, Ghosh P, Chowdhury K. Customization and validation of a commercial process simulator for dynamic simulation of Helium liquefier.
Energy, 2011 , 36 (5) : 3204-3214.
DOI:10.1016/j.energy.2011.03.009 ( 0) 0)
|
| [16] |
Dutta R, Ghosh P, Chowdhury K. Application of parallel heat exchangers in helium refrigerators for mitigating effects of pulsed load from fusion devices.
Fusion Engineering and Design, 2011 , 86 (4/5) : 296-306.
( 0) 0)
|
| [17] |
Aspen Technology.Aspen Hysys Dynamics User Guide V7.1. Burlington:Aspen Technology, 2009.29-44.
( 0) 0)
|
| [18] |
Qiu L L, Zhuang M, Hu L B, et al. Dynamic Study of a Helium Refrigerator for Tokamak. IEEE/NPSS 24th Symposium on Fusion Engineering.Piscataway:IEEE, 2011.SP2-5.
( 0) 0)
|
| [19] |
Gayet P, Bradu B.PROCOS:A real time process simulator coupled to the control system.Proceeding of ICALEPCS.Kobe, 2009.794-796.
( 0) 0)
|
| [20] |
Aspen Technology.Aspen Hysys Customization Guide V7.1. Burlington:Aspen Technology, 2009.50-57.
( 0) 0)
|
 2016, Vol. 23


