2. Graduate University of Chinese Academy of Sciences, Beijing 100039, China
The Thirty Meter Telescope is a Ritchey-Chrétien system. The main mirror is composed by 492 hexagonally-shaped hyperboloid co-phased segments. The second mirror is passively-mounted 3.1 m circle mirror. The tertiary mirror is 3.594 m by 2.576 m elliptical flat mirror. The tertiary mirror is very special because it does not just stay along the elevator axis but directs the beam collected from the main optical system to the active science instrument on the Nasmyth platforms. The tertiary mirror must point to one certain instrument during tracking. So the stability of the beam comes out from the mirror is very challenging[1-6].
The tertiary mirror is mounted in a cell with a kinematic interface to the positioner which provides rigid body rotation and tilt for the cell assembly. The mirror is developed by the Changchun Institute of Optics,Fine Mechanics and Physics,CAS,(CIOMP) in Changchun,China.
The jitter in TMT is defined as the image motion during observing. The jitter is divided into two kinds: the powered jitter and the unpowered jitter. The powered jitter is caused by the control system,such as the gap in the gear chain,the friction in the bearing and the cable warp assembly,the error in encoder disc and read head,the motor torque ripple and the deviation in the control loop. The unpowered jitter concerns about the vibration involved by the wind and all other equipment. The thermal gradient will also cause the unpowered jitter because thermal gradient may introduce slope to the wave front. This item will not be discussed in this paper,because it is concerned by the thermal control team [7-9].
The jitter requirement is developed into two levels: one is the jitter after the telescope tracking system calibration and the other is jitter after the active optic correction. The pointing calibration is simulated by a second order Butterworth high-pass filters with break frequency 0.1 Hz and break frequency 15 Hz for active optical correction[10-15].
In this paper, the jitter testing and calculation method will be discussed. Then the measurement is processed in some four meters scale system, the data set will be analyzed just as the way it will be applied to the actual tertiary mirror. The work in paper will help understand the characteristic of the jitter performance and give guide to the design of the TMT M3.
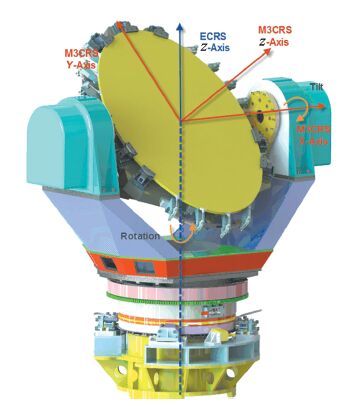
2 DefinitionThe coordinate system in Fig. 1 shows the jitter motions in the tertiary mirror system. The motions include the angle division in the ECRS-Z, M3CRS-X and M3CRS Z-translation (ZM3) .
|
Figure 1 Coordinates of the TMT M3 |
All the jitter error is finally evaluated in these three directions. As described in the section 1, the jitter is the motion of the image. So when we calculate the value of the jitter, we should measure the rigid body motion of the mirror itself, and then, project the error in the ECRS-Z, M3CRS-X and M3CRS Z axis[16-20].
To measure the motion of the mirror, we should use some sensors. The accelerometer is recently involved to replace the gyroscope. For the accelerometer, it is more convenience to allocate in the different places in very large system and with lower price.
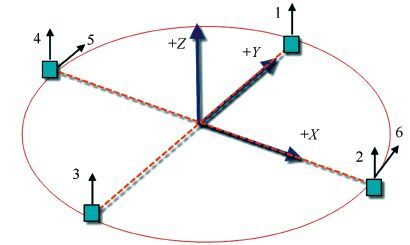
2.1 The Powered Jitter TestingFirstly, we consider the powered jitter. The powered jitter testing is concerned about the angle measurement. So the acceleration signal obtained from the accelerometers shall be integrated to displacement signal. The allocation of the accelerometer is shown in Fig. 2.
|
Figure 2 Allocation and direction of the accelerometers |
The relationship between the acceleration signal and the rigid body motion of the mirror is presented below.
The acceleration signal is measured just alone one certain axis. The signal read from the sensor is:
| $at=\left[ \begin{array}{*{35}{l}} \begin{align} & {{a}_{1}}\left( t \right) \\ & {{a}_{2}}\left( t \right) \\ \end{align} \\ {{a}_{3}}\left( t \right) \\ {{a}_{4}}\left( t \right) \\ {{a}_{5}}\left( t \right)-{{a}_{6}}\left( t \right) \\ \end{array} \right]$ |
where at is the time series vector according to the accelerometers 1 to 6. And the acceleration signal ΩM3PCRSt is
| ${{\Omega }_{M3PCRS}}\left( t \right)=\left[ \begin{align} & {{{\ddot{z}}}_{M3CRS}}\left( t \right) \\ & \ddot{\omega }x-M3CRS\left( t \right) \\ & \ddot{\omega }y-M3CRS\left( t \right) \\ & \ddot{\omega }z-M3CRS\left( t \right) \\ \end{align} \right]$ |
They are linear accelerations in the direction zM3CRS, and the rotational acceleration ωx-M3CRS, ωy-M3CRS and ωz-M3CRS.
| $\begin{align} & {{a}_{1}}\left( t \right)=\ddot{z}M3CRS\left( t \right)+\ddot{\omega }x-M3CRS{{R}_{y}} \\ & {{a}_{2}}\left( t \right)=\ddot{z}M3CRS\left( t \right)-\ddot{\omega }y-M3CRS{{R}_{x}} \\ & {{a}_{3}}\left( t \right)=\ddot{z}M3CRS\left( t \right)-\ddot{\omega }x-M3CRS{{R}_{y}} \\ & {{a}_{4}}\left( t \right)=\ddot{z}M3CRS\left( t \right)+\ddot{\omega }y-M3CRS{{R}_{x}} \\ & {{a}_{5}}\left( t \right)-{{a}_{6}}\left( t \right)=2\omega \ddot{\ }z-M3CRS{{R}_{x}} \\ \end{align}$ |
The transform matrix connecting a(t) and ΩM3PCRS(t) are defined as follows:
| $\Gamma =\left[ \begin{array}{*{35}{l}} 1 & {{R}_{y}} & 0 & 0 \\ 1 & 0 & -{{R}_{x}} & 0 \\ 1 & -{{R}_{x}} & 0 & 0 \\ 1 & 0 & {{R}_{x}} & 0 \\ 0 & 0 & 0 & v \\ \end{array} \right]$ |
Though it, ΩM3PCRS(t) is mapped into a(t) using formula (1) .
| $a\left( t \right)=\Gamma {{\Omega }_{M3PCRS}}\left( t \right)$ | (1) |
The least square estimate is used to figure out ΩM3PCRS(t):
| ${{\Omega }_{M3PCRS}}\left( t \right)={{\left( {{\Gamma }^{T}}\Gamma \right)}^{-1}}{{\Gamma }^{T}}a\left( t \right)$ |
Then we project the rotational motion in ECRS-Z:
| $\ddot{\omega }Z-ECRS\left( t \right)=\ddot{\omega }z-M3PCRStcos\left( \zeta \right)+\ddot{\omega }y-M3PCRS\left( t \right)sin\left( \zeta \right)$ |
After the acceleration of the mirror rigid body motion is obtained, the integration shall be processed for the displacement information.
The Fourier transform is used to integrate the signal, as shown in formula (2) :
| $y=\sum\limits_{k=0}^{N-1}{-}\frac{1}{{{\left( 2\pi k\Delta f \right)}^{2}}}WkXke{{~}^{j2\pi kr/N}}$ | (2) |
We note the sampling window is that:
| $Wk=\left\{ \begin{matrix} 1, & {{f}_{d}}\le k\Delta f\le {{f}_{u}} \\ 0 & {} \\ \end{matrix} \right.$ |
where fd and fu are the low break frequency and high break frequency of the signal.
In general, the band shall be as large as possible. In the frequency domain, the integration procedure can be approached by dividing the frequency twice as is showed in formula (2) .
The frequency integration involves all the data to reach the result, so the tending term will nerve spoil the result. On the contrary, the integration in time domain will involve quadratic tending term.
On the other hand, the integration procedure is like a low pass filter. The frequency integration is easier to control the break frequency. The high break frequency should be high enough to make sure that the main information will not be lost. The power spectral density method should be used to specify which frequency component contributes the most.
2.2 The Unpowered Jitter TestingThe unpowered jitter is almost a problem of dynamic identification and analysis. If the parameter of the dynamic system can be achieved in advance, the performance of the system in real environment vibration, such as wind load, can be estimated.
For system in such large size, the traditional method may not work very well. Random decrement technique is a very good method to obtain free respond for identifying the model parameters.
The formula of the random decrement technique is shown in formula (3) :
| $\delta \left( \tau \right)=\frac{1}{W}\sum\limits_{k=1}^{W}{x\left( {{t}_{k}}+\tau \right)}$ | (3) |
The equation of the dynamic system is presented by the following formula:
| $\left[ M \right]\left\{ {\ddot{x}} \right\}+\left[ C \right]\left\{ {\dot{x}} \right\}+\left[ K \right]\left\{ x \right\}=\left\{ f\left( t \right) \right\}$ | (4) |
The linear operator is noted as:
| ${{L}_{ij}}={{M}_{ij}}\frac{{{d}^{2}}}{d{{t}^{2}}}+{{C}_{ij}}\frac{d}{dt}+{{K}_{ij}}$ |
Formula (4) can be rewritten as:
| $\left[ L \right]\left\{ x \right\}=\left\{ f\left( t \right) \right\}$ |
We consider some time delay of the respond, and average the W responds up to the unknown excitation.
| $\begin{array}{*{35}{l}} \frac{1}{W}\sum\limits_{k}^{W}{\left[ {{L}_{ij}} \right]}\left\{ {{x}_{j}}\left( {{t}_{k}}+\tau \right) \right\}= \\ \frac{1}{W}\sum\limits_{k}^{W}{\left\{ {{f}_{j}}\left( {{t}_{k}}+\tau \right) \right\}} \\ \end{array}$ |
Supposed the excitation is random, so the average of the excitation is zero.
| $\frac{1}{W}\sum\limits_{k}^{W}{\left\{ {{f}_{j}}\left( {{t}_{k}}+\tau \right) \right\}}=\left\{ 0 \right\}$ |
So:
| $[{{L}_{ij}}]\frac{1}{W}\sum\limits_{k}^{W}{\left\{ {{x}_{j}}\left( {{t}_{k}}+\tau \right) \right\}}=0$ |
Now we know, formula(3) is the free response of the system. Then, we use the Fourier transfer and can obtain the transfer function:
| $FFT\left( \delta \right)=H$ |
The transfer function of a linear system is as follows:
| $H=\sum\limits_{r=1}^{N}{\frac{1}{{{K}_{er}}\left[ \left( 1-{{{\bar{\omega }}}_{r}}^{2} \right)+\left( 2{{\xi }_{r}}{{{\bar{\omega }}}_{r}}^{2} \right)j \right]}}$ |
If the modes are separated enough, around the resonance frequency, the system performance is dominated by the model and the system acts as the single degree of freedom system. At the range, the real part and the image part of the transfer function are as follows:
| $\begin{array}{*{35}{l}} {{H}_{lp}}^{R}=\frac{1-{{{\bar{\omega }}}_{r}}^{2}}{{{K}_{er}}\left[ {{\left( 1-{{{\bar{\omega }}}_{r}}^{2} \right)}^{2}}+{{\left( 2{{\xi }_{r}}{{{\bar{\omega }}}_{r}}^{2} \right)}^{2}} \right]}+{{H}_{r}}^{R} \\ {{H}_{lp}}^{I}=\frac{-2{{\xi }_{r}}{{{\bar{\omega }}}_{r}}}{{{K}_{er}}\left[ {{\left( 1-{{{\bar{\omega }}}_{r}}^{2} \right)}^{2}}+2{{\left( {{\xi }_{r}}{{{\bar{\omega }}}_{r}}^{2} \right)}^{2}} \right]}+{{H}_{r}}^{I} \\ \end{array}$ |
We note that ωr=ω/ωr,and we use derivation to approach that:
| $\left. \matrix{ {d \over {d{{\bar \omega }_r}}}{H_{lp}}^I = 0 \hfill \cr {d \over {d{{\bar \omega }_r}}}{H_r}^R = 0 \hfill \cr} \right\} \Rightarrow \left\{ \matrix{ {{\bar \omega }_r} \approx 1 \hfill \cr {{\bar \omega }_r} = 1 \pm 2{\xi _r} \hfill \cr} \right.$ |
The location of the peak in the real/image part of the transfer function can help identify the resonance frequency and damping ratio. For the jitter calculation, we can consider the power and tip/tilt case separately as several single degree of freedom systems.
We consider the case ωr=1. The image part of the transfer function is that:
| ${{H}_{lp}}^{I}=\frac{-1}{{{K}_{er}}2{{\xi }_{r}}}=\frac{-{{\phi }_{lr}}{{\phi }_{pr}}}{{{K}_{r}}2{{\xi }_{r}}}$ |
Now, we can see that the mode shape is in proportion to the image part of the transfer function
| $\left\{ {{\phi }_{lp}} \right\}=-{{K}_{r}}2{{\xi }_{r}}\left\{ {{H}_{lp}}^{I}\left( {{\omega }_{r}} \right) \right\}$ | (5) |
For the unpowered jitter, we concern more about the power mode and tip/tilt mode of the rigid mirror. By this, if we put more testing points on the mirror, we can tell which frequency is respond to the warping mode and which is for the rigid body mode. When the mirror is moving as a whole, the amplification of the different testing points will in a certain proportion. It will be shown in the next section.
When we talk about the wind load of the telescope, the spectral analysis is most popular method.The wind load can be described as spectral in some certain from;and then, the spectral density of the unpowered jitter can be described as shown in formula (6) :
| $S{{\left( f \right)}_{jitter}}=S{{\left( f \right)}_{wind}}{{\left| Hf \right|}^{2}}$ | (6) |
Where
| $S{{\left( f \right)}_{wind}}\approx \frac{200F}{{{\left( 1+50F \right)}^{5/3}}}\frac{{{u}^{2}}}{f}$ |
here F is coefficient; u is the velocity and f is the frequency.
For the property of the power spectral density, the transition between the mean square root of the turbulence σtrubulence2 and the mean square root of the jitter σjitter2 is shown in formula (7) .
| ${{\sigma }_{jitter}}^{2}=\sum\limits_{k=0}^{N-1}{\|H\left( k \right){{\|}^{2}}{{\sigma }_{trubulence}}^{2}}$ | (7) |
Firstly, the accelerometers for the test shall be calibrated. The jitter requirement after 0.1 Hz corner frequency filter is 0.1arc second and 2.2milli arc second. Correspondingly, the accuracy of the acceleration is 0.05 arc second and 0.05mili arc second.
In order to better specify the frequency property, the cumulative and anti-cumulative power spectral density are used. By them, it can be told which frequency range corresponds to the signal versus noise.
The cumulative power spectral density is shown in formula (8) :
| $PS{{D}_{c}}\left( f \right)={{\int }_{0}}^{f}PSD\left( s \right)ds$ | (8) |
The definition informula (8) makes it clear that: the whole curve is related to the very low frequency parts where is dominated by the drift and noise. Of course, we can calculate the cumulative spectrum at a very low non-zero frequency, but it seems arbitrary to determine the frequency region corresponds to the signal versus the noise.
So, the reverse cumulative power spectral density is introduced and is shown in formula (9) :
| $PS{{D}_{r\_c}}\left( f \right)=\int_{f}^{\infty }{PSD\left( s \right)ds}~$ | (9) |
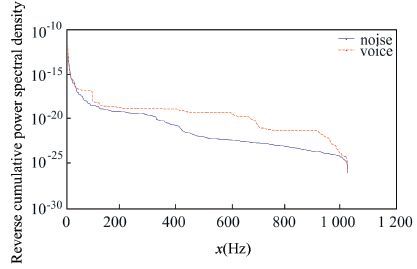
The reverse cumulative power spectral density can tell how the energy is distributed in the frequency domain. At the characteristic frequency, the reverse power spectral density will appear sharp decrease. The influence of the noise can be subtracted.
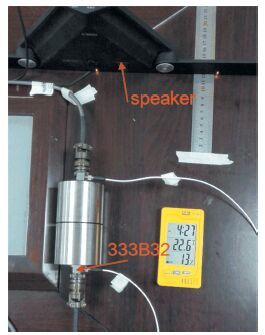
We use a speaker play the same voice at three different distances: far (900 mm), middle (600 mm) and close (300 mm). The setup is shown in Fig. 3. Then we check the power spectral density of the 333B32 outcome time series at a sampling frequency 2 048 Hz. And the accelerometer works well in all the frequency range.
As shown in Fig. 4, the tone in three curves is almost the same. The amplification is different corresponding to the distance. For Fig. 5, we can see the dominated frequency (close condition) at 100 Hz and 700 Hz for the noise the metric for the two previous cases are 0.44 micrometer and 0.031 micrometer. They can be scaled into rotational accuracy 0.049 arc second and 0.0034milli arc second scaled by 1.79 m radius.
|
Figure 3 Set up for the accelerometer calibration |

|
Figure 4 Power spectral density of the 333B32 signal |
|
Figure 5 Reverse-cumulative power spectral density of the jitter signal |
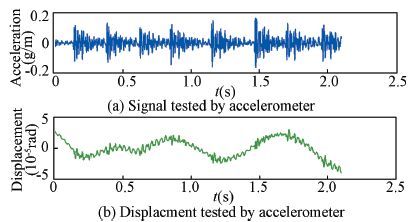
We test the tip/tilt jitter of a large telescope. It is similar to the jitter about the ECRS-Z or M3CRS-X axis. We put accelerometers on the mirror as previous design. The acceleration signal is shown in the upper part of Fig. 6. And the displacement signal is shown in the lower part of Fig. 6.
|
Figure 6 Powered jitter acceleration (up) and the displacement (down) |
The second order Butterworth high-pass filters with break frequency 0.1 Hz is applied to the data. We can see that the low order ripple of the signal is filtered due to calibration. Actually, to the mass spring system, the very high frequency component will be constrained because of mass. The jitter in this case is 1.6” RMS.
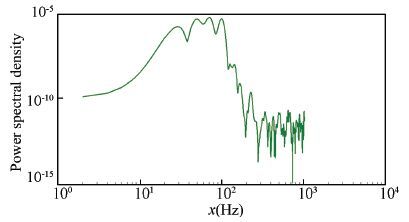
Now we can see the power spectral density of the signal, as shown in Fig. 7. The frequency components in 20 Hz to 100 Hz contribute much to the jitter.
|
Figure 7 The power spectral density of the jitter signal |
What next to do is about the unpowered jitter. The unpowered jitter is more like a transfer function testing.
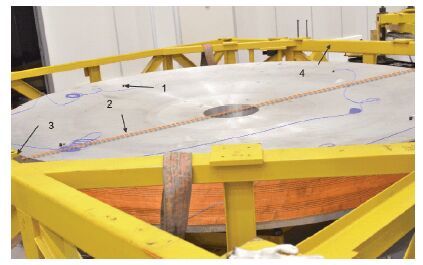
We suppose that the resonance frequencies are not very close to each other. Thus, for the power and tip/tilt modes which affect the jitter in the ECRS-Z, M3CRS-X and M3CRS Z-translation (ZM3) , they can be considered separately. We put four accelerometers on the surface of the aluminum mirror to measure the modes, as shown in Fig. 8.
|
Figure 8 Allocation of the accelerometers on the mirror (1.the accelerometers; 2.tilt axis; 3.excited location; 4.tuss) |
The excitation is applied to the truss structure around the mirror. Though the passive support system, namely, whiffle tree, the mirror is excited.
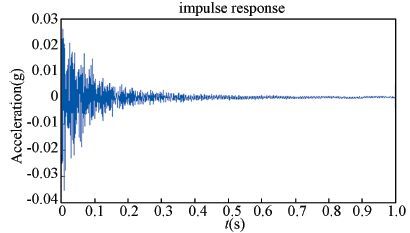
We use the random decrement technique to obtain the free response, as shown in Fig. 9. In Fig. 9, we can see the signal completes the attenuation just in the sampling time. It is indeed important that the oscillation comes to an end, because only the entire free response with good damping can be transferred to the transfer function.
|
Figure 9 Free response of the mirror system |
By the Fourier transform method the transfer function can be established. In Fig. 9, the conclusion can be reached that the signal to noise ratio is adequate to tell the first few orders of the structure model parameters.
As shown in Figs. 10-11, the first order of vibration mode is at 88 Hz. whereas, the image part of the transfer function releases that, as shown in formula (5) , the points 1, 3 move at the same direction opposite to the points 2, 4. So, it is obvious that this very model is the mirror itself warping as astigmatic.
The peak located around the 107 Hz, is the four points move as piston, called powering, with 0.14% damping.Consequently, so do the tip (183 Hz, 0.6%) and tilt (193 Hz, 0.19%).Thus, the single degree of freedom system can be built for the jitter in the ECRS-Z, M3CRS-X and M3CRS Z-translation (ZM3) .By this model, with the concrete data of the environment oscillation and wind load, we can reach the unpowered jitter.
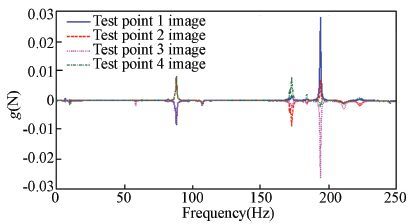
|
Figure 10 The image part of the transfer function of the mirror system |

|
Figure 11 The real part of the transfer function of the mirror system |
4 Conclusions
For the TMT M3, the jitters requirement is very tight. For the powered jitter, the jitter is a major concern about the control hardware and software. For a classical telescope the jitter in tip is 1.6”RMS. For the unpowered jitter, a four meter scale system is under test to obtain the dynamic property of the structure.
The paper rises a method to test and calculate the powered and unpowered jitter. By this work, the system engineers have completely understood the property of the jitter in the large telescope. The estimation of the TMT M3 performance can be also reached.
| [1] |
Wang W B, Wang T F, Guo J. Analysis for opto-electrical acquisition tracking and pointing control technology on satellite.
Chinese Optics, 2014 , 7 (6) : 879-888.
( 0) 0)
|
| [2] |
FordV, Carter C, Delrez C. Jitter studies for the secondary and tertiary mirror systems on the thirty meter telescope.
Proceedings of SPIE Advances in Optical and Mechanical Technologies for Telescopes and Instrumentation, 2014 , 9151 (2) : 1-15.
DOI:10.1117/12.2055036 ( 0) 0)
|
| [3] |
Wang F G, An Q C. Evaluation of mirror surface figures for TMT based on SlopeRms.
Editorial Office of Optics and Precision Engineering, 2014 , 22 (5) : 1171-1175.
DOI:10.3788/OPE. ( 0) 0)
|
| [4] |
Cao X T, Sun T Y, Zhao Y L, et al. Current status and development tendency of image stabilization system of large aperture space telescope.
Chinese Optics, 2014 , 7 (5) : 739-748.
( 0) 0)
|
| [5] |
FloydM A, Lin C A, Lyons M G. Scan stabilization and Jitter control for an airborne telescope.
SPIE Acquisition, Tracking and Pointing, 1986 , 641 (1) : 102-120.
( 0) 0)
|
| [6] |
Wang X J. Correction of angle measuring errors for large telescopes.
Optics and Precision Engineering, 2015 , 23 (9) : 2446-2451.
DOI:10.3788/OPE. ( 0) 0)
|
| [7] |
Wu X X, Li J J F, Song S M, et al. Active support system for 4 m SiC lightweight primary mirror.
Optics and Precision Engineering, 2014 , 22 (9) : 2451-2457.
DOI:10.3788/OPE. ( 0) 0)
|
| [8] |
Glaese R, Sheehan M. Vibration mitigation for wind-induced jitter for the giant magellan telescope.
SPIE Ground based and Airborne Telescopes IV, 2012 , 8444 (5) : 1-15.
( 0) 0)
|
| [9] |
Su Y Q, Zhang J X, Wang F G, et al. Seismic analysis of TMT M3 cell assembly based on spectral response.
Optics and Precision Engineering, 2014 , 22 (4) : 996-1003.
DOI:10.3788/OPE. ( 0) 0)
|
| [10] |
Pierre Y, Olivia L L, John L H. The line-of-sight jitter of the Hubble Space Telescope.
SPIE, 1945 (1) : 55-61.
( 0) 0)
|
| [11] |
Gawronski W. Control and pointing challenges of large antennas and telescopes.
IEEE Transactions on Control Systems Technology, 2007 , 15 (2) : 276-289.
DOI:10.1109/TCST.2006.886434 ( 0) 0)
|
| [12] |
Snel R C, Mangum J G, Baars J W M. Study of the dynamics of large reflector antennas with accelerometers.
IEEE Antennas and Propagation Magazine, 2007 , 49 (4) : 84-101.
DOI:10.1109/MAP.2007.4385600 ( 0) 0)
|
| [13] |
Su Y Q, Zhang J X, Yang F, et al. Conceptual design of rotator assembly bearing in TMT tertiary mirror system.
Optics and Precision Engineering, 2013 , 21 (6) : 1510-1517.
DOI:10.3788/OPE. ( 0) 0)
|
| [14] |
Warren Skidmore, Chris Carter. Experiment Plan for pseudo-M3 Bearing Characterization Measurements on the Gemini Cassegrain Rotator.
TMT, 2012 : 2-26.
( 0) 0)
|
| [15] |
Wang F G, Yang F, Zhao H C, et al. Progress in TMT M3 system.
Chinese Optics, 2013 , 10 (6) : 643-651.
( 0) 0)
|
| [16] |
MacMartin D G, Thompson P, Colavita M M, et al. Dynamic analysis of the active-controlled segmented mirror of the thirty meter telescope.
IEEE Trans. Control Sys. Tech, 2013 , 22 : 58-68.
( 0) 0)
|
| [17] |
Koehler B, Kraus M, Moresmau J M, et al. The VLTI Auxiliary Telescopes: measured performances.
SPIE Advances in Stellar Interferpmetry, 2006 , 6268 (41) : 1-12.
DOI:10.1117/12.670639 ( 0) 0)
|
| [18] |
Kan Frank W, Eggers D W. Wind vibration analyses of giant magellan telescope.
SPIE Modeling System Engineering and Project Management for Astronomy II, 2006 , 6271 (1) : 1-13.
( 0) 0)
|
| [19] |
NeilD R, Sebag J, Warner M, et al. Wind induced image degradation (jitter) of the LSST telescope.
SPIE Ground based and Airborne Telescopes II, 2008 , 7012 (1) : 1-11.
DOI:10.1117/12.790025 ( 0) 0)
|
| [20] |
Mayo J. Mechanical jitter measurement results for large ground-based telescopes.
SPIE Astronomical Structures and Mechanisms Technology, 2004 , 5495 (1) : 98-103.
( 0) 0)
|
 2016, Vol. 23


