2. State Key Laboratory of Vehicle Transmission, Beijing Institute of Technology, Beijing 100081, China
Because the gyroplane rotor is unpowered in flight, the speed of which needs to be brought up by some means before takeoff. The taxiing and spinning-top method was utilized before. In later developments of the gyroplane, a variable pitch system was used such that the blades could be set to flat pitch when the gyroplane was on the ground and increased to a fixed pitch for normal flight[1].To perform a jump takeoff with this system, the pilot first overspeed the rotor, then rapidly applied collective pitch while declutching the rotor to avoid any torque reaction. The mechanical, hydraulic, electric prerotator and tip jets are used for gyroplane jump takeoff[2].
The jump takeoff was studied experimentally by Wheatly in 1936. The experiment used a 10 feet model rotor, whose blades pitch angle was adjustable on the ground. The jump takeoff height was obtained by a rope and the rotor speed was measured by a motion picture camera[3]. These test apparatus are old, heavy and inefficient.
Few theoretical studies have involved gyroplane jump takeoff. A model modified by a constant torque coefficient and an uniform inflow was built Wheatly[3]. Then Prewitt[4] gave a technical discussion about the possibilities of jump takeoff in 1938. The large aerodynamic benefits of RBPI were illustrated by dynamic inflow models[2, 5-6]. In 1981, Wheatly's model was extended by adequate jump start experience by AIR&SPACE 18A and programmed in BASIC by Hollmann[7]. In the program, the rotor torque coefficient is a product of an adjustable experienced coefficient and a quadratic function of the blades pitch. Zhu Qinghua applied Pitt/Peters dynamic inflow theory to a jump takeoff model in 2008[8-14].
This paper provides a new small scale experiment apparatus, approach and measurement methods for the vertical phase of jump takeoff. Then a nonlinear and time-dependent dynamics model for gyroplane jump takeoff in consideration of the unsteady ground effect and RBPI is established and validated against the experiment data. In Table 2 of section 3.3, the proposed model is marked with a five-pointed star, and three other simplified models are marked with number 1, 2 and 3. The model precision is evaluated by comparing the height and rpm history, the MSE (PMSE) and MHE with that of experiment data, a Hollmann and three other simplified models. Lastly, the effect of the ground and RBPI on the thrust and induced velocity of the rotor is investigated.
| Table 2 The several jump takeoff dynamics models |
2 Jump Takeoff Experiment 2.1 Apparatus and Configuration
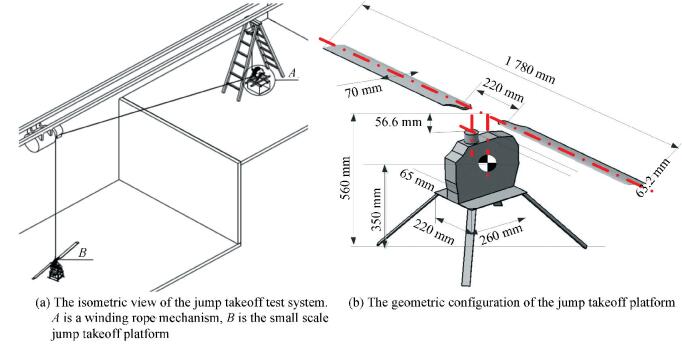
The test system built by Beijing Institute of Technology consists of a winding rope mechanism (Fig. 1(a), A), a small scale jump takeoff platform (Fig. 1(a), B) and other accessories. The geometric configuration of the platform is shown in Fig. 1(b). The platform on the ground floor is 4 m lower than the winding mechanism on the second floor, and the horizontal distance between them is random.
|
Figure 1 The jump takeoff test system and the small scale platform |
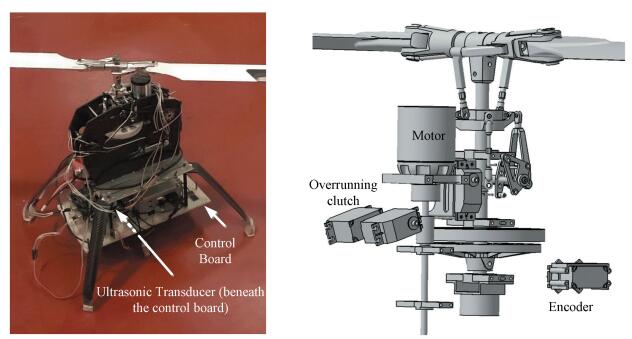
The test system introduced in this paper is a renovation of NACA test at four aspects. First, a smaller, lighter, and more effective test platform than NACA is modified by the main system of an ALIGN TREX 800E helicopter. Second, an overrunning clutch connects electric motor and gear pair. Third, a double ratchet in winding rope facility is able to restrain drum rotation for rolling rope up and release rope in reverse direction. Fourth, an ultrasonic sensor is installed beneath the control board for the height history, an encoder is installed at rotor shaft for the rpm history, and meanwhile a gyroscope for flight attitude of the model gyroplane is used. The specifications of the model gyroplane and accessories are listed in Table 1. A picture of the jump takeoff platform and 3D models of some gyroplane components are presented in Fig. 2.
| Table 1 The specifications of the model gyroplane and measurement apparatus |
|
Figure 2 The picture and partial 3D model of the jump takeoff platform |
2.2 Setup and Method
These tests are made with an initial rotor speed 1 500 r/min and the zero-lift attack angle on the ground and a 6° blades pitch angle during a jump. Before takeoff, the rotor rpm increases to a specified pre-rotative speed, 1 500 r/min, greater than the normal flight value as the pitch angle of the blades is kept near zero. At this condition, the rotor has zero lift and minimum drag. Then, the motor is shut down and blades pitch angle is simultaneously increased to peak value 6° by the joystick of an 8 channel Futaba digital proportion R/C system. The operating time is defined as 0.1 s. Until the motor speed is lower than the rotor, the overrunning clutch is disengaged. From this moment to the maximum jump takeoff height, the rotor keeps slowing down, and the vertical velocity of the platform rises and then slows down. When the platform reaches the maximum height, its velocity reduces to zero. Until the platform passes the peak height, it gets a reverse motion of falling down to the ground, but the reverse velocity is much too small. At this very moment, the platform is stopped by a double ratchet. This stop will protect it from falling down and being damaged.
During the jump, the height and rpm time history are recorded by a motor encoder, a rotor encoder, and an ultrasonic sensor. The blind area of the ultrasonic sensor is 0.175 m and the distance between the control board and the ground is 0.052 m. The height data will keep constant until the board's distance is bigger than the blind area. It means that the height data changes as the CG height is 0.463 m.
3 Jump Takeoff Dynamics 3.1 Mathematical ModelTwo assumptions are made during the development of the gyroplane dynamics model. The gyroplane's CG is on the line of the thrust rotor, and it is always true because the rotor has no flag hinge. The influences of four other degrees of freedom on vertical movement and rotation around rotor shaft are negligible.
The nonlinear dynamics equations with dimensions reduction are taking the form:
| $ \mathit{\boldsymbol{\dot y = F}} $ | (1) |
Where the vector y contains the fuselage vertical translational velocity or displacement and the rotor angular speed reduction, the vector F represents generalized force.
A detailed matrix model for jump takeoff is:
| $ \begin{array}{*{20}{c}} {\left[ {\begin{array}{*{20}{c}} {\dot V}\\ {\dot \Omega } \end{array}} \right] = \left[ {\begin{array}{*{20}{c}} {\frac{1}{m}}&0\\ 0&{\frac{1}{J}} \end{array}} \right]\left[ {\begin{array}{*{20}{c}} {\sum T }\\ Q \end{array}} \right] + \left[ {\begin{array}{*{20}{c}} g\\ 0 \end{array}} \right]}\\ {\sum T = T - \Delta T} \end{array} $ | (2) |
Where T stands for the rotor thrust, and Q stands for the torque coefficient of the rotor shaft. ΔT is an extra rotor thrust to overcome the vertical drag from fuselage, which can be obtained by a precise nonlinear rotor aerodynamics model including the ground effect and RBPI.
3.1.1 Rapid blade-pitch increaseA Solution of the induced velocity is got based on BEMT by Gustafson & Gessow[15]. For a vertical moving gyroplane with constant velocity V, the rotor thrust as given by the blade element momentum theory(BEMT) is
The benefit of RBPI on the jump takeoff performance and the rotor thrust mainly comes from a dynamic induced velocity when pitching. Before the pitch change, no air is passing through the rotor disk. As soon as the pitch reaches a positive value, the induced velocity vi starts to build up. If the induced velocity is assumed to be uniform over the rotor disk, the initial flow field is exactly analogous to the flow field produced by an impervious disk which is moved normal to its plane. The apparent additional mass of fluid associated with an accelerating impervious disk is given[16] as 63.7% of the mass of fluid in the circumscribed sphere. Although the analogy with the accelerating impervious disk is not strictly valid after a slipstream has formed, it will nevertheless be assumed that this same apparent additional mass is associated with the rotor disk and must be accelerated during the induced velocity buildup. The force requires to accelerate this mass of air is
| $ {m_a}{{\dot v}_{im}} + \int_{{r_1}}^{{r_2}} {4{\rm{\pi }}\rho \left( {V + {v_i}} \right){v_i}r{\rm{d}}r} = {T_\infty } $ | (3) |
where dT∞ is the thrust of the rotor out of ground effect based on the blade element theory(BET).
3.1.2 Rotor thrust and torque out of ground effect(OGE)The thrust and torque of rotor OGE are solved by the blade element theory as follows[17]:
| $ {T_\infty } = \int_{{r_1}}^{{r_2}} {{\rm{d}}{T_\infty }} ,Q = \int_{{r_1}}^{{r_2}} {{\rm{d}}{Q_\infty }} $ | (4) |
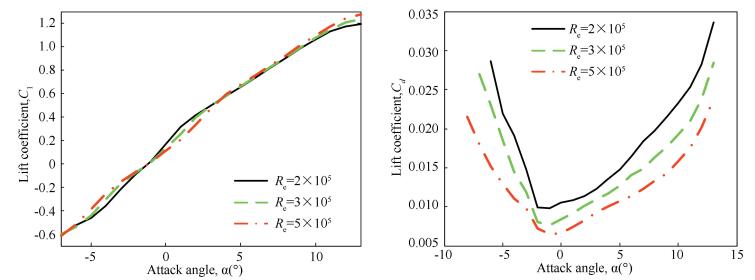
The 2D airfoil lift and drag coefficient, Cl and Cd, at an angle of attack α and Reynolds Number Re can be obtained from a look-up table of data provided by Xfoil:
| $ {C_d} = {d_0} + {d_1}\alpha + {d_2}{\alpha ^2} + {d_3}{\alpha ^3} + {d_4}{\alpha ^4} $ | (5) |
The effect of the finite aspect of the rotor blade on thrust coefficient in experience[15] is counted by a fitting form as follows. AR denotes a finite aspect of the rotor blade.
| $ AR = \frac{{2\left( {{r_2} - {r_1}} \right)}}{c} $ | (6) |
| $ {C_l} = \frac{{AR}}{{AR + 2}}\left( {{a_0} + {a_1}\alpha + {a_2}{\alpha ^2} + {a_3}{\alpha ^3}} \right) $ | (7) |
Prandtl provided a solution to the problem of the loss of lift near the tips resulting from the induced effects associated with a finite number of blades. The tip loss correction factor could be expressed:
| $ F = \left( {\frac{2}{{\rm{\pi }}}} \right)\arccos \left( {{e^{ - f}}} \right) $ | (8) |
| $ f = \frac{{{N_b}}}{2}\left( {1 - \frac{r}{R}} \right)\left( {\frac{{\Omega R}}{{V + {v_i}}}} \right) $ | (9) |
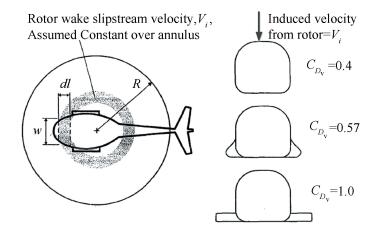
The vertical drag on the fuselage can be calculated by estimating the drag coefficient of individual 2-D fuselage cross sections (a strip approach), which is suggested by Stepniewski & Keys[18]. The vertical drag of the entire fuselage can be obtained by successively testing 2-D cross sections of the fuselage to determine the pressure distributions and then finding the net drag on the fuselage by summation. The incremental vertical drag on any segment of the fuselage of length dl and width w (as shown in Fig. 3) will be:
|
Figure 3 The strip analysis of the fuselage for the estimation of vertical drag |
| $ \Delta T = {D_v}=\sum {d{D_v}} $ | (10) |
| $ d{D_v} = \frac{1}{2}\rho v_i^2{C_{{D_v}}}wdl $ | (11) |
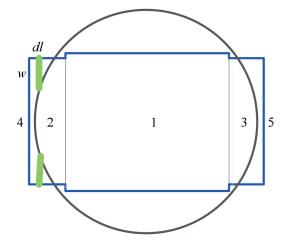
The cross sectional area is the shadow union of the fuselage bottom plate and control board, which is divided into 5 pieces, like Fig. 4, the velocity of 1, 2 and 3 is the vertical velocity and that of 4 and 5 is the local induced velocity. Eqs.(10) and (11) becomes:
|
Figure 4 The cross sectional area of fuselage for gyroplane vertical drag |
| $ {D_v} = \sum\limits_{n = 4}^5 {{D_v}\left( {{v_i}} \right)} + \sum\limits_{n = 1}^3 {{D_v}\left( V \right)} $ |
The vertical drag recovery in ground effect(IGE), the rotational interference between the rotor and fuselage is negligible in the model.
3.1.4 Ground effectThe ground effect is especially important for a small scale model gyroplane, since it is flying in ground effect throughout the jump takeoff. Although the ground effect is an unsteady variable in jump, it is regarded as constants in each time step, so are the vertical and angular velocity, the thrust and torque of the rotor. The ground effect can be expressed in terms of the increase in the thrust or can be viewed as a reduction in the rotor induced velocity. Neglecting any secondary effect of blade loading, the IGE function simply is obtained:
| $ \begin{array}{*{20}{c}} {h = \int_0^t {V{\rm{d}}t} }\\ {\frac{T}{{{T_\infty }}} = \frac{1}{{1 - {{\left( {\frac{R}{{4\left( {h + {h_{{\rm{rotor}}}}} \right)}}} \right)}^2}}}} \end{array} $ |
A Numerical solution of the mathematical model is rigorous without any algebraic approximation like sin θ=θ, cos θ=1 and arctan(UP/UT)=UP/UT when θ is small enough, or
The solving difficulty located at the implicit relation among the induced velocity, the thrust and torque, and the height and rpm affected by the unsteady ground effect and RBPI. Since the RBPI takes the operating time and the rotor aerodynamics is affected by the presence of the ground when rotor operating in close proximity to the ground, the time-dependent and nonlinear dynamics model for jump takeoff could be numerically solved by the piecewise function of time, which is separated by the RBPI ending time TP and the time that the rotor flying off the IGE area TIGE.
| $ {T_P} = {N_1}\Delta t,{T_{{\rm{IGE}}}} = {N_2}\Delta t $ |
Where Δt is the time step of the numerical solution and must be small enough to insure that a further reduction will not appreciably affect the results. N1 and N2 are the numbers of time steps. N1 < N2 is easy to get. The RBPI rate can be expressed as θ/TP and a pitch increment of blades in each time step is θ/N1. The IGE function is introduced when t < TIGE during jump.
The relation between the thrust and induced velocity of the rotor is shown below:
| $ \left\{ \begin{array}{l} \int_{{r_1}}^{{r_2}} {4{\rm{\pi }}\rho \left( {V + {v_i}} \right){v_i}r{\rm{d}}r} = \int_{{r_1}}^{{r_2}} {{\rm{d}}T} ,{v_{im}} = \frac{1}{{{r_2} - {r_1}}}\int_{{r_1}}^{{r_2}} {{v_i}{\rm{d}}r} ,\;\;\;\;\;\;\;\;\;\;\;\;\;\;\;\;\;\;\;\;\;\;\;\;\;t = 0\\ v_{im}^n = \frac{1}{{{r_2} - {r_1}}}\int_{{r_1}}^{{r_2}} {v_i^n{\rm{d}}r} ,{m_a}\frac{{v_{im}^n - v_{im}^{n - 1}}}{{\Delta t}} + \int_{{r_1}}^{{r_2}} {4{\rm{\pi }}\rho \left( {V + v_i^n} \right)v_i^nr{\rm{d}}r} = \int_{{r_1}}^{{r_2}} {{\rm{d}}T} , \;t \le {N_1}\Delta t\\ \int_{{r_1}}^{{r_2}} {4{\rm{\pi }}\rho \left( {V + {v_i}} \right){v_i}r{\rm{d}}r} = \int_{{r_1}}^{{r_2}} {{\rm{d}}T} ,\;\;\;\;\;\;\;\;\;\;\;\;\;\;\;\;\;\;\;\;\;\;\;\;\;\;\;\;\;\;\;\;\;\;\;\;\;\;\;\;\;\;\;\;\;\;\;\;\;{N_1}\Delta t < t \le {N_2}\Delta t\\ \int_{{r_1}}^{{r_2}} {4{\rm{\pi }}\rho \left( {V + {v_i}} \right){v_i}r{\rm{d}}r} = \int_{{r_1}}^{{r_2}} {{\rm{d}}{T_\infty }} ,\;\;\;\;\;\;\;\;\;\;\;\;\;\;\;\;\;\;\;\;\; \;\;\;\;\;\;\;\;\;\;\;\;\;\;\;\;\;\;\;\;\;\;\;\;\;\;{N_2}\Delta t < t \end{array} \right. $ |
During all procedures, the induced velocity is given above, and the thrust and torque of the rotor are integrated by the BET.
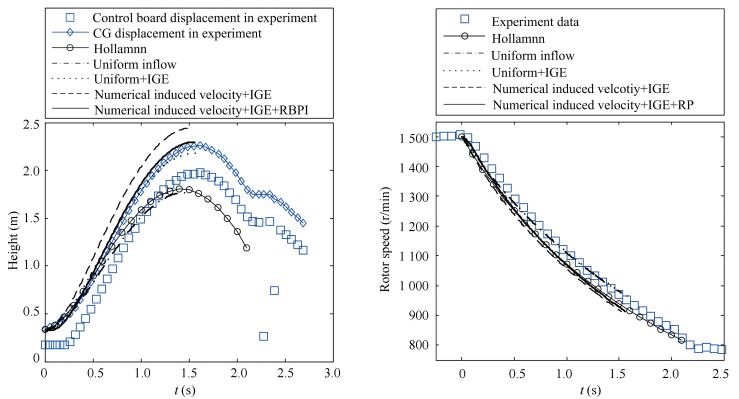
3.3 Validity and Error of ModelTo evaluate the model precision, the height and rotor r/min are compared with the experiment data, Hollmann and three other simplified models results. The sequence numbers and markers of these models are listed in the Table 2.
The history of jump takeoff height and rpm obtained by models above are displayed in Fig. 5. In the height history figure, the control board displacement recorded by the ultrasonic transducer is the original test data, whose symbol is square. There are two wrong data points existing clearly in the control board displacement plot. The gyroplane CG displacement symbolized by diamond is calculated by the test data for easy comparison with the simulation results of all models above. The wrong data points are replaced by interpolation of adjacent points.
|
Figure 5 The height and r/min comparison among these models and experiment |
In Fig. 5, models 2, 3 and ☆ agree well with experiment data. Especially the proposed model ☆ presents the best agreement. It is shown that the ground effect on the jump takeoff performance is huge while the RBPI has little effect on it. The results of model 1 are close to Hollmann method, which means that the induced velocity over the disk in the Hollmann model is defined as uniform distribution. The impact of all the other factors like the ground and RBPI is definitely included in the Hollmann experienced factor.
The maximum jump takeoff height error is defined as:
| $ MHE = \frac{{\max \left( {{h_m}} \right) - \max \left( {{h_e}} \right)}}{{\max \left( {{h_e}} \right)}} \times 100\% $ |
Some statistics of the mean square errors (MSE) of the jump takeoff height history between models or between each model and the experiment and the deviations (MHE) between their maximum jump takeoff heights are used to evaluate the computational precision of the each model. For ease of comparison between the maximum jump takeoff height errors (MHE), the PMSE is defined by the proportion of the MSE in the maximum experiment heights, although it is not a strict definition for a time average error. The differences between the MSE and MHE can be used to estimate the significance of the ground, the RBPI and the induced velocity. The statistics data is listed in Table 3, and the improvements of three factors on the maximum height of jump takeoff are calculated based on Table 3(as shown in Table 4).
| Table 3 The MSE or PMSE and MHE between models, or between each model and the experiment |
| Table 4 The improvement of three factors on the maximum height of jump takeoff |
The huge difference between the Hollmann model and experiment is caused by the ground effect. The simple torque coefficient in the Hollmann model makes the MSE be 0.061 m higher than the model 1.
The MSE between the model 1 and model 2 is nearly 5 times of that between the Hollmann model and model 1. The MSE between the model 1 and experiment is 0.423 m and the PSME between them is 21.44%. The MHE between them is 27.71%, which is the largest difference in the table. It indicates that ground effect on jump takeoff performance of a small scale platform is the biggest among all the factors.
It is an unreasonable conclusion because of blind area that PMSE between the model ☆ and experiment is larger than that between the model 3 and experiment. The former percentage of MSE should be smaller than the latter one. But the correct record of the experiment data in the early stage of jump takeoff could not be gotten because of the blind area of ultrasonic sensor.
In Table 4, the MHE of the model ☆ is 3.18% lower than that of the model 3. In the early stage of the RBPI, the blades pitch is so small that the thrust of the rotor is little. The sum of the thrust in the early time steps is an extremely small part of the thrust overshoot of the RBPI, and finally the MHE of the model ☆ is smaller than that of the model 3.
Numerical induced velocity does improve the maximum jump takeoff height in comparison with the uniform inflow in the Hollmann model and model 1. The increased percentage is 7.61% of the maximum experiment height, which is a bigger improvement than the RBPI.
Through making a conclusion of the MSE (PSME) or MHE statistics, it is found that the ground effect on the jump takeoff performance is the most powerful, the rapid pitch benefit is the least because of an extremely short jump takeoff time, and the induced velocity has played a second important role.
4 Results and DiscussionSince the proposed model is suitable for gyroplane jump takeoff performance prediction, aerodynamic characteristics of the rotor in jump takeoff based on the model are analyzed in this section, which concerns the blade tip loss distribution and the effect of the ground and RBPI on the thrust and induced velocity of the rotor in jump takeoff.
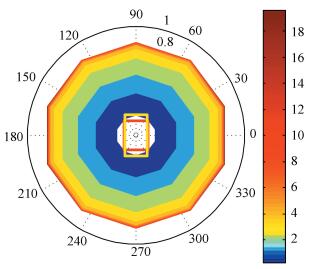
The lift and drag coefficient and the fuselage drag are focused before aerodynamic analysis. The lift and drag coefficient of the small scale platform operating in a low Re interval 1.5×10⁵~5×10⁵ are obtained from a look-up table exported from Xfoil. The lift coefficient is modified by an experienced factor 0.91 for the finite aspect ratio 20.34 of the platform rotor. They are given in According to the Figs. 2, 3 and 4, the drag coefficient of the 2-D fuselage cross section of the small scale jump takeoff platform is CDv=1.0. An exact induced velocity distribution below the rotor disk is tried to get from the proposed model and the fuselage drag has been calculated by integration of the induced velocity. A red rectangle is the fuselage plan view and another yellow one is the control board plan view in the middle of Fig. 7. The red square is much smaller than the cutout area of the rotor disk like and the yellow one just gets a little overlap in the blade root area with the rotor disk. So the fuselage drag distribution is the contour in Fig. 7.
|
Figure 6 The lift and drag coefficient of the 2D airfoil at different Reynolds number |
|
Figure 7 The drag distribution below the rotor disk at t=0.3 s, the red rectangle is the fuselage plan view and the yellow one is the control board plan view |
4.1 Ground Effect
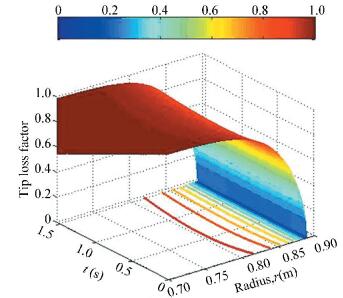
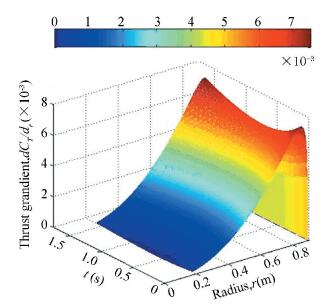
The cutoff radius of the rotor is 0.2R and the blade root loss is neglected. The histories of a tip loss function and span variation of the local lift coefficient are displayed in Figs. 7 and 8. According to Eqs.(8)-(9), the local tip loss factor is a function of radius and induced velocity which is proportional to the ratio of the local resultant velocity and radius, (V+vi)/r.
|
Figure 8 The Prandtl tip loss function versus radial position |
As shown in Fig. 8, if only the ground effect is under consideration, at the jump takeoff time t=0.65 s, the beginning point of the blade tip loss is stretching inward to a radial position r=0.805 m, namely a normalized radius 0.9R, where the tip loss factor is 0.9. While the local blade thrust gradient in Fig. 8 is reduced to the minimum 0.006 4. If the effect of the RBPI on the distribution of the blade tip loss and local thrust is added, the distribution law is similar with not being considered and the little difference between them is difficult to see in Figs. 8 and 9. So they are omitted.
|
Figure 9 The spanwise variation of blade thrust using Prandtl for the experimental rotortip loss function for the experimental rotor |
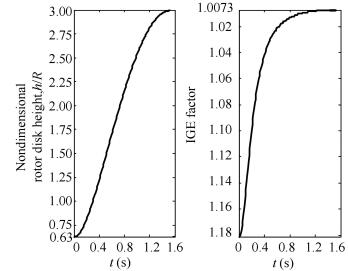
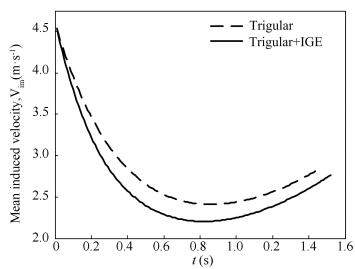
The ratio between the rotor disk height and radius of the rotor is defined as a non-dimensional height of rotor disk in jump takeoff. The non-dimensional height and ground effect factor histories are shown in Fig. 10. Comparing the y-axis parameters of both curves, it is clear that the rotor is always locating in ground effect from beginning to end of jump takeoff. Even if the non-dimensional rotor height is bigger than 2R in the end of flight, ground effect still exists. Then a history of the mean induced velocity of the rotor disk is shown in Fig. 11. When the ground effect is considered in the proposed model, the induced velocity is getting smaller while jump takeoff time becomes longer. The induced velocity gap between both curves in Fig. 11 is growing first and decaying second, and reaching a biggest gap at t=0.65 s.
|
Figure 10 The history of the ground effect factor in jump |
|
Figure 11 The mean induced velocity history at zero time of takeoffjump takeoff |
4.2 Rapid Blade-Pitch Increase
The thrust coefficient of the rotor, the ratio of the thrust coefficient between with and without the RBPI, the mean induced velocity, and the ratio of the mean induced velocity between with and without the RBPI are defined as:
| $ \begin{array}{*{20}{c}} {{C_T} = \frac{T}{{\rho A{\Omega ^2}{R^2}}},{R_{{C_T}}} = \frac{{C_T^{RP}}}{{C_T^{IGE}}}}\\ {{v_{im}} = \frac{1}{{{r_2} - {r_1}}}\int_{{r_1}}^{{r_2}} {{v_i}{\rm{d}}r} ,{R_{{v_{im}}}} = \frac{{V_{im}^{RP}}}{{V_{im}^{IGE}}}} \end{array} $ |
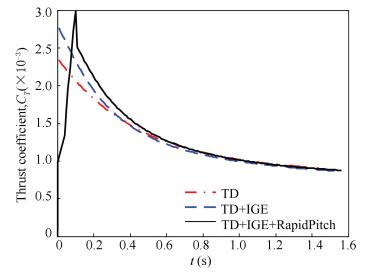
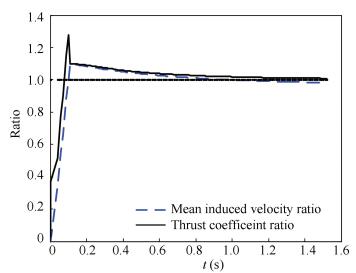
The RBPI is acting on the initial stage of jump takeoff, so the pitch angle rate of blades is 60 °/s. The rapid pitch maneuver brings aerodynamic benefit because the apparent additional mass is accelerated. As shown in Fig. 12, when the RBPI is not included, the maximum thrust coefficient 0.002 755 appears at zero. When considering the RBPI, the peak value of the thrust coefficient is 0.002 98. At first, in the first few time steps, the pitch angle of blades is small and little thrust of the rotor can be observed. Then, the thrust coefficient rises abruptly until the peak at t=0.10 s. The increasing line slope of the thrust coefficient is 0.0283/s. The overshoot of the maximum thrust coefficient of the rotor is 8.167% with the RBPI. Finally, a sharper reduction than the thrust coefficient without the RBPI is coming into being the next time step. The sharp point of the maximum thrust coefficient appears because the RBPI effect is removed hastily in the numerical solution.
|
Figure 12 The thrust coefficient history of the experimental rotor in jump takeoff |
As shown in Fig. 13, the mean induced velocity ratio reaches the maximum 1.278 3 at t=0.10 s and is larger than 1 until t=0.99 s, and then steps across 1. It means that the benefit of the RBPI lasts a relative long time to the time range of jump takeoff. The ratio of the mean induced velocity is nearly linear with a slope of 9.4125/s. The thrust coefficient ratio reaches the maximum 1.097 8 at t=0.12 s. A peak of the induced velocity lags two time steps behind that of the thrust coefficient. The ratio of the mean induced velocity is nearly linear with a slope of 12.78/s.
|
Figure 13 The thrust coefficient and mean induced velocity ratio history of the rotor in jump takeoff |
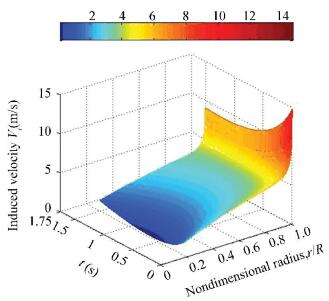
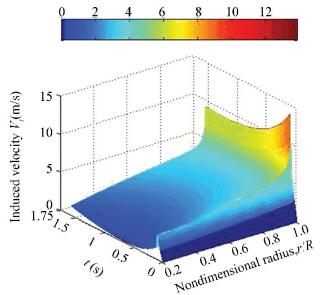
At last, the induced velocity mesh figures considering the unsteady ground effect and that considering the effect of the unsteady ground and RBPI are shown in Figs. 14 and 15. If the figure of the induced velocity mesh without both of these above factors is given out, it must be in the shadow of Figs. 14 and 15 and their shape is similar.
|
Figure 14 The induced velocity history considering the effect of the unsteady ground |
|
Figure 15 The induced velocity history considering the effect of the unsteady ground and RBPI |
5 Conclusions
A time-dependent and nonlinear gyroplane dynamics model considering the unsteady ground effect and the rapid blade-pitch increase in jump takeoff agrees very well with the experiment data obtained from a small scale jump takeoff platform. The MSE (PSME) or MHE statistics provides a kind of evaluation method for importance of the ground effect, the RBPI, and the induced velocity on jump takeoff performance. In the gyroplane design, the proposed model could be used for performance prediction. When a fast prediction is needed, the RBPI effect could be neglected because it has little impact on jump performance. The ground effect greatly enhances the rotor thrust and reduces the disk induced velocity, while the RBPI effect makes them overshoot and changes the distribution shape of them in the first few time steps.References
| [1] |
Leishman J G. Development of the autogiro: A technical perspective.
Journal of Aircraft, 2004, 41(4): 765-781.
DOI:10.2514/1.1205 ( 0) 0)
|
| [2] |
Carpenter P J, Fridovich B. Effect of a rapid Blade-Pitch increase on the thrust and induced-velocity response of a full-scale helicopter rotor. NACA TN-3044, 1953. paper no. 19930083686.
( 0) 0)
|
| [3] |
Wheatley J B, Bioletti C. Analysis and Model Tests of an Autogiro Take-off. NACA TN 582, 1936.
( 0) 0)
|
| [4] |
Prewitt R H. Possibilities of the jump-off autogiro.
Journal of the Aeronautical Sciences, 1938, 6(1): 10-14.
DOI:10.2514/8.741 ( 0) 0)
|
| [5] |
Hafner R. The Domain of the Convertible Rotor.
Journal of Aircraft, 1964, 1(6): 350-359.
DOI:10.2514/3.43606 ( 0) 0)
|
| [6] |
Bhagwat M J, Leishman J G. Rotor aerodynamics during maneuvering flight using a time-accurate free-vortex wake.
Journal of the American Helicopter Society, 2003, 48(3): 143-158.
DOI:10.4050/JAHS.48.143 ( 0) 0)
|
| [7] |
Martin Hollman, Eric Hollmann.
Modern Gyroplane Design. California: Aircraft Designs, Inc., 2007: 93-97.
( 0) 0)
|
| [8] |
Houston S S. Identification of autogyro longitudinal stability and control characteristics.
Journal of Guidance, Control, and Dynamics, 1998, 21(3): 391-399.
DOI:10.2514/2.4271 ( 0) 0)
|
| [9] |
Houston S S. Validation of a rotorcraft mathematical model for autogiro simulation.
Journal of Aircraft, 2000, 37(3): 203-209.
( 0) 0)
|
| [10] |
Thomson D G, Houston S S.
Advances in understanding autogyro flight dynamics. The 64th American Helicopter Society Annual Forum. Montreal. Canada: American Helicopter Society International, Inc., 2008.
( 0) 0)
|
| [11] |
Murakami Y, Houston S S. Dynamic inflow modelling for autorotating rotors.
Aeronautical Journal, 2008, 112(1127): 47-53.
DOI:10.1017/S0001924000001986 ( 0) 0)
|
| [12] |
Murakami Y, Houston S S. Correction of the definition of mass flow parameter in dynamic inflow modelling. Proceedings of the Institution of Mechanical Engineers.
Part G: Journal of Aerospace Engineering, 2009, 223(7): 1037-1040.
DOI:10.1243/09544100JAERO604 ( 0) 0)
|
| [13] |
Chen X, Agarwal R K. Inclusion of a simple dynamic inflow model in the blade element momentum theory for wind turbine application. ASME 2014 Power Conference, Baltimore, 2014. paper No. Power2014-32292. DOI: 10.1115/POWER2014-32292.
( 0) 0)
|
| [14] |
Zhu Qinghua, Li Jianbo. Study on aerodynamic characteristics of autorotating rotor and jump takeoff performance of gyroplane.
Acta Aerodynamics Sinica, 2008, 1(3): 282-286.
( 0) 0)
|
| [15] |
Munk M M. Some Tables of the Factor of Apparent Additional Mass. NACA TN 197, 1924.
( 0) 0)
|
| [16] |
Leishman J G.
Principles of Helicopter Aerodynamics. New York: Cambridge Univ. Press, 2000: 117-119.
( 0) 0)
|
| [17] |
Gustafson F B, Gessow A. Effect of Rotor Tip Speed on Helicopter Hovering Performance and Maximum Forward Speed.
NACA ARR L6A16, 1946.
( 0) 0)
|
| [18] |
Stepniewski W Z, Keys C N. Rotary wing Aerodynamics. NASA CR 3083-V. 2 C. 1, 1979.
( 0) 0)
|
 2017, Vol. 24


