2. Graduate University of Chinese Academy of Sciences, Beijing 100039, China
The Thirty Meter Telescope (TMT) is one of the largest telescopes in this world. This project is developed by America, Canada, Japan, India and China. Changchun Institute of Optics, Fine Mechanics and Physics, Chinese Academy of Sciences takes charge of the tertiary mirror, noted as the Giant Steerable Science Mirror (GSSM). The tertiary mirror is a unique four-meter flat mirror being able to do pointing. The 3.594 m×2.576 m flat mirror will direct the light beam collected from the main optical system to the instruments on the Nasmyth platform during the telescope is tracing[1-3].
The beam is so long that any tiny jitter at the front of the beam will grow to large swing at the focus plan. The instability of the beam can be divided into two levels: one is the miss pointing of the GSSM, which can be calibrated by control system in open or close loop; the other one is the jitter, which is always introduced by mechanical vibration. The first level is concerned by the control system team. And the second level will be carefully concerned in this paper, because the mechanical vibration plays an important role on the optical degradation.
The optical degradation will be better presented in the frequency domain, for the excitations are always limited to a certain range of frequency. The traditional frequency domain evaluation metric for the optical degradation based on the optical transfer function is the Strehl ratio and CIR(Central Intensity Ratio, CIR). The Strehl ratio is popular in the evaluation for the system with small aberration in space telescope or adaptive optic system. For the case of the mechanical vibration, the degradation of the optical performance may vary form a small one to a serious one. So the Strehl ratio may be too small to specify the character of the system. At the other hand, the CIR is convenience to evaluate the system under seeing. It presents the performance compared with the ideal seeing limited telescope. However, both the Strehl ratio and the CIR only use the center part of the optical transfer function.
The Normalized point Source Sensitivity (PSSn) is a new matric firstly used by the Thirty Meter Telescope project. Benefiting from the comprehensive evaluation in all frequency-rang and powerful multiplication property, the system engineers can easily evaluate the degradation introduced by the mechanical vibration[4-7].
The influence of the mechanical vibration can be linked with the optical transfer function. The perfect flat mirror will transfer one point source to another one. When the vibration is loaded to the mirror, the point object will be blurred. This image degradation can be expressed in the form of optical transfer function[8-10].
In this paper, two kinds of method are investigated to specify the influence on the GSSM. One is for the internal vibration such as the torque ripple excited by bearing, motor and the additional motion involved by the cable wrap; another is for the wind load which is presented by spectrum. All the image degradation is specified by PSSn. By this paper, the system engineer can predict the performance of GSSM under vibration inside and outside. Then, the look up table will be built to locate the PSSn.
2 The PSSn as the Specification of Optical Degradation 2.1 Definition of the PSSnFor the Strehl ratio S, it concerns the height of the Point Separation Function (PSF). If the height is as good as the one at the diffraction limit, the ratio will be one. When the image degrades, the actual PSF comes 'fat'. So the ratio will be lower than one.
It is shown in Eq.(1). Using the Fourier transform, the PSF can be expressed by the integration of the Optical Transfer Function (OTF).
| $ S = \frac{{PS{F_{{\rm{tele}}}}\left( 0 \right)}}{{PS{F_{{\rm{diff}}}}\left( 0 \right)}} = \frac{{\int {OT{F_{{\rm{tele}}}}} }}{{\int {OT{F_{{\rm{diff}}}}} }} $ | (1) |
where PSFtele(0) is the center of Point Separation Function of the telescope. PSFdiff(0) is the center of Point Separation Function of the telescope at the diffraction limit. OTFtele is the Optical Transfer Function of the telescope. OTFdiff is the Optical Transfer Function of the telescope at the diffraction limit
However, the used information is only the center part of the PSF.Compared with the Eq.(1), the Thirty Meter Telescope project integrates the PSF' s normal at the whole frequency domain and normalized it by the background. The definition is shown in Eq.(2)[2]:
| $ \begin{array}{l} PSSn = \frac{{\int {{{\left| {PS{F_{{\rm{tele + atmo + error}}}}\left( {\vec \theta } \right)} \right|}^2}} }}{{\int {{{\left| {PS{F_{{\rm{tele + atmo}}}}\left( {\vec \theta } \right)} \right|}^2}} }} = \\ \frac{{\int {{{\left| {PS{F_{{\rm{error}}}}\left( {\vec \theta } \right)} \right|}^2}} \int {{{\left| {PS{F_{{\rm{tele + atmo}}}}\left( {\vec \theta } \right)} \right|}^2}} }}{{\int {{{\left| {PS{F_{{\rm{tele + atmo}}}}\left( {\vec \theta } \right)} \right|}^2}} }} \end{array} $ | (2) |
where PSFtele+atmo+error(
In the following part of this section, the character of the PSSn will be presented by the SIN function.
To simplify the presentation, we denote the average function of the background, as is shown by formula:
| $ \left\langle \cdot \right\rangle = \frac{{\int {\left( \cdot \right){{\left| {PS{F_{{\rm{tele + atmo}}}}\left( {\vec \theta } \right)} \right|}^2}} }}{{\int {{{\left| {PS{F_{{\rm{tele + atmo}}}}\left( {\vec \theta } \right)} \right|}^2}} }} $ |
So the PSSn can be expressed by Eq.(3)[2],
| $ PSSn = \left\langle {{{\left| {PS{F_{{\rm{error}}}}\left( {\vec \theta } \right)} \right|}^2}} \right\rangle = \left\langle {{{\left| {OT{F_{{\rm{error}}}}\left( {\lambda \vec f} \right)} \right|}^2}} \right\rangle $ | (3) |
The wave-front can be expressed by the form of Sin function. This procedure is very similar to the Zernike fitting. As a function of fitting order, the computational cost comes to dramatically big at high orders ( > 30). For the Sin function, the characteristic frequency can be chosen easily. The wave-front in the form of sin function is shown in the following formula,
| $ w\left( x \right) = A\sin \left( {2{\rm{\pi }}{f_x}x} \right) $ |
where fx is the domain frequency of the wave front; x is the location at the wave front.
Here we denote the structure function of the wave-front. It is shown in the following formula. The structure function
| $ {D_\phi }\left( {\vec r,\lambda \vec f} \right) = \left\langle {{{\left[ {\phi \left( {\vec r} \right) - \phi \left( {\vec r + \lambda \vec f} \right)} \right]}^2}} \right\rangle $ |
where
After denoting the wave-front structure function, we can achieve the optical transfer function in statistics as shown in Eq.(4). Benefited by this formula, the system engineers are enabled to analyze the wave-front without considering the concrete telescope type.
| $ OT{F_e} = \exp \left( { - \frac{1}{2}{k^2}D\left( {\lambda \vec f} \right)} \right) \approx 1 - \frac{1}{2}{k^2}D\left( {\lambda f} \right) $ | (4) |
where D(λf) is the structure function, and k is the wave number; λ is the wave length; f is the circle frequency.
The structure function of the SIN formed wave-front is shown in Eq.(5). The formula can help understanding and characterizing the relationship between the wave-front and PSSn:
| $ \begin{array}{l} \int_{ - \frac{1}{{2{f_x}}}}^{\frac{1}{{2{f_x}}}} {{{\left[ {A\sin \left( {2{\rm{\pi }}{f_x}x + \phi } \right) - A\sin \left( {2{\rm{\pi }}{f_x}\left( {x + \lambda f} \right) + \phi } \right)} \right]}^2}{\rm{d}}x = } \\ \;\;\;\;\;\;\;\int_{ - \frac{1}{{2{f_x}}}}^{\frac{1}{{2{f_x}}}} {{{\left[ {2A\cos \left( {2{\rm{\pi }}{f_x}x + {\rm{\pi }}{f_x}\lambda f + \phi } \right)\sin \left( {{\rm{\pi }}{f_x}\lambda f} \right)} \right]}^2}{\rm{d}}x = } \\ \;\;\;\;\;\;\;2{A^2}{\sin ^2}\left( {{\rm{\pi }}{f_x}\lambda f} \right) \end{array} $ | (5) |
where A is the amplitude of the sin wavefront, fx is the domain frequency of the wave front, λ is the wave length. f is the circle frequency.
Using Eq.(3), PSSn under certain background can be achieved,
| $ \begin{array}{l} PSSn = \left\langle {{{\left| {OT{F_{{\rm{error}}}}\left( {\lambda \vec f} \right)} \right|}^2}} \right\rangle = \\ \;\;\;\;\;\;\;\;\;\;\;\left\langle {{{\left| {1 - \frac{1}{2}{k^2}D\left( {\lambda f} \right)} \right|}^2}} \right\rangle = \\ \;\;\;\;\;\;\;\;\;\;\;\left\langle {{{\left| {1 - \frac{1}{2}{k^2}2{A^2}{{\sin }^2}\left( {{\rm{\pi }}{f_x}\lambda f} \right)} \right|}^2}} \right\rangle = \\ \;\;\;\;\;\;\;\;\;\;\;1 - 2{\left( {{\rm{\pi }}k\lambda A} \right)^2}f_x^2\left\langle {{f^2}} \right\rangle \end{array} $ | (6) |
Eq.(6) helps the system engineers estimate the PSSn in various cases. The first thing is that, the PSSn approximately follows the second orders law with characterized frequency. This makes the higher fervency disturbance will influence more on the image quality. The second thing is the RMS of the wave-front is also directly related to the PSSn. At the same time, background average time indicates that the PSSn is the evaluation metric fully considering the seeing condition and concrete telescope aberration.
The other convenient of using PSSn as the matric of error budget is its combination character. The total error can be expressed as the multiplication of the error source using the following relationship:
| $ PSS{n_m} = \prod {PSS{n_i}} $ |
Here the moment of the motion is introduced to achieve the optical transfer function OTF at any type of mechanical vibration load[9-11].
| $ OTF\left( \omega \right) = \int {LSF\left( s \right){e^{ - {\rm{j}}\omega s}}{\rm{d}}s} $ |
where ω is the circle frequency; s is the location at the image plane.
The transfer function can be expressed as the Tylor series.
| $ \begin{array}{*{20}{c}} {OTF = \sum\limits_{n = 0}^\infty {\frac{1}{{n!}}\frac{{{\partial ^n}OTF}}{{\partial {\omega ^n}}}\left| {_{\omega = 0}{\omega ^n}} \right.} }\\ {\frac{{{\partial ^n}OTF}}{{\partial {\omega ^n}}}\left| {_{\omega = 0}} \right. = \frac{{{\partial ^n}}}{{\partial {\omega ^n}}}\int {LSF\left( s \right){e^{ - {\rm{j}}\omega s}}{\rm{d}}s} \left| {_{\omega = 0}} \right. = }\\ {{{\left( { - j} \right)}^n}\int {{s^n}LSF\left( s \right){\rm{d}}s} } \end{array} $ | (7) |
where LSF is the line spread function; ω is the circle frequency; s is the location at the image plane.
As is known, the Line Separation Function (LSF) is a kind of probability density. So the optical transfer function can be expressed as following formula:
| $ OTF\sum\limits_{n = 0}^\infty {\frac{{{m_n}}}{{n!}}{{\left( { - {\rm{j}}\omega } \right)}^n}} $ |
where the moment of the motion, mn is expressed as following relationship:
| $ {m_n} = \frac{1}{{{t_e}}}\int_{{t_0}}^{{t_0} + {t_e}} {{x^n}\left( t \right){\rm{d}}t} $ |
When the GSSM is under the presence of wind, the load can be changing all the time. So the statistics method shall be used. We approximate the statistics parameters do not change with time. The performance under unregularly load such as wind can be specified in the form of spectrum.
The Optical Transfer Function under Sin formed load can be achieved by the following relationship (8).
| $ OTF = {J_0}\left( {D\mathit{\Omega }} \right) $ | (8) |
where J0(·) is the zero order Bessel Function; D the amplitude of the sin is formed excitation; Ω is the frequency.
The multiplication property of the optical transfer function can be expressed as following:
| $ OT{F_c} = \prod {OT{F_i}} = \prod {{J_0}\left( {{D_i}\mathit{\Omega }} \right)} $ |
Considering the energy is of the same account between the Sin function and a piece of PSD. Then D can be achieved:
| $ D_i^2\left( {{\omega _i}} \right)/2 = PSD\left( {{\omega _i}} \right){\rm{d}}\omega $ |
So the optical Transfer Function can be achieved and the PSSn based on the spectrum can be expressed by the following Eq.(9):
| $ PSSn = \left\langle {{{\left| {OT{F_e}\left( {\lambda \vec f} \right)} \right|}^2}} \right\rangle = \frac{{\int {{{\left| {\prod\limits_{i = 0}^{{N_{PSD}}} {{J_0}\left( {\sqrt {2\left( {{\omega _{i + 1}} - {\omega _i}} \right)\frac{{PSD\left( {{\omega _{i + 1}}} \right) + PSD\left( {{\omega _{i + 1}}} \right)}}{2}} \mathit{\Omega }} \right)} } \right|}^2}\int {{{\left| {PS{F_{{\rm{tele + atmo}}}}\left( {\lambda \vec f} \right)} \right|}^2}} } }}{{\int {{{\left| {PS{F_{{\rm{tele + atmo}}}}\left( {\lambda \vec f} \right)} \right|}^2}} }} $ | (9) |
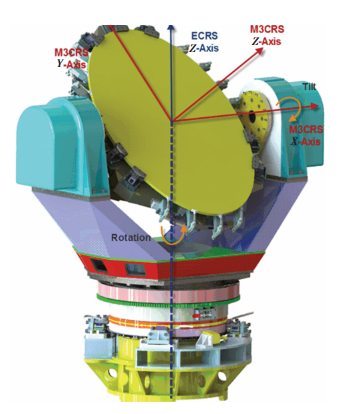
The coordinate system in Fig. 1 shows the motions in the tertiary mirror system. The motions include the angle division in the ECRS-Z, M3CRS-X and M3CRS Z-translation (ZM3).
|
Figure 1 GSSM mirror & the position assembling and coordinates of the TMT M3 |
All the jitter error is finally evaluated in these three directions. The jitter is the motion of the image, so the vibration is projected to the ECRS-Z, M3CRS-X and M3CRS Z axis[12-15].
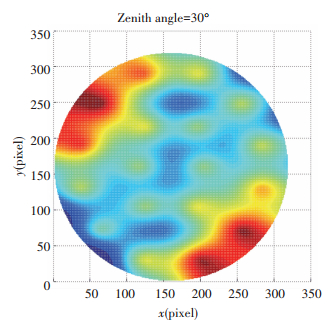
The simulated mirror figure of GSSM can be achieved by the FEA model. The interval of the grid is interpolated in to 1mm as id required by the TMT. The calculation at 30° zenith angle is suggested for at this certain position, and the GSSM will point to the Alignment and Phasing System (APS) where the low order aberration can be adjusted[14, 16-20]. At the APS the error condition shall be fully understanding, so the following simulation are all based on the mirror figure at 30° zenith angle as shown in Fig. 2.
|
Figure 2 The mirror figure of the GSSM @zenith angle=30° |
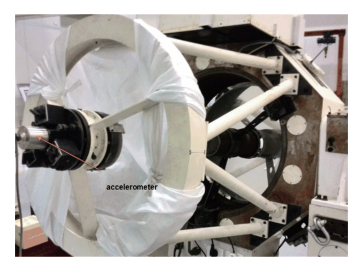
The analysis is concerned about the angle/displacement measurement, so we should integrate the acceleration signal to displacement signal. The allocation of the accelerometer is shown in Fig. 3.

|
Figure 3 Allocation and direction of the accelerometers |
We approximate the vibration is similar is a 1/4 scaled system. This can help the system engineers to understand and characterize the image degradation that will happened to the GSSM and decision whether it is necessary to find a way to limit it.
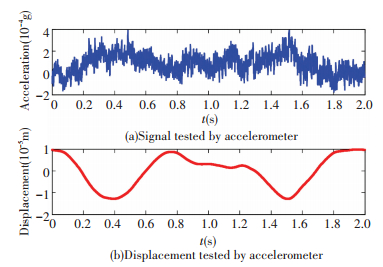
In this paper, the sensor used is the accelerometers. So the frequency integration is involved to achieve displacement signal from acceleration signal.
After obtaining the accelerometer signal, the integration must be operated. To think the thing qualitatively and speculatively, the signal can be summed up to form the displacement one. However, when the signal is processed like this, which is called time domain integration, inextricably the quadric trend term error will present.
| $ \iint {\cos \left( {{\omega _1}t} \right) + e} = - \frac{{\cos \left( {{\omega _1}t} \right)}}{{\omega _1^2}} + \frac{1}{2}e{t^2} + at + b $ |
where ω1 is the domain frequency of the signal; t is time; a, b and e are the error coefficient.
The tending terms can be removed by the polynomial fitting, but there are many problems which will be shown in Figs. 4-5.
|
Figure 4 The telescope under testing for mechanical vibration |
|
Figure 5 Signal of the accelerometers and the integrated displacement signal |
The integration is processed considering all the data, so the error will not be accumulated.
At the same time, the PSSn is closely linked to the seeing condition of the telescope. We approximate the relationship between r0 and zenith angle ξ can be presented by the following formula:
| $ {r_{0@\xi }} = {r_0}{\left( {\cos \left( \xi \right)} \right)^{\frac{3}{5}}} $ |
So the mirror figure under this vibration condition is shown in Fig. 6. The blur can be significantly told. To better specify the image quality degradation, the PSSn is used. We assume the telescope is under the seeing dominated condition. The optical transfer function is shown in the following formula. And the PSSn degrades from 0.996 to 0.994@r0=0.2 m.

|
Figure 6 GSSM mirror figure under internal vibration |
| $ OT{F_{{\rm{tele + atmo}}}} \approx OT{F_{{\rm{atmo}}}} = {e^{ - 3.44}}{\left( {\frac{{\lambda \vec f}}{{{r_{0@\xi }}}}} \right)^{5/3}} $ |
The GSSM is often presented to the dynamic load whose amplitude and phase neither follows a certain formula. But the statistics property almost does not change with time. So the wind load can be expressed by the form of spectrum,
| $ PS{D_{{\rm{wind}}}} = \frac{A}{{1 + {{\left( {\frac{f}{{{f_0}}}} \right)}^\gamma }}} $ |
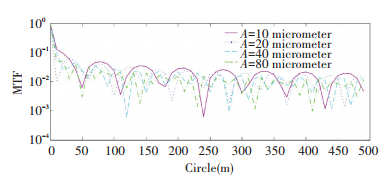
where A is the amplitude of the vibration; f0 is the knee frequency; γ is the degrade coefficient. Using Eq.(7), the Optical Transfer Function under different wind load condition is shown in Fig. 7. The stronger the wind load is, the more ripples appear in the Optical Transfer Function.
|
Figure 7 The MTF at different load power spectral density |
We take A=15, f0=20, γ=2 as an example, and we can see clearly the degradation of the wave-front. To consider this thing quantificationally, the PSSn is involved. We assume the telescope is under the seeing dominated condition and the PSSn degrades from 0.996 to 0.991@r0=0.2 m. The mirror figure is shown in Fig. 8.

|
Figure 8 GSSM mirror figure under wind vibration |
4 Conclusions
For the observation on ground based large telescopes without adaptive optical, the optical performance is dominated by many factors. Except the atmosphere turbulence, the motor ripple in the control system, the drag trains torque jitter, and cooling system noise will also cause optical blur of the optical system. The GSSM is equal to a traditional four meter scale telescope, but it is more sensitive to vibration due to its dramatic large radius-thickness ratio and unique function to guide the beam. So the two kinds of methods are investigated to specify the image quality of the wave front. The influence of the internal vibration can be expressed by the statistics moment and the wind load is specified by the spectrum method.
Benefit from this paper, the system engineers can estimate the performance of GSSM under various work conditions and decision whether the damping is satisfied and whether the isolation subsystem shall be involved to the GSSM.
| [1] |
Su Yanqin, Zhang Jingxu, Wang Fuguo, et al. Seismic analysis of TMT M3 cell assembly based on spectral response. Optics and Precision Engineering, 2014, 22(4): 996-1003. DOI:10.3788/OPE. ( 0) 0)
|
| [2] |
Angeli G Z, Seo Byoung-Joon, Nissly Carl, et al. A convenient telescope performance metric for imaging through turbulence. Proc. SPIE 8127, Optical Modeling and Performance Predictions V. Bellingham WA: SPIE, 2011. 812709-1-11. DOI: 10.1117/12.896919.
( 0) 0)
|
| [3] |
Seo Byoung-Joon, Nissly Carl, Troy Mitchell, et al. Estimation of normalized point-source sensitivity of segment surface specifications for extremely large telescopes. Applied Optics, 2013, 52(18): 4111-4122. DOI:10.1364/AO.52.004111 ( 0) 0)
|
| [4] |
Nissly Carl, Seo Byoung-Joon, Troy Mitchell, et al. High-resolution optical modeling of the thirty meter telescope for systematic performance trades. Proc. SPIE 7017, Modeling, Systems Engineering, and Project Management for Astronomy Ⅲ, 70170U. Bellingham WA: SPIE, 2008. 70170U. DOI: 10.1117/12.788596.
( 0) 0)
|
| [5] |
Wang Fuguo, An Qichang. Evaluation of mirror surface figures for TMT based on SlopeRms. Optics and Precision Engineering, 2014, 22(5): 1171-1175. DOI:10.3788/OPE. ( 0) 0)
|
| [6] |
Seo Byoung-Joon, Nissly Carl, Angeli George, et al. Analysis of normalized point source sensitivity as a performance metric for the thirty meter telescope. Proc. SPIE 7017, Modeling, Systems Engineering, and Project Management for Astronomy Ⅲ, 70170T. Bellingham WA: SPIE, 2008. 70170T. DOI: 10.1117/12.790453.
( 0) 0)
|
| [7] |
MacMartin D G, Thompson P, Colavita M M, et al. Dynamic analysis of the active-controlled segmented mirror of the Thirty Meter Telescope. IEEE Transactions on Control Systems Technology, 2013, 22(1): 58-68. DOI:10.1109/TCST.2013.2240456 ( 0) 0)
|
| [8] |
Cao Xiaotao, Sun Tianyu, Zhao Yunlong, et al. Current status and development tendency of image stabilization system of large aperture space telescope. Chinese Optics, 2014, 7(5): 739-748. DOI:10.3788/CO.20140705.0739 ( 0) 0)
|
| [9] |
Tang Zhaoxin, Huang Wei, Xu Weicai, et al. Application of differential pentaprism scanning in wavefront detection. Chinese Optics, 2014, 7(6): 1003-1011. DOI:10.3788/CO.20140706.1003 ( 0) 0)
|
| [10] |
Rudoler S, Hadar O, Fisher M, et al. Image resolution limits resulting from mechanical vibrations. Part 2: Experiment. Optical Engineering, 1991, 30(5): 577-589. DOI:10.1117/12.55843 ( 0) 0)
|
| [11] |
Kopeika N S, Wulich D. Image resolution limits resulting from mechanical vibrations. Proc. SPIE 0561, Airborne Reconnaissance IX, 4. Bellingham WA: SPIE, 1985, 561: 4-12. DOI: 10.1117/12.949624.
( 0) 0)
|
| [12] |
Barr L D, Fox J, Poczulp G A, et al. Seeing studies on a 1. 8-m mirror. Proc. SPIE 1236, Advanced Technology Optical Telescopes IV. Bellingham WA: SPIE, 1990, 1236: 492-506. DOI: 10.1117/12.19220.
( 0) 0)
|
| [13] |
Deng Yongting, Li Hongwen, Wang Jianli. Overview of AC servo control system for the large telescope. Chinese Optics, 2015, 8(6): 895-908. DOI:10.3788/CO.20150806.0895 ( 0) 0)
|
| [14] |
Smith D R, Avitabile P, Gwaltney G, et al. Wind-induced structural response of a large telescope. Proc. SPIE 5495, Astronomical Structures and Mechanisms Technology, 258. Bellingham WA: SPIE, 2004, 5495: 258-269. DOI: 10.1117/12.550465.
( 0) 0)
|
| [15] |
An Q C, Zhang J X, Yang F, et al. TMT tertiary mirror optical jitter model metrology. Journal of Harbin Institute of Technology(New Series), 2016, 23(6): 67-72. DOI:10.11916/j.issn.1005-9113.2016.06.010 ( 0) 0)
|
| [16] |
Wang Xianjun. Correction of angle measuring errors for large telescopes. Optics and Precision Engineering, 2015, 23(9): 2446-2451. DOI:10.3788/OPE.20152309.2446 ( 0) 0)
|
| [17] |
Ford V, Carter C, Delrez C. Jitter studies for the secondary and tertiary mirror systems on the thirty meter telescope. SPIE Advances in Optical and Mechanical Technologies for Telescopes and Instrumentation, 2014, 9151(2): 1-15. DOI:10.1117/12.2055036 ( 0) 0)
|
| [18] |
Cho M K, Stepp L M, Kim S. Wind buffeting effects on the Gemini 8-m primary mirrors. Proc. SPIE 4444, Optomechanical Design and Engineering 2001. Bellingham WA: SPIE, 2001, 444: 302-314. DOI: 10.1117/12.447310.
( 0) 0)
|
| [19] |
Yang Fei, Liu Guojun, Zhao Hongchao, et al. Stiffness allocation and analysis of TMT M3S. Optics and Precision Engineering, 2016, 24(1): 152-159. DOI:10.3788/OPE.20162401.0152 ( 0) 0)
|
| [20] |
Pazder J S, Vogiatzis K, Angeli G Z. Dome and mirror seeing estimates for the thirty meter telescope. Proc. SPIE 7017, Modeling, Systems Engineering, and Project Management for Astronomy Ⅲ. Bellingham WA: SPIE, 2008. 70170R. DOI: 10.1117/12.789636.
( 0) 0)
|
 2017, Vol. 24


