2. School of Electronic Engineering, Xi'an University of Posts and Telecommunications, Xi'An 710121, China
To a certain extent power consumption has become the most critical constraints in today's GPU's (Graphics Processing Unit's) design and programming. As GPUs are widely used in desktop computers, laptops, high-performance computers and mobile devices, GPU power consumption has therefore become a hot research topic. On one hand, an effective power efficient structure design is an important factor that can affect the survival of GPU chip; on the other hand, low power 3D rendering software techniques are also critical factor.
Previous research on 3D graphics rendering's performance and power consumption is often limited to a particular research area, such as load characteristics, power/energy consumption modeling or estimation, 3D graphics rendering performance and power consumption analysis from a software perspective and so on. Here we only recall the representative literature of the 3D graphics rendering research. These results are mainly from GPU users or programmers rather than GPU designers.
In Refs.[1-2], 3D static load and dynamic load characteristics are studied via simulation and experimental measurement. The research content includes a number of vertices contained in each primitive, the number of triangles to be processed per frame, the access bandwidth of the memory, and so on. In Ref.[3], the workload characteristics of 3D games are studied, including the average number of vertices, instructions used by the pixel shader, usage of different types of primitives, memory bandwidth, and the size of triangles, etc. In Ref.[4], a signature-based evaluation technique is proposed for 3D graphics load prediction. Their research showed that monitoring specific parameters in a 3D graphics rendering pipeline can provide better prediction accuracy than traditional methods. Signature-based predictions have higher computational efficiency. The fundamental difference between a signature-based predictor and a history-based predictor is that the former can capture both the previous results and the causes of the results, and use both to predict future results. Ref.[5] using Quake 3 and XRace games as benchmarks on three mainstream mobile SOC(system-on-chip) architecture were studied, research showed that the geometric processing stage is the main bottleneck of 3D mobile gaming performance, and confirm that the logic of the game significantly affects the energy consumption.
In Ref.[6], the influence of different factors on the power consumption in the mobile 3D graphics pipeline is analyzed quantitatively. These factors mainly include resolution, frame rate, level of detail, illumination and texture mapping. The power consumption evaluation model is built based on the analysis. In Ref.[7], a linear regression model was developed to estimate the power consumption of the target GPU. The model was based on the performance of the universal GPU and the power consumption measurement results. The average error of power consumption prediction is less than 4.7%. In Ref.[8], a mainstream GPU chip is analyzed and modeled by exploiting the inherent coupling among power consumption characteristics, run-time performance, and dynamic workloads. In Ref.[9] an accurate power model for on-line prediction of the instantaneous power of a GPU is proposed, which uses a performance counter in a relatively novel way to provide accurate power estimation at run-time, with the predicted average error of less than 6%. In Ref.[10], an empirical activity-based model is used to estimate the power consumption of a micro-architecture component on a GPU, with a predicted error of less than 10%. In Ref.[11], machine learning techniques were used to propose a GPU performance and power estimation model that is trained on a set of applications that are deployed in many different hardware configurations with a power prediction accuracy of 10%.
In Ref.[12], GPU power consumption was studied from the perspective of software and the use of GPU for general computing. In a GPU board, the location of the power consumption and the cause of the generation are determined by analyzing the relationship among the measured power consumption, operation time, and the cell type. The modules considered include the register file, the storage hierarchy, and the functional unit. The impact of image processing algorithms on GPU energy consumption was studied in Ref.[13].
Modern GPUs use either the separate shader architecture[14] or the unified shader architecture[15]. The bandwidth of the memory limits the performance of the unified shader architecture, while software implementation affects the load balancing of the separate shader architecture.
Low power 3D graphics hardware design technology has been widely studied, but there are few studies on low power GPU programming techniques. This paper studies low-power optimization techniques in 3D graphics rendering from both the designer and the programmer's view, and gives some programming techniques for reducing the rendering energy requirements. These techniques are derived from analysis and simulation results of hardware circuits of GPU. It should be noted that the low-power programming techniques proposed in this paper require some specialized hardware support and the expansion of 3D graphics commands. This also provides references for improving the hardware design of the GPU. In the next section, we present the generic 3D rendering pipeline used in our analysis as well as the graphics primitives used in modern graphics standards. In Section 3, the relationship between the vertex shader and pixel shader are derived. In Section 4, a set of programming techniques for reducing rendering power consumption is introduced. Simulation results are presented in Section 5. Section 6 gives a summary of our research and future improvements.
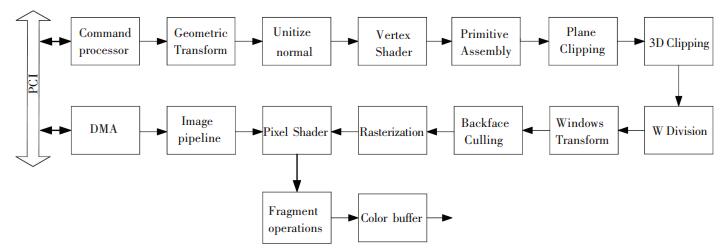
2 The 3D Rendering Pipeline 2.1 The 3D Rendering Pipeline StructureA traditional 3D graphics rendering pipeline consists of a number of computing tasks, as shown in Fig. 1, including command processor, geometric transformation, unitization of vertex normals, vertex shader, primitive assembly, plane clipping, 3D clipping and coordinate homogenization(W Division), window transformation, back-face culling, rasterization, pixel shader, fragment operations (such as alpha tests, depth tests, stencil tests, logic operations, etc.) and color buffer.
|
Fig.1 3D graphics rendering pipeline structure |
2.2 Graphics Primitives
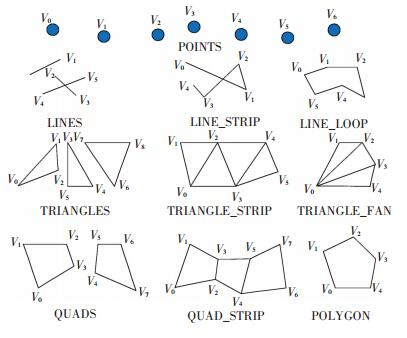
Fig. 2 shows the standard geometric primitives:points(POINTS), lines(including LINES, LINE_ STRIP and LINE_LOOP), triangles(including TRIANGLES, TRIANGLE_STRIP and TRIANGLE_ FAN), quadrilaterals (including QUADS and QUAD_STRIP) and polygons (POLYGON). Polygons are usually convex and triangulated before entering the rendering pipeline. Obviously, many methods can be found to draw the same primitives, but different methods will have different representations of efficiency and result in different computational costs, choosing the appropriate primitive format is very important in 3D graphics rendering. Table 1 shows the vertex counts and triangle counts of the graphic primitives.
|
Fig.2 Standard geometric primitives |
| Table 1 The vertex counts and triangle counts of graphic primitives |
In order to increase vertex sharing and reduce the bandwidth of memory, the 3D graphics APIs also use the vertex array and the index array. These arrays can be transferred to the GPU and stored in GPU memory for future use. The index array allows further vertex sharing to reduce the need for storage and the workload of the vertex shader. Consider, for example, a closed object such as a sphere, which is usually tessellated into many triangles. In this case, a vertex can be shared by up to 8 triangles. Vertex sharing not only reduces storage requirements, it also reduces vertex shading computation.
3 Shader Workload AnalysisAs for a pipeline, the throughput reaches peak when the sub-computation workloads are balanced with respect to their computation resources. Vertex shaders and pixel shaders often perform computationally intensive tasks that are implemented using programmable shaders, and their load balancing directly affects the performance of the entire rendering pipeline. Here the analytical relationship between the two shader's loads is derived by analysis.
Results When rendering a frame, let
(a) the number of TRIANGLES, TRIANGLE_STRIP, TRIANGLE_FAN, QUAD, QUAD_STRIP, POLYGON, rectangular mesh surface and triangular surface primitives be n1, n2, n3, n4, n5, n6, n7 and n8, respectively;
(b) the average number of triangles produced by TRIANGLES, TRIANGLE_STRIP, TRIANGLE_FAN, QUAD and QUAD_STRIP primitives be m1, m2, m3, m4 and m5, respectively;
(c) the average number of edges of a POLYGON primitive be e;
(d) the average dimension of a rectangular mesh surface primitive be u×v, and
(e) the average side dimension(the number of points on an edge) of triangular surface primitive be s.
In addition, let
(f) in the plane clipping stage, the percentage of clipped triangles be a1 and the average number of vertices produced by clipping a triangle be β1;
(g) in the frustum clipping stage, the percentage of clipped triangles be a2 and the average number of vertices produced by clipping a triangle be β2;
(h) in the face-back culling stage, the percentage of removed triangle faces be a3, and
(i) the average number of pixels contained in each triangle be λ.
Then, the average number NPIXEL of shaded pixels can be expressed as
| $ \begin{array}{l} {N_{{\rm PIXEL}}} = \lambda (1 - {\alpha _3})({\beta _2}{\alpha _2} - 3{\alpha _2} + 1)({\beta _1}{\alpha _1} - 3{\alpha _1}\\ \;\;\;\;\;\;\;\;\;\;\;\; + 1)[{n_6}\left( {e - 2} \right) + 2{n_7}\left( {u - 1} \right)\left( {v - 1} \right) + \\ \;\;\;\;\;\;\;\;\;\;\;\;\;{n_8}({s^2} - 2s + 1) + \mathop \sum \limits_{i = 1}^5 {m_i}{n_i}] \end{array} $ | (1) |
and the ratio between the number NPIXEL of shaded pixels and the number NVERT of shaded vertices can be expressed as
| $ \begin{array}{l} \frac{{{N_{{\rm{PIXEL}}}}}}{{{N_{{\rm{VERT}}}}}} = \lambda (1 - {\alpha _3})({\beta _2}{\alpha _2} - 3{\alpha _2} + 1)({\beta _1}{\alpha _1} - \\ \;\;\;\;\;\;\;\;\;\;\;\;\;3{\alpha _1} + 1)[{n_6}\left( {e - 2} \right) + 2{n_7}(u - 1)(v - \\ \;\;\;\;\;\;\;\;\;\;\;\;\;1) + {n_8}({s^2} - 2s + 1) + \mathop \sum \limits_{i = 1}^5 {m_i}{n_i}]/\\ \;\;\;\;\;\;\;\;\;\;\;\;\;(3{m_1}{n_1} + {m_2}{n_2} + 2{n_2} + {m_3}{n_3} + \\ \;\;\;\;\;\;\;\;\;\;\;\;\;2{n_3} + 2{m_4}{n_4} + {m_5}{n_5} + 2{n_5} + {n_6}e + \\ \;\;\;\;\;\;\;\;\;\;\;\;\;{n_7}uv + {n_8}s\left( {s - 1} \right)/2) \end{array} $ | (2) |
Proof From the basic conditions (a)-(c) can be deduced: the number of triangles generated by TRIANGLES, TRIANGLE_STRIP, TRIANGLE_ FAN, QUAD and QUAD_STRIP primitives are m1×n1, m2×n2, m3×n3, m4×n4 and m5×n5, respectively. The number of triangles generated by POLYGON primitive is (e-2) ×n6. We now consider condition (d) and (e). For a rectangular mesh surface primitive, the primitive consists of u×v vertices and 2(u-1)(v-1) triangles. For a triangular surface primitive, the primitive consists of s(s+1)/2 vertices and s2-2s+1 triangles.
From the above analysis, we can understand that the number of triangles generated by the primitives is NTRI.
| $ \begin{array}{l} {N_{{\rm{TRI}}}} = {m_1}{n_1} + {m_2}{n_2} + {m_3}{n_3} + {m_4}{n_4} + {m_5}{n_5} + \\ \;\;\;\;\;\;\;\;\;\;{n_6}\left( {e - 2} \right) + 2{n_7}\left( {u - 1} \right)\left( {v - 1} \right) + \\ \;\;\;\;\;\;\;\;\;\;{n_8}({s^2} - 2s + 1) \end{array} $ | (3) |
From Fig. 2 we can get:A TRIANGLES primitive consists of m triangles which has 3×m vertices. A TRIANGLE_STRIP contains m triangles with m+2 vertices. A TRIANGLE_FAN contains m triangles with m+2 vertices. A QUAD contains 2 triangles with 4 vertices, and m QUADs have 2m triangles. A QUAD_STRIP contains m QUADs with 2m+2 vertices. A convex POLYGON with m vertices can be decomposed into m-2 triangles.
From the above analysis, we can get the number of vertices generated by the primitives is NVERT.
| $ \begin{array}{l} {N_{{\rm{VERT}}}} = 3{m_1}{n_1} + ({m_2} + 2){n_2} + ({m_3} + 2){n_3} + \\ \;\;\;\;\;\;\;\;\;\;\;\;2{m_4}{n_4} + ({m_5} + 2){n_5} + {n_6}e + {n_7}uv + \\ \;\;\;\;\;\;\;\;\;\;\;\;{n_8}s\left( {s - 1} \right)/2 \end{array} $ | (4) |
Now, let's derive the number of triangles after plane clipping, frustum clipping and back-face culling, respectively. In the plane clipping stage, there are a1NTRI triangles are clipped. Since each clipped triangle generates β1(β1≥3) vertices, these vertices generate β1-2 triangles, so there are (β1-2)a1NTRI new triangles are generated. Thus the number of triangles after plane clipping will become NPC.
| $ \begin{array}{l} {N_{{\rm{PC}}}} = ({\beta _1} - 2){\alpha _1}{N_{{\rm{TRI}}}} + (1 - {\alpha _1}){N_{{\rm{TRI}}}} = [({\beta _1} - \\ \;\;\;\;\;\;\;\;\;2){\alpha _1} + (1 - {\alpha _1})]{N_{{\rm{TRI}}}} = ({\beta _1}{\alpha _1} - 3{\alpha _1} + \\ \;\;\;\;\;\;\;\;\;1){N_{{\rm{TRI}}}} \end{array} $ | (5) |
In the frustum clipping stage, there are a2NPC triangles are clipped. Since each clipped triangle generates β2(β2≥3) vertices, these vertices generate β2-2 triangles, so there are (β2-2)a2NPC new triangles are generated. Thus the number of triangles after frustum clipping will become NFC.
| $ \begin{array}{l} {N_{{\rm{FC}}}} = ({\beta _2} - 2){\alpha _2}{N_{{\rm{PC}}}} + (1 - {\alpha _2}){N_{{\rm{PC}}}} = [({\beta _2} - \\ \;\;\;\;\;\;\;\;\;2){\alpha _2} + (1 - {\alpha _2})]{N_{{\rm{PC}}}} = ({\beta _2}{\alpha _2} - 3{\alpha _2} + \\ \;\;\;\;\;\;\;\;\;1){N_{{\rm{PC}}}} \end{array} $ | (6) |
In the back-face culling stage, there are a3NFC triangles removed. So the number of triangles after back-face culling will become NBFC.
| $ \begin{array}{l} {N_{{\rm{BFC}}}} = (1 - {\alpha _3}){N_{{\rm{FC}}}} = (1 - {\alpha _3})({\beta _2}{\alpha _2} - 3{\alpha _2} + \\ \;\;\;\;\;\;\;\;\;\;\;1){N_{{\rm{PC}}}} = (1 - {\alpha _3})({\beta _2}{\alpha _2} - 3{\alpha _2} + 1)({\beta _1}{\alpha _1} - \\ \;\;\;\;\;\;\;\;\;\;\;3{\alpha _1} + 1){N_{{\rm{TRI}}}} \end{array} $ | (7) |
Let the average number of pixels included in each triangle be λ. The number of pixels that need to be shaded can be expressed as:
| $ \begin{array}{l} {N_{{\rm{PIXEL}}}} = \lambda {N_{{\rm{BFC}}}} = \lambda (1 - {\alpha _3})({\beta _2}{\alpha _2} - 3{\alpha _2} + \\ \;\;\;\;\;\;\;\;\;\;\;\;\;1)({\beta _1}{\alpha _1} - 3{\alpha _1} + 1){N_{{\rm{TRI}}}} \end{array} $ | (8) |
Substitute Eq.(3) into Eq.(8), we arrive at Eq.(1).
Divide Eq.(1) by Eq.(4), we arrive at Eq.(2).
The proof is completed.
4 Low Power Graphics Programming TechniquesA set of programming techniques for reducing rendering power consumption is presented in this section. The effects of these techniques are discussed in depth. We must point out that some of the techniques presented in this section need hardware support. Following are some important hardware supports needed to realize these techniques.
4.1 Improve the Ratio of Vertex SharingDifferent graphic primitives allow different ways of sharing vertices. Sharing vertices can significantly reduce the computational load and energy consumption of the vertex shading stage. Therefore, in an application, one needs to carefully select the rendering primitive to balance the load.
Define the vertex sharing ratio(SR) of a graphic primitive as the number of vertices required in the absence of vertex sharing divided by the number of vertices actually used in the primitive. In the case of QUAD_STRIP primitive, if a QUAD_STRIP contains 2n triangles, it requires 6n vertices in the absence of vertex sharing, and a QUAD_STRIP primitive containing 2n triangles actually requires only 2n+2 vertices. Its vertex sharing ratio can be defined as:
| $ S{R_{{\rm{QUAD}}}} = 6n/\left( {2 + 2n} \right) = 3n/\left( {1 + n} \right) $ | (9) |
As n increases, SRQUAD approaches 3.
When a vertex is shared by several triangles or lines, the vertex is only shaded once. Vertex sharing can significantly reduce the workload of the vertex shading stage, and SR is an important factor that affects the rendering complexity. The vertex sharing ratios of the common graphics primitives are given in Table 2.
| Table 2 Graphics primitives and their vertex sharing ratio |
For parametric surfaces, when the dimensions of a surface is sufficiently large, the SR of the surface approaches 6. Parametric surfaces have very good vertex sharing ratios and are highly recommended in graphics programming. In Ref.[16], the vertex shader and the pixel shader in the GPU traditional pipeline are modeled and analyzed in detail. From the analysis we can see that the energy consumption of the vertex shader is proportional to the number of vertices. Obviously, energy consumption is reduced when the number of vertices processed by this level is reduced. Thus the vertex sharing ratio is an important factor affecting rendering power consumption.
4.2 Clock GatingA special instruction HALT which generates a clock gating signal to gate the clock signal of the shader processor in order to save power consumption. This instruction signals the end of geometric processing of a vertex and halts the geometric shader. The shader can be awakened by other input triggers.
The wake-up of the clock is implemented using an asynchronous circuit. Restore the shader's normal clock when a new command is entered. Since the operating mode of the asynchronous circuit is ″event driven″, the circuit only works when needed, reducing many unnecessary flips, thus effectively reducing power consumption.
In the 3D graphics rendering process, some modules have lighter workloads with relative to other modules of the GPU. They complete their tasks faster than others. These tasks usually have short execution time and idle time and are not suitable for the use of power gating, which needs a longer time to shut down and restart the circuit. But these tasks are suitable for clock gating. Upon the completion of the basic task, the entire module can immediately stop the clock by using the HALT instruction. When a new task arrives, the event wakes up the module and the task starts immediately.
4.3 Static Target BufferingA BEGIN_OBJ command and an END_OBJ command that delineate the rendering of a particular geometric object (shape). Rendered image specified within this pair of commands will be kept in the object buffer for reuse. The image has a transparent background so that it can be composed with the frame buffer content.
When rendering a frame, some objects either remain steady or move very slowly.These static or slow moving objects do not have to be re-rendered every frame since this does not affect visual perception as much. They can be rendered once every few frames to save rendering energy, for example 10 frames per second instead of 30 frames per second. The rendered object can then be copied into frame buffer after the rendering of a frame is complete. Of course, a small amount of computation is needed to make sure that the object is not occluded in these frames.
An object that goes through only translational movement may be treated the same way as steady or slow moving objects since these objects do not change much in shape after rendering.
The use of BEGIN_OBJ and END_OBJ can assist the implementation of static target buffering, using the parameters STATIC_OBJ and the corresponding buffer name. Objects marked with these commands record their depth, movement speed, including square parameters during the rendering process to analyze whether the object is in a static, simple translation, or slow movement, and then decide whether to allocate the target cache for the objects.
4.4 LOD in Geometry ProcessingLOD (Levels of Detail) is a technique that improves the efficiency of a rendering algorithm by reducing the geometric complexity of the scene and reducing the load of the graphics pipeline (mainly the vertex shading phase) by simplifying the surface detail of the scene without affecting the visual effect of the picture. The effect of reduced model quality on the appearance of the object is almost negligible when the object is moving far or fast from the screen. At the time of implementation, several geometric models with different approximation precision are established for each original polyhedral model. Compared with the original model, each model retains a certain level of detail. When drawing, the appropriate LOD level is selected according to the depth value, and the LOD selection is changed only when the depth value changes by more than a certain value.
Although LOD technology is mainly used in the geometric processing stage, this technique is easily extended to the pixel shading phase, such as Mip-mapping technology used in texture mapping is actually a form of LOD technology, it can also provide a high rendering quality.
Using the associated command parameters, the previously mentioned BEGIN_OBJ and END_OBJ instructions can be used to support the implementation of LOD. During the rendering process of an object, the distance (depth) and movement speed of the entire object to the screen can be recorded, and these parameters can be used to guide the automatic selection of the LOD.
5 Experimentation and AnalysisWe conducted experiments on our own design of a graphics processor (Firefly1). The first experiments were performed on a prototype implemented using a Xilinx Virtex-7 XC7VX690T board. This implementation includes a front-end processor (Leon3), a separate shader graphics processer and an external DDR memory. It is able to run at a maximum of 150 MHz. This implementation was later fabricated using SMIC 0.13 μ m CMOS process and tested successfully. The chip contains about 100 million transistors, with a power consumption under 2 W. The chip runs at 200 MHz, and implements full OpenGL1.3. In addition, we have built a cycle accurate simulation and analysis platform for studying the performance of graphics processor. Our experiments are carried out in the above environment. The power consumption is evaluated by running simulations on the graphics processor chip and using the Synopsys power analysis tool Power Compiler.
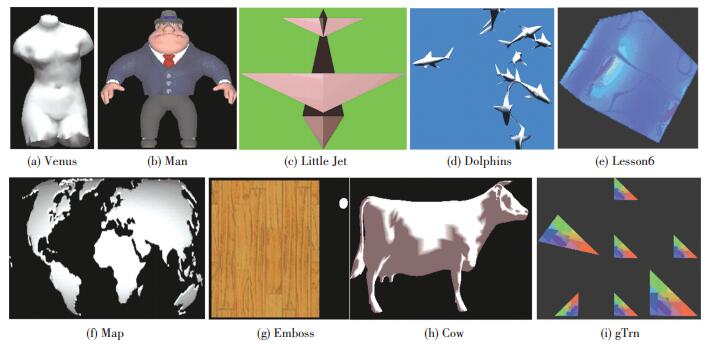
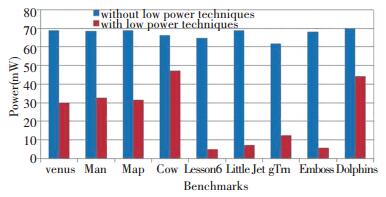
The nine examples used in this experiment is shown in Fig. 3. Among them, the program gTrn, Man, Map, Venus, Cow and Emboss are for static target testing, the program Little Jet, lesson6 and Dolphins are for dynamic target testing. Table 3 shows the number of pixels and the number of vertices in nine examples. The number of pixels and the number of vertices are obtained from the cycle-accurate performance simulation platform. The ratio of the pixel numbers and vertex numbers reflects the load of the vertex shader and the pixel shader. Fig. 4 shows the comparison of the power consumption results of the vertex shader. Fig. 5 shows the comparison of the power consumption of the pixel shader. As can be seen from the figure, in the absence of low-power technology, whether it is vertex shaders or pixel shaders, the power consumption that each test program consumes changes little. With low-power programming technology, the power consumption changes greatly, at this time the power consumption is mainly related to the workload of vertex shader and pixel shader.
|
Fig.3 Rendered scenes of the nine examples |
| Table 3 Vertex vs pixel ratio |
|
Fig.4 Vertex shader power consumption |

|
Fig.5 Pixel shader power consumption |
1) If the workload of the vertex shader and the pixel shader is balanced, such as the program Man, Map and Venus, the power consumption of the two shaders is reduced by almost the same amount. The reduced power consumption of the vertex shader was 52.69%, 54.07% and 56.31% respectively, and the reduced power consumption of pixel shader was 56.46%, 50.65% and 55.22% respectively.
2) If the vertex shader is a bottleneck, such as in Dolphins and Cow, the vertex shader reduces power consumption by 36.77% and 28.96%, respectively, while the pixel shader reduces power consumption by 64.37% and 59.75%.
3) If the pixel shader is the bottleneck, such as the program Little Jet, gTrn, and the textured example Lesson6, Emboss, the vertex shader power consumption is reduced greatly. The power consumption is reduced by 89.40%, 79.61%, 92.60% and 91.34%, respectively, while the pixel shader power consumption decreased by 10.97%, 12.14%, 13.16% and 17.16%, respectively. In these four test programs, the vertex shader has greatly reduced power consumption, while the pixel shader has less reduction in power consumption. This is mainly due to the fact that the workload on the pixel shader is very heavy (as can be seen from the ratio of the number of pixels and the number of vertices in Table 3), but the vertex shader has a lot of time in the idle state.
In the above nine examples, the average reduction in vertex shader power consumption was 64.6%, and the average reduction in pixel shader power was about 37.8%. The magnitude of the power reduction is mainly related to the workload of the two shaders. Fig. 6 shows the results of the energy consumption of the vertex shader, and Fig. 7 shows the energy consumption results of the pixel shader. The result of the energy consumption is obtained by multiplying the time(obtained by simulation) required to render a scene and the average power consumption of the shader. The average amplitude of the vertex shader energy consumption reduction is about 61.2%, and the average amplitude of the pixel shader energy consumption reduction is about 34.1%. The reason for the inconsistency in power consumption and energy consumption reduction is mainly due to the increased wake-up overhead and some additional computational overheads when using low-power technology, which leads to an increase in the time required to render a scene, resulting in further increased energy consumption.

|
Fig.6 Vertex shader energy consumption |
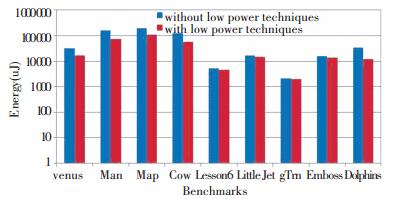
|
Fig.7 Pixel shader energy consumption |
6 Conclusion
Although low power 3D graphics hardware design has been extensively studied, low power software techniques have not been investigated as much. Based on the research of traditional 3D graphics rendering structure, this paper puts forward several low-power programming techniques suitable for 3D graphics rendering through theoretical analysis and simulation.These techniques include vertex sharing, gated clock technology (HALT command), LOD technology and static target buffering technology (BEGIN_OBJ and END_OBJ commands). In order to verify the effectiveness of these low-power programming techniques, the graphics processor chip (Firefly 1) is designed. The verification results show that the proposed low power consumption programming technology can significantly reduce the power consumption and energy consumption of the 3D graphics rendering pipeline, and the impact on the system performance is negligible.
| [1] |
Chiueh Tzi-cker, Lin Wei-jen. Characterization of static 3D graphics workloads. HWWS '97 Proceedings of the ACM SIGGRAPH/EUROGRAPHICS workshop on Graphics hardware. New York: ACM, 1997.17-24. DOI: 10.1145/258694.258703.
(  0) 0) |
| [2] |
Mitra T, Chiueh T C. Dynamic 3D graphics workload characterization and the architectural implications. Proceedings of the 32nd ACM/IEEE Int Symp. On Microarchitecture (MICRO). Piscataway: IEEE, 1999.62-71. DOI: 10.1109/MICRO.1999.809444.
(  0) 0) |
| [3] |
Roca J, Moya V, Gonzalez C, et al. Workload characterization of 3D games, IEEE International Symposium on Workload Characterization. Piscataway: IEEE, 2006.17-26. DOI: 10.1109/IISWC.2006.302726.
(  0) 0) |
| [4] |
Mochocki B C, Lahiri K, Cadambi S, et al. Signature-based workload estimation for mobile 3D graphics. Proceedings of the 43rd ACM/IEEE, Design Automation Conference. Piscataway: IEEE, 2006.592-597. DOI: 10.1145/1146909.1147062.
(  0) 0) |
| [5] |
Ma X, Deng Z, Dong M, et al. Characterizing the performance and power consumption of 3D mobile games. Computer, 2012, 46(4): 76-82. DOI:10.1109/MC.2012.190 (  0) 0) |
| [6] |
Mochicki B, Lahiri K, Cadambi S. Power Analysis of mobile 3D graphics. In Proceedings of the Conference on Design, Automation and Test in Europe. Piscataway: IEEE, 2006.502-507. DOI: 10.1109/DATE.2006.243859.
(  0) 0) |
| [7] |
Nagasaka H, Maruyama N, Nukada A, et al. Statistical power modeling of GPU kernels using performance counters. Proceedings of the 2010 International Green Computing Conference(IGCC). Piscataway: IEEE, 2010.115-122. DOI: 10.1109/GREENCOMP.2010.5598315.
(  0) 0) |
| [8] |
Ma X H, Dong M, Zhong L, et al. Statistical power consumption analysis and modeling for GPU-based computing. Proceedings of the Workshop on Power Aware Computing and Systems(HotPower). New York: ACM, 2009.
(  0) 0) |
| [9] |
Adhinarayanan V, Subramaniam B, Feng W C, et al. Online Power estimation of graphics processing units. Proceedings of the 16th IEEE/ACM International Symposium on Cluster, Cloud and Grid Computing. Piscataway: IEEE, 2016.245-254. DOI: 10.1109/CCGrid.2016.93.
(  0) 0) |
| [10] |
Kasichayanula K, Terpstra D, Luszczek P, et al. Power aware computing on GPUs. Proceedings of the 2012 Symposium on Application Accelerators in High Performance Computing(SAAHPC). Piscataway: IEEE, 2012. 64-73. DOI: 10.1109/SAAHPC.2012.26.
(  0) 0) |
| [11] |
Wu G, Greathouse J L, Lyashevsky A, et al. GPGPU performance and power estimation using machine learning. 2015 IEEE 21st International Symposium on High Performance Computer Architecture (HPCA).Piscataway: IEEE, 2015. 564-576. DOI: 10.1109/HPCA.2015.7056063.
(  0) 0) |
| [12] |
Collange S, Defour D, Tisserand A. Power consumption of GPUs from a software perspective. International Conference on Computational Science. Berlin: Springer, 2009, 5544: 914-923. DOI: 10.1007/978-3-642-01970-8_92.
(  0) 0) |
| [13] |
Rakvic R, Broussard R, Ngo H. Energy efficient iris recognition with graphics processing units. IEEE Biometrics Compendium. Pisacataway: IEEE Access, 2016, 4: 2831-2839. DOI: 10.1109/ACCESS.2016.2571747.
(  0) 0) |
| [14] |
NVIDIA Corp. NVIDIA Tegra 4 Family GPU Architecture (Whitepaper). http://www.nvidia.cn/object/white-papers-cn.html, February 2013.
(  0) 0) |
| [15] |
NVIDIA Corp. NVIDIA© Tegra© X1 NVIDIA'S New Mobile Superchip (Whitepaper). http://www.nvidia.cn/object/white-papers-cn.html, January 2015.
(  0) 0) |
| [16] |
Xing L D, Li T, Huang H, et al. Efficient modeling and analysis of energy consumption for 3D graphics rendering. Integration, the VLSI Journal, 2016, 55: 455-464. DOI:10.1016/j.vlsi.2016.02.009 (  0) 0) |
 2019, Vol. 26


