Laser tracing measurement system is a high-precision and large-size measuring instrument. Laser precision tracing measurement technology plays an increasingly important role in the fields of high-precision measurement, such as aerospace, automobile, shipbuilding and machinery manufacturing[1-4]. In 2010, a German company ETALON launched a laser tracing measurement system, which greatly improved the measurement accuracy of spatial distance by means of a laser through the patented design of the reference sphere.
High-precision machining has raised the requirement of measurement accuracy of laser tracing measurement technology. Domestic and foreign scholars extensively explored error modeling and error compensation methods of laser tracing measurement system. Lau [5]established the model of laser tracer's shafting perpendicularity error, dead path error of laser interferometry and laser beam alignment error and analyzed the ranging error caused by beam deviation, but they did not consider the performance of optical components operating under non-ideal conditions.
In a laser tracing measurement optical system, various factors may lead to measurement errors, such as the performance of optical components under non-ideal conditions and the orientation errors of optical components, which largely affect the interference fringe contrast of a laser tracing measurement optical system[6-11]. The analysis of these errors can provide theoretical basis for the improvement of accuracy, reliability evaluation, optical system design and optical component selection of the laser tracing measurement system[12-15].
A method was proposed to analyze the influences of the non-ideal spectroscopic performance of optical components and orientation errors of a laser tracing measurement optical system on the tracing performance. An analysis method for the performance optical components under non-ideal conditions and orientation errors of optical components can effectively improve the measurement accuracy of a laser tracing measurement optical system.
1 Interference Fringe Contrast Model of Laser Tracing Measurement Optical SystemThe schematic diagram of a laser tracing measurement optical system is shown in Fig. 1. The circularly polarized light generated by the laser source was transformed to linearly polarized light after passing through the analyzer P1. The p-polarization light which passed through the polarizing beam splitter PBS1 was transformed to circularly polarized light as the reference beam after transmitting through the quarter-wave plate QW1[16].

|
Fig.1 Schematic diagram of a laser tracing measurement optical system |
Meanwhile, the s-polarization light was reflected after transmitting through PBS1. The measurement part is shown in the dashed block diagram in Fig. 1. The s-polarization transmitted through the quarter-wave plate QW2 to obtain circularly polarized light. After being reflected by the reference sphere, the light transmitted through QW2 again to obtain p-polarization light. Then the light transmitted through PBS1 again and the quarter-wave plate QW3 to obtain circularly polarized light. The light transmitted through the beam splitter BS2 in the tracing part after being reflected by the cat's eye retroreflector, and the reflected light was split by BS2. The reflected light was received by a position sensitive detector (PSD). At the same time the transmission light passed through QW3 to obtain s-polarization, which was reflected by PBS1 and then transmitted through QW1 to obtain circularly polarized light as the measuring beam.
The interference part is also shown in the dashed block diagram in Fig. 1. The reference beam and measuring beam enter the interference part of a laser tracing measurement optical system and generate four interference signals with phase differences of 90°, which are received and processed by the four photodetectors in the interference part respectively. When the cat's eye retroreflector made random moves in the measurement space, the position of the laser spot reflected by the target was changed, resulting in changes in the optical path difference of the laser interferometer system. The changes in the position of the laser spot were detected by the position detector PSD. The change in the optical path difference was observed by the laser interferometer system.
The propagation direction of the laser beam was z-axis; y-axis was parallel to the incident surface of laser beam and perpendicular to z-axis; x-axis was perpendicular to y-z plane. The circularly polarized light beam emitted by a single-frequency laser had the frequency f, an amplitude of E01, and the initial phase was φ0. The light was polarized at an angle μ to the transmission axis of the analyzer P1[8].
| $ \boldsymbol{E}_{x}=\boldsymbol{i}\left[\cos \mu \cdot \boldsymbol{E}_{01} \sin \left(2 {\rm{ \mathsf{ π} }} f t+\varphi_{0}\right)\right] $ | (1) |
| $ \boldsymbol{E}_{y}=\boldsymbol{j}\left[\sin \mu \cdot \boldsymbol{E}_{01} \sin \left(2 {\rm{ \mathsf{ π} }} f t+\varphi_{0}\right)\right] $ | (2) |
where i is the polarization direction vector of p-polarization and parallel to the incident plane; j is the polarization direction vector of s-polarization and perpendicular to the incident plane.
The transmission coefficients of the p-polarization of the polarizing beam splitters (PBS1, PBS2, and PBS3) were tp1, tp2, and tp3 respectively and the reflection coefficients of the s-polarization of the polarizing beam splitters were rs1, rs2, and rs3 respectively. θ was the angle between the fast axis direction of the quarter-wave plate QW1 and the light vector vibration direction of the p-polarization. α was the angle between the fast axis direction of the quarter-wave plate QW2 and the light vector vibration direction of the p-polarization. δ was the angle between the fast axis direction of the quarter-wave plate QW3 and the light vector vibration direction of the p-polarization. The energy ratios of the transmitted light and the reflected light of the beam splitters BS1 and BS2 were A1/B1 and A2/B2 respectively. τ was the angle between the fast axis direction of the half-wave plate HW and the light vector vibration direction of the p-polarization. Δφ was the variation of the optical path difference caused by the movement of the cat's eye retro-reflector.
The reference beam and the measurement beam converged and interfered at QW1. At this position, the intensity of the reference beam was:
| $ I_{R}=\left(t_{p 1} \cdot \cos \mu+\left(1-r_{s 1}\right) \cdot \sin \mu\right) \cdot E_{01} $ | (3) |
The intensity of the measuring beam at the same position was:
| $ \begin{aligned} I_{L}= & \left\{r_{s 1} \cdot \sin \delta \cdot\left(\frac{A_{2}}{A_{2}+B_{2}}\right)^{2} \cdot \cos \delta \cdot\right. \\ & {\left[4 \cdot t_{p 1} \cdot \cos \alpha \cdot \sin \alpha+2\left(1-r_{s 1}\right)\left(\cos ^{2} \alpha-\sin ^{2} \alpha\right)\right] . } \\ & {\left[r_{s 1} \cdot \sin \mu+\left(1-t_{p 1}\right) \cdot \cos \mu\right]+} \\ & \left(1-t_{p 1}\right)\left(\cos ^{2} \delta-\sin ^{2} \delta\right)\left(\frac{A_{2}}{A_{2}+B_{2}}\right)^{2}\cdot\\ & {\left[2 \cdot t_{p 1} \cdot \cos \alpha \cdot \sin \alpha+\left(1-r_{s 1}\right)\left(\cos ^{2} \alpha-\sin ^{2} \alpha\right)\right] \cdot} \\ & \left.\left[r_{s 1} \cdot \sin \mu+\left(1-t_{p 1}\right) \cdot \cos \mu\right]\right\} \cdot E_{01} \end{aligned} $ | (4) |
The intensity of the interference signal received by the photoelectric detector PD1 was[6] :
| $ \begin{aligned} I_{\mathrm{PD} 1} & \sqrt{\left(H_{1} \cdot I_{2}+H_{2} \cdot I_{1}\right)^{2}+\left(H_{2} \cdot I_{2}-H_{1} \cdot I_{1}\right)^{2}} . \\ & \sin \left(\Delta \varphi+\varphi_{1}\right) \end{aligned} $ | (5) |
where
| $ \begin{gathered} H_{1}=t_{p 3} \cdot \cos (2 \tau) \cdot \frac{A_{1}}{A_{1}+B_{1}} \cdot \cos \theta \cdot I_{R} \\ H_{2}=\left(1-r_{s 3}\right) \cdot \cos ({\rm{ \mathsf{ π} }}+2 \tau) \cdot \frac{A_{1}}{A_{1}+B_{1}} \cdot \sin \theta \cdot I_{R} \\ I_{1}=t_{p 3} \cdot \cos (2 \tau) \cdot \frac{A_{1}}{A_{1}+B_{1}} \cdot \cos \theta \cdot I_{L} \\ I_{2}=\left(1-r_{s 3}\right) \cdot \cos ({\rm{ \mathsf{ π} }}+2 \tau) \cdot \frac{A_{1}}{A_{1}+B_{1}} \cdot \sin \theta \cdot I_{L} \\ \varphi_{1}=\arctan \left(\frac{H_{2} \cdot I_{2}-H_{1} \cdot I_{1}}{H_{1} \cdot I_{2}+H_{2} \cdot I_{1}}\right) \end{gathered} $ |
The intensity of the interference signal received by the photoelectric detector PD2 was:
| $ \begin{aligned} I_{\mathrm{PD} 2} \sim & \sqrt{\left(G_{1} \cdot K_{2}+G_{2} \cdot K_{1}\right)^{2}+\left(G_{1} \cdot K_{1}-G_{2} \cdot K_{2}\right)^{2}} . \\ & \sin \left(\Delta \varphi+\varphi_{2}\right) \end{aligned} $ | (6) |
where
| $ \begin{gathered} G_{1}=r_{s 3} \cdot \cos ({\rm{ \mathsf{ π} }}+2 \tau) \cdot \frac{A_{1}}{A_{1}+B_{1}} \cdot \sin \theta \cdot I_{R} \\ G_{2}=\left(1-t_{p 3}\right) \cdot \cos (2 \tau) \cdot \frac{A_{1}}{A_{1}+B_{1}} \cdot \cos \theta \cdot I_{R} \\ K_{1}=r_{s 3} \cdot \cos ({\rm{ \mathsf{ π} }}+2 \tau) \cdot \frac{A_{1}}{A_{1}+B_{1}} \cdot \sin \theta \cdot I_{L} \\ K_{2}=\left(1-t_{p 3}\right) \cdot \cos (2 \tau) \cdot \frac{A_{1}}{A_{1}+B_{1}} \cdot \cos \theta \cdot I_{L} \\ \varphi_{2}=\arctan \left(\frac{G_{1} \cdot K_{1}-G_{2} \cdot K_{2}}{G_{1} \cdot K_{2}+G_{2} \cdot K_{1}}\right) \end{gathered} $ |
The intensity of the interference signal received by the photoelectric detector PD3 was:
| $ \begin{aligned} & I_{\mathrm{PD3}} \sim \sqrt{\left(M_{1} \cdot N_{2}+M_{2} \cdot N_{1}\right)^{2}+\left(M_{2} \cdot N_{2}-M_{1} \cdot N_{1}\right)^{2}} . \\ & \quad \sin \left(\Delta \varphi+\varphi_{3}\right) \end{aligned} $ | (7) |
where
| $ \begin{aligned} M_{1}= & {\left[r_{s 2} \cdot \sin \theta+\left(1-t_{p 2}\right) \cdot \cos \theta\right] \cdot \frac{B_{1}}{A_{1}+B_{1}} \cdot \cos \theta \cdot I_{R} } \\ M_{2}= & {\left[r_{s 2} \cdot \cos \theta-\left(1-t_{p 2}\right) \cdot \sin \theta\right] \cdot \frac{B_{1}}{A_{1}+B_{1}} \cdot } \\ & \sin \theta \cdot I_{R} \\ N_{1}= & {\left[r_{s 2} \cdot \sin \theta+\left(1-t_{p 2}\right) \cdot \cos \theta\right] \cdot \frac{B_{1}}{A_{1}+B_{1}} . } \\ & \cos \theta \cdot I_{L}\\ N_{2}=& \left[r_{s 2} \cdot \cos \theta-\left(1-t_{p 2}\right) \cdot \sin \theta\right] \cdot \frac{B_{1}}{A_{1}+B_{1}} \cdot\\ &\sin \theta \cdot I_{L} \end{aligned} $ |
| $ \varphi_{3}=\arctan \left(\frac{M_{2} \cdot N_{2}-M_{1} \cdot N_{1}}{M_{1} \cdot N_{2}+M_{2} \cdot N_{1}}\right) $ |
The intensity of the interference signal received by the photoelectric detector PD4 was:
| $ \begin{aligned} I_{\mathrm{PD} 4} \sim & \sqrt{\left(O_{1} \cdot P_{2}+O_{2} \cdot P_{1}\right)^{2}+\left(O_{2} \cdot P_{2}-O_{1} \cdot P_{1}\right)^{2}} . \\ & \sin \left(\Delta \varphi+\varphi_{4}\right) \end{aligned} $ | (8) |
where
| $ \begin{aligned} O_{1}& =\left[t_{p 2} \cdot \cos \theta+\left(1-r_{s 2}\right) \cdot \sin \theta\right] \cdot \frac{B_{1}}{A_{1}+B_{1}} \cdot \cos \theta \cdot I_{R} \\ O_{2}& =\left[-t_{p 2} \cdot \sin \theta+\left(1-r_{s 2}\right) \cdot \cos \theta\right] \cdot \frac{B_{1}}{A_{1}+B_{1}} \cdot \sin \theta \cdot I_{R}\\ P_{1}& =\left[t_{p 2} \cdot \cos \theta+\left(1-r_{s 2}\right) \cdot \sin \theta\right] \cdot\left(\frac{B_{1}}{A_{1}+B_{1}}\right) \cdot \cos \theta \cdot I_{L}\\ P_{2}& =\left[-t_{p 2} \cdot \sin \theta+\left(1-r_{s 2}\right) \cdot \cos \theta\right] \cdot \frac{B_{1}}{A_{1}+B_{1}} \cdot\\ & \sin \theta \cdot I_{L} \end{aligned} $ |
| $ \varphi_{4}=\arctan \left(\frac{O_{2} \cdot P_{2}-O_{1} \cdot P_{1}}{O_{1} \cdot P_{2}+O_{2} \cdot P}\right) $ |
The interference fringe contrast indicates the clarity of the fringes in the interference field. The total fringe contrast in the laser tracing measurement optical system and the fringe contrast of the four-way interference signal were[7] :
| $ K_{\mathrm{TOTAL}}=\frac{2\left(E_{r}^{\prime} / E_{l}^{\prime}\right)}{1+\left(E_{r}^{\prime} / E_{l}^{\prime}\right)^{2}} $ | (9) |
where
| $ \begin{aligned} E_{r}^{\prime}= & I_{R} \cdot\left[\cos \left(2 {\rm{ \mathsf{ π} }} f t+\varphi_{0}\right)-\sin \left(2 {\rm{ \mathsf{ π} }} f t+\varphi_{0}\right)\right] \\ E_{l}^{\prime}= & -I_{L}\left[\cos \left(2 {\rm{ \mathsf{ π} }} f t+\varphi_{0}+\Delta \varphi\right)+\sin (2 {\rm{ \mathsf{ π} }} f t+\right. \\ & \left.\left.\varphi_{0}+\Delta \varphi\right)\right] \end{aligned} $ |
and
| $ K_{\mathrm{PD} 1}=\frac{2\left(E_{r 1}^{\prime} / E_{l 1}^{\prime}\right)}{1+\left(E_{r 1}^{\prime} / E_{l 1}^{\prime}\right)^{2}} $ | (10) |
where
| $ \begin{aligned} E_{r 1}^{\prime}= & I_{1} \cdot \sin \left(2 {\rm{ \mathsf{ π} }} f t+\varphi_{0}\right)-I_{2} \cdot \cos \left(2 {\rm{ \mathsf{ π} }} f t+\varphi_{0}\right) \\ E_{l 1}^{\prime}= & -H_{1} \cos \left(2 {\rm{ \mathsf{ π} }} f t+\varphi_{0}+\Delta \varphi\right)-H_{2} \sin (2 {\rm{ \mathsf{ π} }} f t+ \\ & \left.\varphi_{0}+\Delta \varphi\right) \end{aligned} $ |
and
| $ K_{\mathrm{PD} 2}=\frac{2\left(E_{r 2}^{\prime} / E_{l 2}^{\prime}\right)}{1+\left(E_{r 2}^{\prime} / E_{l 2}^{\prime}\right)^{2}} $ | (11) |
where
and
| $ K_{\mathrm{PD} 3} =\frac{2\left(E_{r 3}^{\prime} / E_{l 3}^{\prime}\right)}{1+\left(E_{r 3}^{\prime} / E_{l 3}^{\prime}\right)^{2}} $ | (12) |
where
| $ \begin{aligned} E_{r 3}^{\prime}= & M_{1} \sin \left(2 {\rm{ \mathsf{ π} }} f t+\varphi_{0}\right)-M_{2} \cos \left(2 {\rm{ \mathsf{ π} }} f t+\varphi_{0}\right) \\ E_{l 3}^{\prime}= & -N_{1} \sin \left(2 {\rm{ \mathsf{ π} }} f t+\varphi_{0}+\Delta \varphi\right)-N_{2} \cos (2 {\rm{ \mathsf{ π} }} f t+ \\ & \left.\varphi_{0}+\Delta \varphi\right) \end{aligned} $ |
and
| $ K_{\mathrm{PD} 4}=\frac{2\left(E_{r 4}^{\prime} / E_{l 4}^{\prime}\right)}{1+\left(E_{r 4}^{\prime} / E_{l 4}^{\prime}\right)^{2}} $ | (13) |
where
| $ \begin{aligned} E_{r 4}^{\prime}= & O_{1} \sin \left(2 {\rm{ \mathsf{ π} }} f t+\varphi_{0}\right)-O_{2} \cos \left(2 {\rm{ \mathsf{ π} }} f t+\varphi_{0}\right) \\ E_{l 4}^{\prime}= & -P_{1} \sin \left(2 {\rm{ \mathsf{ π} }} f t+\varphi_{0}+\Delta \varphi\right)-P_{2} \cos (2 {\rm{ \mathsf{ π} }} f t+ \\ & \left.\varphi_{0}+\Delta \varphi\right) \end{aligned} $ |
Eqs.(9)-(13) indicate the interference fringe contrast model for a laser tracing measurement optical system.
2 Influences of Various Error Sources on Interference Fringe Contrast ModelIn a laser tracing measurement optical system, the main optical components include an analyzer, beam splitters, polarizing beam splitters, quarter-wave plates, and a half-wave plate. Based on Eqs. (9)-(13), the influences of the performance of optical components under non-ideal conditions and orientation errors on the interference fringe contrast of a laser tracing measurement optical system were investigated below.
2.1 Influences of Placement Angle of AnalyzerIn the absence of other error sources, the incident light was circularly polarized at an azimuth of μ to the transmission axis of the analyzer. According to the established models (Eqs. (9)-(13)), the values of interference fringe contrast were obtained (as shown in Table 1). The simulation results based on the interference fringe contrast model shows that the placement angle of the analyzer had an influence on the interference fringe contrast. If light was polarized at an angle μ of 65° to the transmission axis of the analyzer and passed through the analyzer, the contrast of the four-way interference fringe reached 0.9996. In this case, the interference fringes of the system were the clearest, thus improving the measurement precision. When the placement angle of the analyzer was not equal to 65°, the interference fringe contrast of the system decreased significantly, and when μ=25°, the interference fringe contrast (0.4263) decreased by 57%. When μ=85°, the interference fringe contrast (0.3528) is decreased by 65%. Therefore, when the placement angle of the analyzer was 65°, a laser tracing measurement optical system achieved the highest quality beam with the highest interference fringe contrast and stability.
| Table 1 Interference fringe contrast under different analyzer placement angles |
2.2 Influences of BS Split Ratio
The change in the split ratio of the beam splitter BS1 in the interference part and the beam splitter BS2 in the tracing part affected the energy of the interference signal, thus changing the contrast value of interference fringe.
Table 2 shows the interference fringe contrast values of a laser tracing measurement optical system with a split ratio of BS2 of 7∶3 and different split ratios of BS1. Under the fixed split ratio of BS2 of 7∶3 and different split ratios of BS1, the interference fringe contrast value of the resulting interference signal remained unchanged.
| Table 2 Interference fringe contrast under different BS1 split ratios and split ratio of BS2 of 7∶3 |
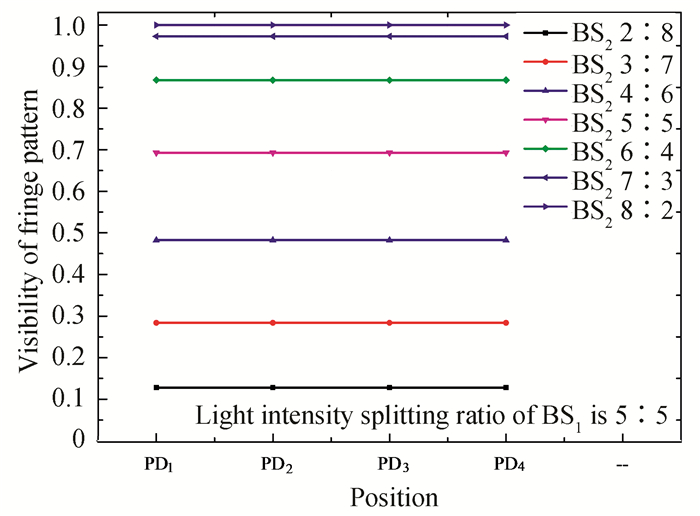
Fig. 2 shows the change in the contrast of the resulting interference signal of the laser tracing measurement system with a split ratio of BS1 of 5∶5 and different split ratios of BS2. Under the fixed split ratio of BS1, the changing split ratio of BS2 shows the significant influence on the fringe contrast of the resulting interference signal. When the split ratio of BS2 was changed from 8∶2 to 2∶8, the contrast of interference fringes decreased by 87% from 0.9996 to 0.1281. However, in order to obtain interference fringes with high quality and meet the requirement of the tracing measurement system, the reflected light of beam splitter in the tracing part should be applied to the position detector PSD to achieve the tracing measurement of the cat's eye retro-reflector. Under the split ratio of beam splitters in the interference part (BS1) of 5∶5, when the splitting ratio of BS2 changed from 2∶8 to 8∶2, the fringe contrast of the interference signals received by the photodetectors increased, but the injection light intensity onto the PSD reflected by BS2 decreased.
|
Fig.2 Interference fringe contrast under the split ratio of BS1 of 5∶5 and different BS2 split ratios |
2.3 Influences of Non-ideal Spectroscopic Performance of PBS for Laser Tracing Measurement Optical System
With a split ratio of BS1 of 5∶5 and the split ratio of BS2 of 7∶3, the contrast of the interference fringe of a laser tracing measurement optical system was optimum. An effect of the PBS with non-ideal spectroscopic performance on the contrast of interference fringes were explored with the above conditions. The transmittance and the reflectance of polarizing beam splitter were respectively Tp and Rs.
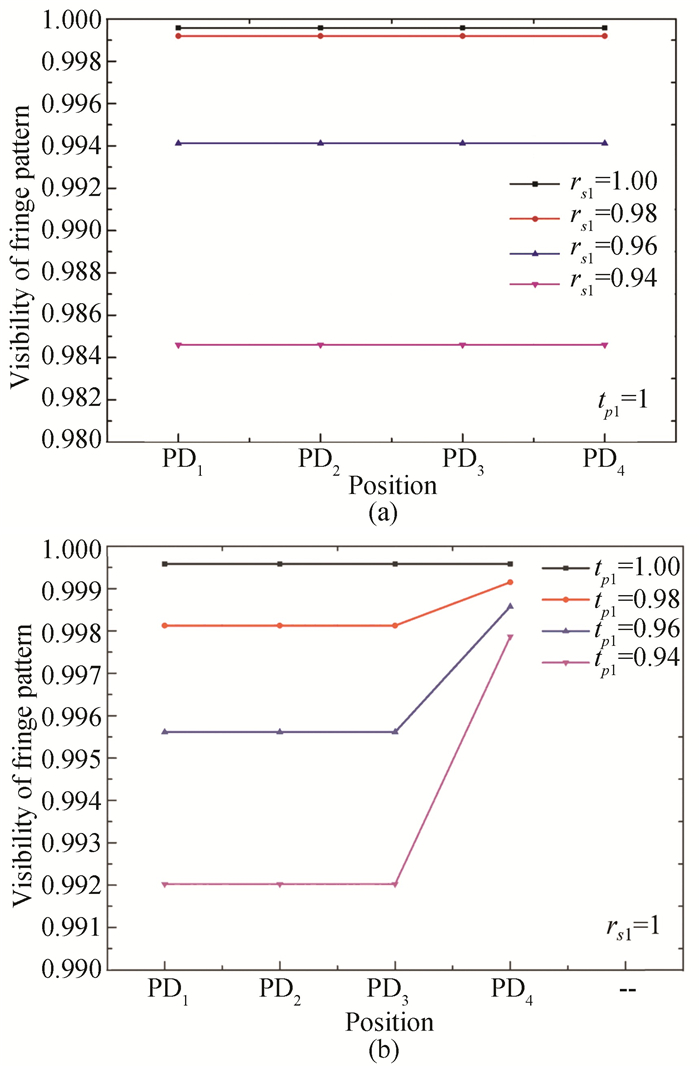
The values of interference fringe contrast with ideal transmittance and different reflectivities are plotted in Fig. 3(a). With an ideal transmittance, the value of interference fringe contrast decreased with the decrease in the reflectivity and the interference fringe contrast of the signals obtained by the four receivers PD1, PD2, PD3, and PD4 were the same. When the reflectivity of the PBS1 decreased from 1.0000 to 0.9400, the values of interference fringe contrast decreased by about 1.5% from 0.9996 to 0.9846.
|
Fig.3 (a) Interference fringe contrast with different reflectivities and PBS1 transmittance of 1; (b) Interference fringe contrast under different transmittances and PBS1 reflectivity of 1 |
Fig. 3(b) shows interference fringe contrast with ideal reflectivity and different transmittances. With ideal reflectivity, the value of interference fringe contrast decreased with a decrease in the transmittance. The contrast values of the interference fringes received by the photoelectric receivers PD1, PD2 and PD3 were lower than that of the interference fringe received by PD4. When the transmittance of PBS1 decreased from 1.0000 to 0.9400, the value of interference fringe contrast decreased by about 0.76% from 0.9996 to 0.9920.
According to the models (Eqs. (9)-(13)), the effects of PBS2 and PBS3 with non-ideal spectroscopic performance on the interference fringe contrast in laser tracing optical system were analyzed. Table 3 shows the interference fringe contrast of PBS2 under the ideal transmittance and different reflectivities. Table 4 shows the interference fringes contrast value of PBS2 under the ideal reflectivity and different transmittances. Table 5 shows the interference fringes contrast value of PBS3 under the ideal transmittance and different reflectivities. Table 6 shows the interference fringes contrast value of PBS3 under the ideal reflectivity and different transmittances. It can be seen that PBS2 and PBS3 with non-ideal spectroscopic performance had less influence on the interference fringe contrast in laser tracing optical systems. What's more, when PBS1, PBS2 and PBS3 were with non-ideal spectroscopic performance at the same time, the interference fringe contrast in a laser tracing optical system was seldom changed.
| Table 3 Interference fringe contrast under different reflectivities and PBS2 transmittance of 1 |
| Table 4 Interference fringe contrast under different transmittances and PBS2 reflectivity of 1 |
| Table 5 Interference fringe contrast under different reflectivities and PBS3 transmittances of 1 |
| Table 6 Interference fringe contrast under different transmittances and PBS3 reflectivity of 1 |
2.4 Influences of Quarter-wave Plate Orientation Errors
In a laser tracing measurement optical system, when the angle between the incident beam and quarter-wave plate fast axis was 45°, the quarter-wave plate can convert the linearly polarized incident beam into one with circular polarization and convert the circularly polarized incident beam into the linearly polarized beam with the polarization vector orthogonal to that of the incident beam. When other error sources did not exist, the incident light was polarized at an azimuth of 45°+e to the fast axis of the quarter-wave plate, where e represents the orientation errors of the quarter-wave plate QW1. According to the models (Eqs. (9)-(13)) the values of interference fringe contrast of a laser tracing measurement optical system are shown in Table 7.
| Table 7 Interference fringe contrast under different orientation errors of QW1 |
Table 7 shows the influences of the orientation errors (e) of the quarter-wave plate QW1 on interference fringe contrast. It can be seen that orientation errors of QW1 have little effect on the interference fringe contrast.
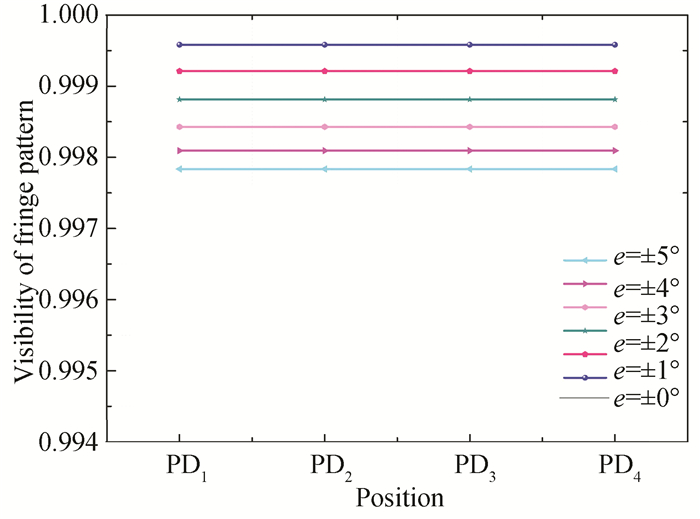
Fig. 4 shows the influences of the orientation errors (e) of the quarter-wave plate QW2 on interference fringe contrast. If no other error source existed, the interference fringe contrast decreased with an increase in e and the interference fringe contrasts of the photoelectric receivers PD1 to PD4 were the same. When e of QW2 varied from 0° to ±5°, the value of interference fringe contrast decreased by about 0.18% from 0.9996 to 0.9978.
|
Fig.4 Interference fringe contrast for different orientation errors of QW2 |
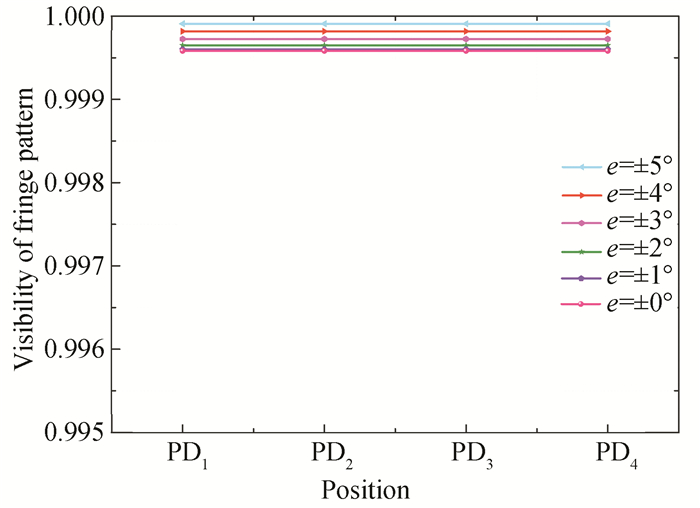
Fig. 5 demonstrates the influence of the orientation errors (e) of the quarter-wave plate QW3 on interference fringe contrast. The contrast value increased with an increase in the e. The interference fringe contrasts of the photoelectric receivers PD1 to PD4 were the same. As shown in Fig. 5, the e of the analyzer varied from 0° to 5°, whereas the value of interference fringe contrast increased by about 0.03% from 0.9996 to 0.9999.
|
Fig.5 Interference fringe contrast under different orientation errors of QW3 |
2.5 Influences of half-wave Plate Orientation Error
The behavior of a half-wave plate HW on a beam of plane-polarized light was completely different from that of a quarter-wave plate. If the incident plane of vibration was at an azimuth 22.5° with respect to the fast axis of the half-wave plate, the transmitted beam would rotate 45° relative to the azimuth of the incident beam. The beam was emitted by the half-wave plate and split by PBS2 to achieve uniform beam splitting. It is assumed that the angle between the fast axis and the incident plane of vibration was 22.5°+ζ when HW was oriented, where ζ represents the orientation errors of the half-wave plate. According to the models(Eqs. (9)-(13)), supposing that other error sources did not exist, when ζ of the half-wave plate varied from 0° to 5°, the interference fringe contrast of a laser tracing measurement optical system remained unchanged (Table 8).
| Table 8 Contrast values of interference fringes by the orientation errors of HW |
3 Zemax-Based Simulation Experiment of Laser Tracing Measurement Optical System
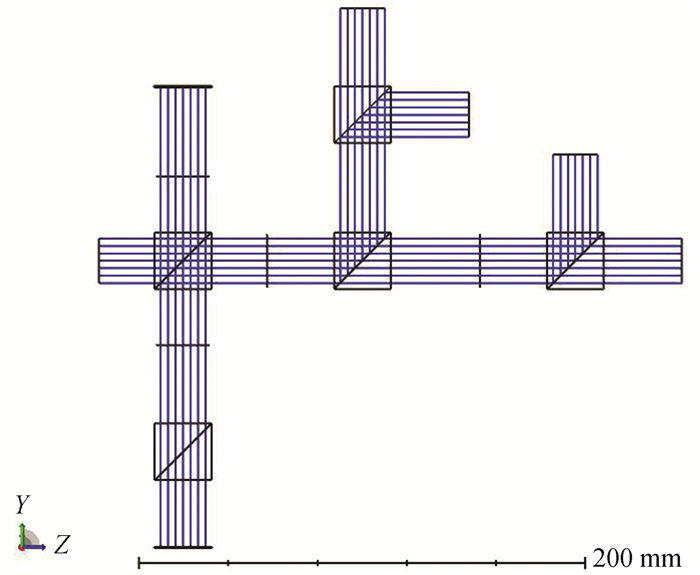
To validate this theoretical model of the interference fringe contrast, the optical system simulation experiments of the laser tracing measurement were conducted based on ZEMAX. In a laser tracing measurement optical system, the polarizing beam splitter and beam splitter were realized by the multiple structural parameters and the analyzer, the quarter-wave plate, and the half-wave plate were realized by the Jones matrix in ZEMAX to optimize the design and evaluate the overall performance of the imaging optics[17].The ZEMAX-based laser tracing measurement optical system simulation model well-established in this study is shown in Fig. 6. The basis of the simulation conditions is shown in Table 9.
|
Fig.6 Simulation model diagram of ZEMAX for laser tracing measurement optical system |
| Table 9 Basis of simulation conditions |
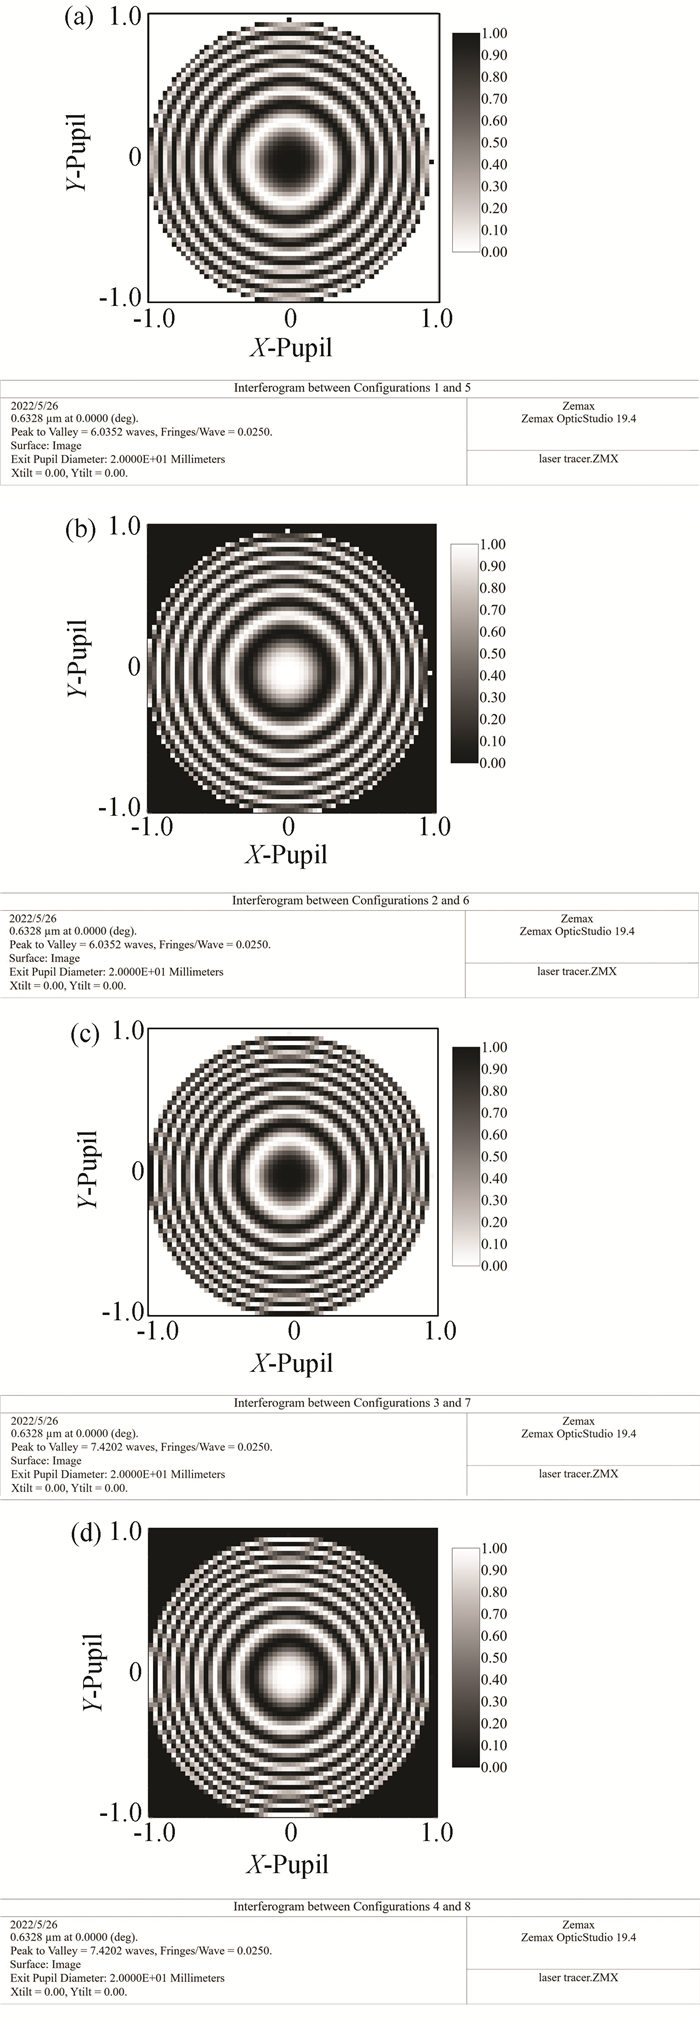
In ZEMAX, the parameters were set as follows. The angle between the transmission axis of the analyzer was 65°; the angle between the polarization direction of linearly polarized beam and the fast axis of the quarter-wave plate was 45°; the angle between the fast axis of the half-wave plate and the vibration direction of linearly polarized incident beam was 22.5°; The transmittance and reflectance of the polarizing beam splitters PBS1, PBS2, and PBS3 were equal to 1; the split ratio of BS1 is 5∶5; the split ratio of BS2 was 7∶3. The interferograms received by photodetectors PD1, PD2, PD3 and PD4 in a laser tracing measurement optical system are shown in Fig. 7.
|
Fig.7 Simulation interferogram of laser tracing measurement optical system based on ZEMAX simulation; (a) Interferogram obtained by PD1; (b) Interferogram obtained by PD2; (c) Interferogram obtained by PD3; (d) Interferogram obtained by PD4 |
3.1 Influences of Placement Angle of Analyzer
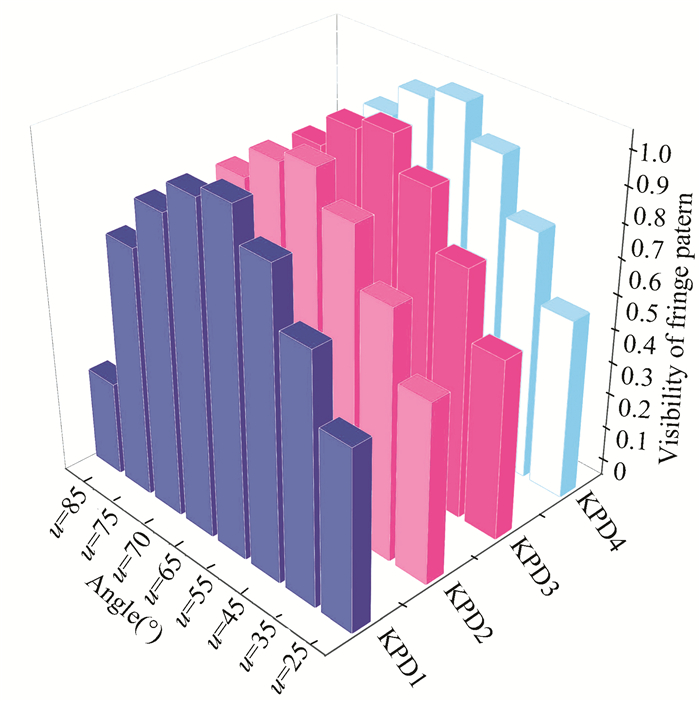
According to the ZEMAX simulation model established in Fig. 6, supposing that no other error sources exist, the simulation results based on ZEMAX show that the placement angle of the analyzer has a great influence on the interference fringe contrast. If light was polarized at an angle of 65° to the transmission axis of the analyzer and passed through the analyzer, the interference fringe contrasts were above 0.9900 and the interference fringes of the system were the clearest as shown in Fig. 8. These conclusions are consistent with those in Section 2.1.
|
Fig.8 Simulation results of interference fringe contrast under different analyzer placement angles based on ZEMAX |
3.2 Influences of BS Split Ratio
According to the ZEMAX simulation model depicted in Fig. 6, the contrast values under the different split ratios of BS1 and BS2 were obtained (Table 10 and Table 11). Table 10 shows the interference fringe contrast values of a laser tracing measurement optical system. Under the fixed split ratio of BS2 (7∶3), when the split ratio of BS1 varied from 8∶2 to 2∶8, the interference fringe contrast value was not changed. Similarly, for a split ratio of BS1 (5∶5), when the split ratio of BS2 varied from 8∶2 to 8∶2, the interference fringe contrast decreased by 44% from 0.9975 to 0.5613(Table 11).
| Table 10 Interference fringe contrast under different BS1 split ratios and the split ratio of BS2 of 7∶3 |
| Table 11 Interference fringe contrast under different BS2 split ratios and the split ratio of BS1 of 5∶5 |
3.3 Influences of Non-ideal Spectroscopic Performance of PBS for Laser Tracing Measurement Optical System
According to the ZEMAX simulation model established in Fig. 6, the influence of PBS with the non-ideal spectroscopic performance of a laser tracing measurement optical system on interference fringe contrast can be discussed. Without considering error sources, interference signals received by PD1, PD2, PD3 and PD4 were the same. As shown in Table 12, when the transmittance was not ideal, the interference fringe contrast decreased with the decrease in the reflectivity. The reflectivity of the PBS1 shows limited effect on the interference fringe contrast. However, when PBS2 or PBS3 shows the non-ideal spectroscopic performance, the interference fringe contrast remained 0.9975, indicating that interference fringe contrast was seldom changed, as shown in Table 13 and Table 14. Furthermore, all of the polarizing beam splitters with the non-ideal spectroscopic performance at the same time in the entire laser tracing measurement optical system had little effect on the interference fringe contrast value. The result is consistent with the analysis conclusion in Section 2.3.
| Table 12 Contrast values of PD1 to PD4 in different cases of tp1 and rs1 of PBS1 |
| Table 13 Contrast values of PD1 to PD4 in different cases of tp2 and rs2 of PBS2 |
| Table 14 Contrast values of PD1 to PD4 in different cases of tp3 and rs3 of PBS3 |
3.4 Influences of Quarter-wave Plate Orientation Errors
According to the ZEMAX simulation model established in Fig. 6, assuming that there is no other error source of interference fringe contrast, the influences of the orientation errors of QW1 and QW2 on interference fringe contrast were discussed (Table 15 and Table 16). The interference fringe contrast decreased with the increase in e. When e increased from 0° to 5°, interference fringe contrast of QW1 decreased from 0.9986 to 0.9949 (Table 15). However, the interference fringe contrast of QW2 remained 0.9974 (Table 16). As shown in Table 17, when e increased from 0° to 5°, interference fringe contrast of QW3 increased by 0.09% from 0.9975 to 0.9985. The interference fringe contrasts of the photoelectric receivers PD1 to PD4 were the same. According to the results, orientation errors (e) of QW1, QW2 and QW3 had different effects on the interference fringe contrast. This is consistent with the conclusion in Section 2.4.
| Table 15 Interference fringe contrast under different QW1 orientation errors |
| Table 16 Interference fringe contrast under different QW2 orientation errors |
| Table 17 Interference fringe contrast under different QW3 orientation errors |
3.5 Influences of Half-wave Plate Orientation Error
According to the ZEMAX simulation model established in Fig. 6, assuming that there was no other source of interference fringe contrast, when ζ of the half-wave plate varied from 0° to 5°, the interference fringe contrast of a laser tracing measurement optical system remained to be 0.9975 (Table 18). This result verified the conclusion in Section 2.5.
| Table 18 Interference fringe contrast under different orientation errors of HW |
In conclusion, the simulation results obtained with the ZEMAX-based laser tracing measurement optical system model are consistent with the analysis results of the interference fringe contrast model. It demonstrates the correctness of the interference fringe contrast model of a laser tracing measurement optical system proposed in this study.
4 ExperimentBased on the comprehensive fringe contrast model of the laser tracing measurement system established in this paper, the experiment about the influence on the tracing performance brought by the fringe contrast of the laser tracing measurement optical system was carried out.
The laser tracing measurement optical system is a position-following closed-loop control system. When the tracing target is displaced, the position of the laser spot reflected by the cat's eye will shift[13]. Its tracing process was achieved by a built-in PSD. When the target was not displaced, the incident beam split by the beam splitter BS2 injected onto the center of the PSD. The photocurrent generated by the PSD was zero. When the position of the laser spot changed, the PSD generated different photocurrent signals according to the spot position. After the amplification and calculation of the photocurrent, the displacement of the incident beam can be determined, which provided key data for the tracing control of the laser tracing measurement optical system.
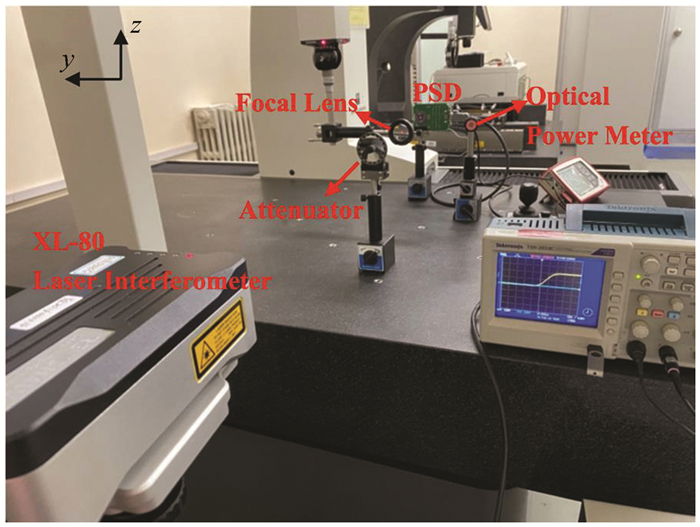
The experimental process is consistent with the tracing process of the laser tracing measurement optical system. The experimental setup is shown in Fig. 9. A Renishaw Laser Interferometer XL-80 was used as laser source. The laser beam was injected onto the center of the PSD. The incident light intensity was 0.315 mW. The model of the PSD was Hamamatsu S1880. The photo sensitivity of the PSD was 0.6A/W, and the saturation current was 0.5 mA. A lens was added to the light path, which was connected with the probe of the coordinate measuring machine (CMM) by a rod. The lens can focus the laser beam. An attenuator was placed between the laser source and the lens. It can be known from '3.2 Influences of BS split ratio' that when the splitting ratio of BS2 changed from 2∶8 to 8∶2, the fringe contrast of the interference signals received by the photodetectors PD1 to PD4 increased, but the injection light intensity onto the PSD reflected by BS2 decreased. By adjusting the attenuator, the intensity of the incident beam of the PSD can be changed.
|
Fig.9 Experiment of tracing performance of laser tracing measurement optical system |
A coordinate system was established with the origin as the center of the PSD. The x direction was the same as the z direction of the CMM. The y direction was the same as the y direction of the CMM. When the lens was in the initial position, the x and y position signals output by the PSD were both 0 V. When the CMM controlled the lens to move in the y direction from the initial position, the position of the laser beam on the PSD was shifted in the y direction. The response time of the y-direction position signal of the PSD rising to 4 V was recorded under different incident light intensities. The attenuator was used to adjust the incident light intensity to 0.315mW, 0.284mW, 0.252mW and 0.221mW respectively. Under the same incident light intensity, the response time of the tracing system was measured 10 times repeatedly. The measurement results are shown in Table 19. P in Table 19 represents the light intensity measurement of incident light. Δtr represents the response time measurement of the tracing system.
| Table 19 Experimental results of the relationship between the light intensity of the incident PSD laser beam and the response time |
The standard deviation of the mean value was obtained to evaluate the reliability of the multi-measurement average of the PSD response time. The standard deviation of the mean value can be expressed as:
| $ \mathop \sigma \nolimits_{\overline {\Delta {t_r}} } = {{\sqrt {{{\sum\limits_{i = 1}^{10} {\left( {\Delta {t_r} - \overline {\Delta {t_r}} } \right)} } \over {10 - 1}}} } \over {\sqrt {10} }} $ | (14) |
where
| $ \Delta t_{r}=\overline{\Delta t}_{r} \pm 2.26 \cdot \sigma_{\Delta t_{r}} $ | (15) |
The experimental results show that when the incident light intensity was 0.315 mW, the response time of the system was △tr=371.5±2.28 ms. When the incident light intensity changed to 0.284 mW, the response time of the system was △tr=389.9±3.46 ms. When the incident light intensity changed to 0.252 mW, the response time of the system was △tr=391.2±2.40 ms. When the incident light intensity changed to 0.221 mW (i.e., when the BS2 split ratio become 8∶2), the response time of the system was △tr=395.2±2.28 ms. When splitting ratio of BS2 increased, the contrast of the interference fringes increased. But at the same time, due to the weakening of the incident light intensity of the PSD caused by the change of BS2 splitting ratio, the response time of the tracing system increased by 23.7 ms. As a result, the tracing performance of the laser tracing measurement optical system was degraded.
5 ConclusionsThe influence of the non-ideal spectroscopic performance of optical components and orientation errors of a laser tracing measurement optical system on the tracing performance was explored using the model proposed in this study. The experimental results verified the proposed model. The following conclusions can be drawn:
1) The placement angle of the analyzer has a great influence on the interference fringe contrast. When the angle of the polarized light to the analyzer's transmission axis increased from 65° to 85°, each contrast of the four-way interference fringes decreased by 65% from 0.9996 to 0.3528. In a laser tracing measurement optical system, if beams were polarized at an angle of 65° to the transmission axis of the analyzer and passed through the analyzer, the interference fringe of the system were the clearest.
2) For the fixed split ratio of BS1, the split ratio of BS2 showed a significant influence on the fringe contrast of the resulting interference signal and light intensity onto the PSD reflected by BS2. The measurement experiments verified that the influence was significant. When splitting ratio of BS2 increased, the contrast of the interference fringes increased. Due to the weakening of the incident light intensity of the PSD caused by the change of the BS2 splitting ratio, the response time of the tracing system increased by 23.7 ms. As a result, the tracing performance of the laser tracing measurement optical system was degraded.
3) In the laser tracing measurement optical system, the orientation errors of the half-wave plate or the quarter-wave plate in the interference part had little effect on the interference fringe contrast. In addition, when the performance of the polarizing beam splitter in the interference part and tracing part in an entire optical system were under non-ideal conditions, the interference fringe contrast in a laser tracing optical system was seldom changed. Under the fixed split ratio of the beam splitter in the tracing part and different split ratios of the beam splitter in the interference part, the interference fringe contrast showed minor changes.
This study provides an important theoretical basis for evaluating and improving the accuracy and reliability of laser tracing measurement systems.
| [1] |
Wendt K, Franke M, Härtig F. Measuring large 3D structures using four portable tracking laser interferometers. Measurement, 2012, 45(10): 2339-2345. DOI:10.1016/j.measure-ment.2011.09.020 (  0) 0) |
| [2] |
Teoh P L, Shirinzadeh B, Foong C W, et al. The measurement uncertainties in the laser interferometry based sensing and tracking technique. Measurement, 2002, 32(2): 135-150. DOI:10.1016/S0263-2241(02)00006-4 (  0) 0) |
| [3] |
Mayer J R R, Parker G A. A portable instrument for 3-D dynamic robot measurement using triangulation and laser tracking. IEEE Transactions on Robotics and Automation, 1994, 10(4): 504-529. DOI:10.1109/70.313100 (  0) 0) |
| [4] |
Takatsuji T, Goto M, Kirita A, et al. The relationship between the measurement error and the arrangement of laser trackers in laser trilateration. Measurement Science and Technology, 2000, 49(5): 477-483. DOI:10.1088/0957-0233/11/5/305 (  0) 0) |
| [5] |
Lau K, Hocken R J, Haight W C. Automatic laser tracking interferometer system for robot metrology. Precision Engineering-Journal of the American Society for Precision Engineering, 1986, 8(1): 3-8. DOI:10.1016/0141-6359(86)90002-4 (  0) 0) |
| [6] |
Muralikrishnan B, Sawyer D, Blackburn C. ASME B89.4.19 performance evaluation tests and geometric misalignments in laser trackers. Journal of Research of the National Institute of Standards and Technology, 2009, 114(1): 21-35. (  0) 0) |
| [7] |
Azzam R M A. Infrared broadband 50%-50% beam splitters for s-polarized light. Applied Optics, 2006, 45(19): 4572-4575. DOI:10.1364/AO.45.004572 (  0) 0) |
| [8] |
Pezzaniti J L, Chipman R A. Angular dependence of polarizing beam-splitter cubes. Applied Optics, 1994, 33(10): 1916-1929. DOI:10.1364/AO.33.001916 (  0) 0) |
| [9] |
Chen H F, Jiang B, Shi Z Y. Synthetic model of nonlinearity errors in laser heterodyne interferometry. Applied Optics, 2018, 57(14): 3890-3901. DOI:10.1364/AO.57.003890 (  0) 0) |
| [10] |
Li L, Dobrowolski J A, Sullivan B T. Novel thin film polarizing beam splitter and its application in high-efficiency projection displays. Proceedings of the Society of Photo-optical Instrumentation Engineers (SPIE), 1999, 3634: 52-62. DOI:10.1117/12.349364 (  0) 0) |
| [11] |
Li L, Dobrowolski J A. High-performance thin-film polarizing beam splitter operating at angles greater than the critical angle. Applied Optics, 2000, 39(16): 2754-2771. DOI:10.1364/AO.39.002754 (  0) 0) |
| [12] |
Chen X G, Ren Z W, Yuki S, et al. Optimal polarization modulation for orthogonal two-axis Lloyd's mirror interference lithography. Optics Express, 2017, 25(19): 22237-22252. DOI:10.1364/oe.25.022237 (  0) 0) |
| [13] |
Chen H F, Sun Y Q, Wang Y W, et al. High-precision laser tracking measurement method and experimental study. Chinese Journal of Lasers, 2018, 45(1): 166-173. DOI:10.3788/CJL201845.0104003 (  0) 0) |
| [14] |
Hou W M. Optical parts and the nonlinearity in heterodyne interferometers. Precision Engineering, 2006, 30(3): 337-346. DOI:10.1016/j.precisioneng.2005.11.005 (  0) 0) |
| [15] |
Keem T, Gonda S, Misumi I, et al. Removing nonlinearity of a homodyne interferometer by adjusting the gains of its quadrature detector systems. Applied Optics, 2004, 43(12): 2443-2448. DOI:10.1364/AO.43.002443 (  0) 0) |
| [16] |
Keem T, Gonda S, Misumi I, et al. Simple, real-time method for removing the cyclic error of a homodyne interferometer with a quadrature detector system. Applied Optics, 2005, 44(17): 3492-3498. DOI:10.1364/AO.44.003492 (  0) 0) |
| [17] |
Bisesto F, Castellano M, Chiadroni E, et al. Zemax simulations describing collective effects in transition and diffraction radiation. Optics Express, 2018, 26(4): 5075-5082. DOI:10.1364/OE.26.005075 (  0) 0) |
 2023, Vol. 30


